To produce wide range of grinds "Turkish, Espresso, Capsule, Pod, Moka and Percolator" - Newscai

Pagina creata da Federico Lanza
 
CONTINUA A LEGGERE
To produce wide range of grinds "Turkish, Espresso, Capsule, Pod, Moka and Percolator" - Newscai
magazine

                                                                                                                                                            www.newscai.com

                                                                                                                                                            Espressamente per torrefattori
                                                                                                                                                            Publication containing news on the world of coffee   Dicembre 2019 I December 2019

                                                                                                                                                              Coffee Grinder type “Spheric”
                                                                                                                                                              Mod.500-800-1000-1200
CoffeeTrend - Spedizione in A.P. - 45%, D.L. 353/2003 (conv. in L. 27/02/2004 n° 46) Art. 1, comma 2/DCB “TS” - Tassa Pagata/Taxe Parçue/Economy/Compatto

                                                                                                                                                                                              To produce
                                                                                                                                                                                              wide range of grinds
                                                                                                                                                                                              “Turkish, Espresso, Capsule,
                                                                                                                                                                                              Pod, Moka and Percolator”
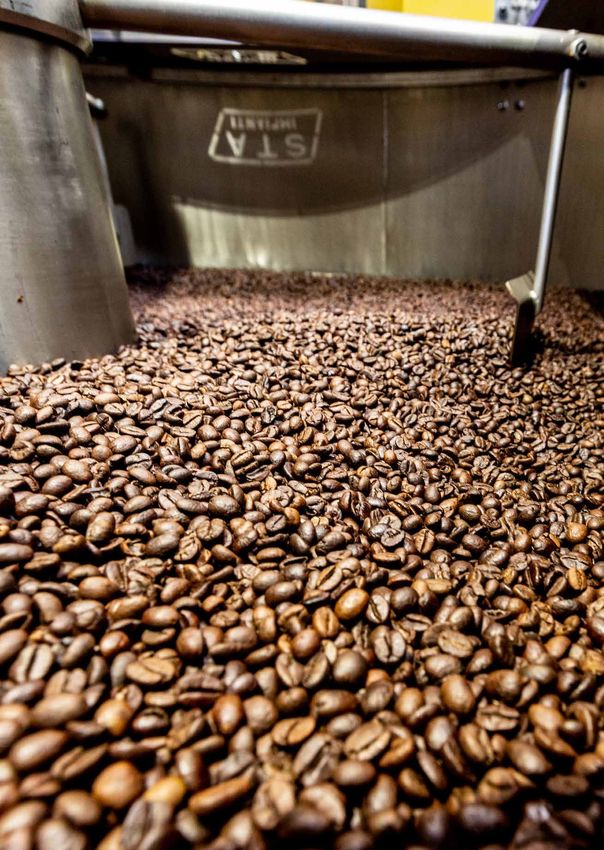
To produce wide range of grinds "Turkish, Espresso, Capsule, Pod, Moka and Percolator" - Newscai
Sommario                                                                                                                                          Editorial
Summary                                                             Editoriale                                                                    In the traditional trade structure for coffee, the raw
                                                                                                                                                  material is sourced through importers, and then
                                                                                                                                                  distributed to roasters in Europe. This still repre-
                                                                    Nella tradizionale struttura commerciale del caffè,                           sents the bulk of the market, but direct trade initia-
                                                                    la materia prima proviene da importatori (trad-                               tives are increasing. Direct trade is a term used by
                                                                    ers) e quindi distribuita ai torrefattori, tuttavia le                        coffee roasters who buy straight from the growers,
                                                                    iniziative di commercio diretto sono in aumento,                              cutting out both the traditional middleman buyers
                                                                    un ponte diretto tra quest’ultimi e i coltivatori che                         and sellers. Most roasters engaged in direct trade
                               EDITORIALE                                                                                                         are located in Northern Europe, where the con-
                                                                    consente di bypassare i tradizionali acquirenti e
                                EDITORIAL
                                                                    venditori. La maggior parte dei torrefattori im-                              cept appeals most to consumers. The demand for
                                                                    pegnati nel commercio diretto si trova nel Nord                               transparency in the coffee chain has strengthened
                  ANALISI DI MERCATO
                                                                    Europa, dove il concetto attira maggiormente i                                the links between coffee producers and roasters.
         8          MARKET ANALYSIS
                           Traguardi storici
                                                                    consumatori. La richiesta di trasparenza nella
                                                                    catena del caffè ha rafforzato i legami tra produ-
                                                                                                                                                  More and more coffee houses and sustainability-
                                                                                                                                                  driven brands try to create a direct link to the farm-
                         per l’Italia del caffè
                                                                    ttori di caffè e torrefattori, sempre più interessati                         er, also satisfying the consumers’ demand to be
                    Historical milestones for                                                                                                     more closely connected to the source. Through the
                                                                    alla diffusione sul mercato di brand orientati alla
                italian green coffee imports
                                                                    sostenibilità, attraverso un dialogo diretto con                              Internet, producers and roasters can more easily
                                                                    chi il caffè lo coltiva in concreto, soddisfacendo                            find each other and establish partnerships.
 22           PAESI CONSUMATORI
            CONSUMING COUNTRIES                                     anche la domanda dei consumatori di essere più
                                                                    strettamente collegati alla fonte. Attraverso Inter-
                                                                                                                                                  The direct trade between producers / exporters
                                                                                                                                                  and roasters has normally meant that the importer
               Quattro tipologie di mercato
                caratterizzano la domanda                           net, produttori e torrefattori possono incrociarsi                            is taken out of the equation. For some small-scale
                            globale di caffè                        facilmente e stabilire partnerships. Il commercio                             roasters, direct trade was translated into new chal-
                                                                    diretto comporta normalmente l’eliminazione                                   lenges and market risks such as logistics, trans-
                        Four market types
             shaping global coffee demand                           dell’importatore. Per alcuni torrefattori su pic-                             action costs, pre-financing, contract defaults, non-
                                                                    cola scala, il commercio diretto è stato tradotto                             compliances and other. For this reason, the role
                                                                    in nuove sfide e rischi di mercato come logistica,                            of importers in performing these tasks is crucial to
            FOCUS SULLE AZIENDE                                     costi di transazione, prefinanziamenti, inadempi-                             several roasters. In some cases, importers still in-
      SPOTLIGHTS ON ENTERPRISES                                     enze contrattuali, ecc. Per questo motivo, il ruo-                            termediate the contact and carry out basis tasks,
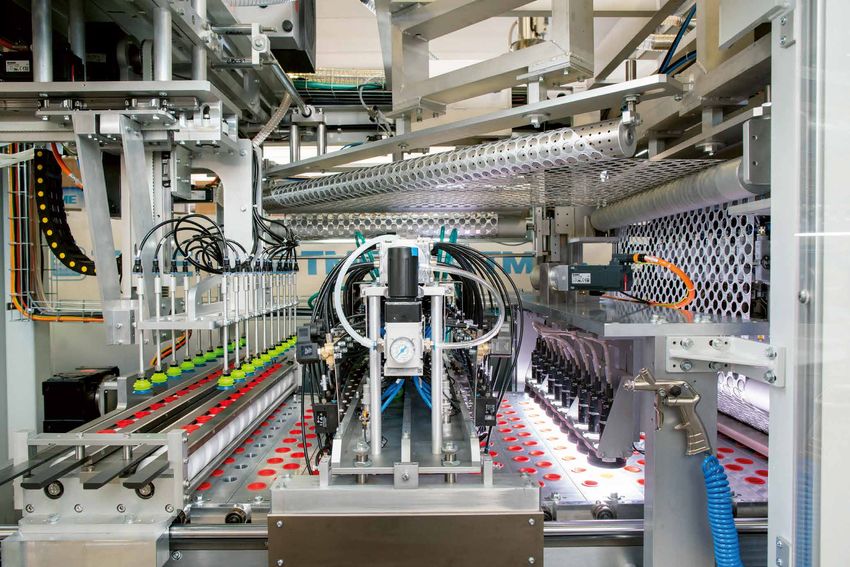
                               NTE Process:                         lo degli importatori e dei relativi servizi e garanzie                        but give roasters good access to producers. Other
       36       rivoluzione nelle tecnologie                        rappresentano oggi ancora un valore aggiunto di                               roasters have successfully established direct and
                    di lavorazione del caffè
                                                                    cruciale importanza per molti. In alcuni casi, gli                            long-term relationships to producers, and have
                   NTE Process: revolution
                                                                    importatori continuano a intermediare il contatto                             managed to create an authentic product portfolio
        in coffee processing technologies
                                                                    e svolgono attività di base, consentendo al con-                              to consumers. Another interesting development
                                                                    tempo un diretto contatto con i produttori, re-                               is the involvement of large roasters in the special-
              42         Le “green machine”
                              di STA Impianti                       alazioni dirette a lungo termine per una maggior                              ity coffee segment. These companies increasingly
                                                                    trasparenza sul prodotto acquistato, soprattutto                              adopt terms common to the speciality market such
                                STA Impianti
                           “green machines”                         se l’argomento di interesse ricade sui caffè spe-                             as single origin and premium quality (such as pre-
                          industrial roasters                       ciali (Specialty) e prodotti premium, per i quali                             mium coffee capsules). They are thus appealing to
                                                                    sempre più consumatori si dimostrano attenti                                  consumers who look for signs of quality and self-
                                                                    alla filiera produttiva.                                                      assurance.
46 EXHIBITIONS
            FIERE ED EVENTI
                AND EVENTS
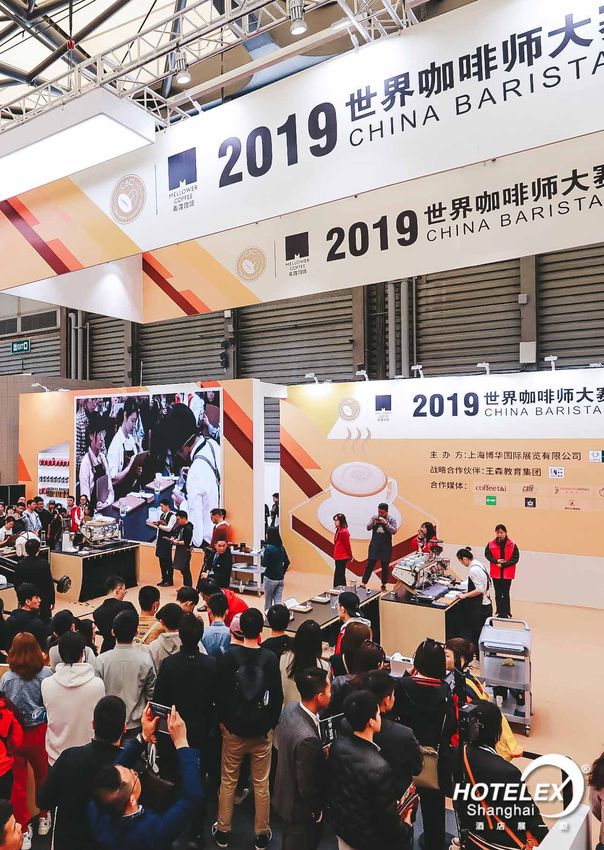
              159.267 visitatori in 4 giorni,
               Hotelex Shanghai raggiunge
                        un altro traguardo
              159,267 visitors in four days,
             the scale of Hotelex Shanghai
                reached another year high

       54          ADVERTISER INDEX                   MA200            MA300             TA50/100          TA150/200       TA250 Special     TA250/400   Criomak 600/1000   Criomak 1000-4AX   Angel       Angel PG
                INDICE INSERZIONISTI

                                                      Proudly made in Italy.
4 5   CoffeeTrend magazine Dicembre I December 2019   Find out more at: www.colombini.srl or contact your local agent. Follow us on social
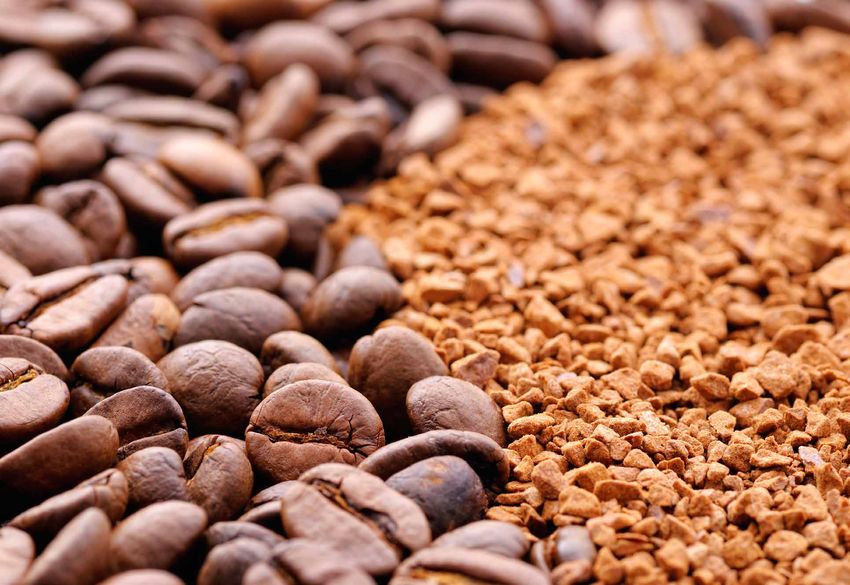
To produce wide range of grinds "Turkish, Espresso, Capsule, Pod, Moka and Percolator" - Newscai
Traguardi storici
                                         per l’Italia del caffè                                                  Historical milestones
                                                                                                               for italian green coffee
                                                                                                                                imports

                                                                                             Nel 2018, le importazioni di caffè verde             In 2018 requests for Italian
                                                                                             del nostro paese hanno superato                      green coffee exceeded
                                                                                             i 10 milioni di sacchi.                              10 million bags.
Analisi di Mercato I Market Analysis

                                                                                             Il 2018 segna un traguardo storico per               2018 marks a historic milestone for gre-
                                                                                             l’Italia del caffè. L’import ha superato in-         en coffee imports to Italy. In fact, the im-
                                                                                             fatti il traguardo dei 10 milioni di sacchi          port has surpassed the goal of 10 million
                                                                                             consolidando il ruolo del nostro paese               bags, consolidating the role of our count-
                                                                                             quale secondo importatore europeo di                 ry as the second European importer of
                                                                                             questa commodity alle spalle dell’inar-              this commodity behind the unattainable
                                                                                             rivabile Germania. Questo uno dei dati               Germany.
                                                                                             salienti, che emergono dal rapporto eu-              This is one of the salient data, which
                                                                                             ropeo del caffè 2018/19, recentemente                emerges from the new European Coffee
                                                                                             pubblicato dalla Federazione Europea del             Report 2018/19, recently published by
                                                                                             Caffè (Ecf). Nonostante varie lacune do-             the European Coffee Federation - ECF.
                                                                                             vute a difficoltà oggettive nella raccolta,          Despite various shortcomings due to
                                                                                             nell’imputazione e nell’elaborazione dei             objective difficulties in the collection,
                                                                                             dati statistici, il report, giunto quest’anno        imputation and processing of statistical
                                                                                             alla sua quarantesima edizione, rimane               data, the Report, now in its fourth edition,
                                                                                             un utile strumento di lavoro, capace di              remains a useful working tool, effective in
                                                                                             compendiare in modo organico le cifre                summarizing the fundamental figures of
                                                                                             fondamentali dell’Europa del caffè.                  the Europe of the coffee.

                                                                                             Europa al primo posto                                The maximum
                                                                                             in termini di volumi                                 world market
                                                                                             Un’Europa che si conferma il massimo                 Europe is confirmed as the maximum
                                                                                             mercato mondiale. Le importazioni di ver-            world market. Imports of green of the Eu-
                                                                                             de dell’Unione Europea (tab.1) sono risa-            ropean Union (Table 1) rose to the end

                                       8 9   CoffeeTrend magazine Dicembre I December 2019                                                   CoffeeTrend magazine Dicembre I December 2019
To produce wide range of grinds "Turkish, Espresso, Capsule, Pod, Moka and Percolator" - Newscai
lite, a fine 2018, a 57.025.783 sacchi: un                         of 2018, to 57,025,783 bags: an incre-       nione Europea, con volumi in lieve cresci-                                                  slightly up (+1.9%) over the previous year,
incremento di 3 milioni di sacchi (+5,6%)                          ase of 3 million bags (+5.6%) compared       ta (+1,9%) sull’anno precedente, a quasi                                                    to almost 4.7 million. Next comes Spain,
rispetto al 2017, anche se il dato rimane                          to 2017, even if the figure remains below    4,7 milioni.                                                                                with over 4.3 million (+4.6%).
al di sotto dei quasi 57,2 milioni di sacchi                       below the almost 57.2 million bags im-       Segue la Spagna, con oltre 4,3 milioni                                                      More spaced, but all in strong growth,
importati nel 2016.                                                ported in 2016.                              (+4,6%). Più distanziate, ma tutte in forte                                                 France (+11.1%), United Kingdom
I volumi sono in crescita in quasi tutti i                         Volumes are growing in almost all the        crescita, Francia (+11,1%), Regno Unito                                                     (+20.3%) and Holland (+7.4%).
principali mercati del vecchio continente.                         main markets of the old continent.           (+20,3%) e Olanda (+7,4%).                                                                  Poland is once again the highest market
A cominciare dalla Germania, il cui import                         Starting with Germany, whose import in-      La Polonia si rivela, ancora una volta,                                                     for Eastern European countries, with over
aumenta del 2,3% e si attesta a 18,7 mi-                           creases by 2.3% and stands at 18.7 mil-      il massimo mercato dei paesi dell’est                                                       2 million imported bags (+5.1%).
lioni di sacchi. Tale dato fa della Germania                       lion bags. This data makes Germany the       dell’UE, con oltre 2 milioni di sacchi im-                                                  Paradoxically, imports are down in the
il secondo importatore mondiale di caffè                           second largest coffee importer behind
alle spalle dei soli Stati Uniti.                                  the United States alone.
Alle spalle dei tedeschi l’Italia, il cui im-                      Behind the Germans, Italy, whose import        Tab. 1 - Imports of green coffee into Europe by country 2016 - 2018 - in tonnes and in 60 kg bags -

port, come già detto, ha superato, nel                             - as already mentioned - exceeded 10
                                                                                                                                                      Market share as percentage of total coffee volume in the EU28 markets 2015-2017
2018, i 10 milioni di sacchi: quasi 700                            million bags in 2018: almost 700 thou-
                                                                                                                   COUNTRY                                              2016                                        2017                             2018
mila sacchi in più (+7,4%) rispetto al                             sand more bags (+7.4%) compared to
2017. Il tutto mentre il nostro paese con-                         2017. All this while our country continues                                               in tonnes           in bags                in tonnes           in bags      in tonnes           in bags

tinua a registrare risultati record anche sul                      to record record results even on the ex-        AUSTRIA                                    15,834           263,900                   16,620            277,000         16.521         275,350
                                                                                                                   BELGIUM                                   305,197         5,086,617                  275,524          4,592,067        280.745       4,679,083
fronte dell’export.                                                port front. Belgium, thanks to the impor-       BULGARIA                                   32,344           539,067                   29,008            483,467         29.888         498,133
                                                                                                                   CROATIA                                    17,920           298,667                   15,778            262,967         15.564         259,400
Il Belgio, complice l’importante ruolo ri-                         tant role played by the port of Antwerp,        CYPRUS                                      1,590            26,500                    1,520             25,333          3.036          50,600
vestito dal porto di Anversa, si conferma                          confirms the third importer country of the      CZECH REPUBLIC                             17,763           296,050                   12,100            201,667         17.675         294,583
                                                                                                                   DENMARK                                    19,214           320,233                   15,054            250,900         17.029         283,817
invece il terzo paese importatore dell’U-                          European Union instead, with volumes            ESTONIA                                        69             1,150                      116              1,933             86           1,433
                                                                                                                   FINLAND                                    71,324         1,188,733                   67,391          1,123,183         61.229       1,020,483
                                                                                                                   FRANCE                                    208,027         3,467,117                  201,837          3,363,950        224.273       3,737,883
                                                                                                                   GERMANY                                 1,140,617        19,010,283                1,097,807         18,296,783      1.122.860      18,714,333
                                                                                                                   GREECE                                     49,207           820,117                   17,939            298,983         32.186         536,433
                                                                                                                   HUNGARY                                     2,084            34,733                    2,698             44,967          2.919          48,650
                                                                                                                   IRELAND                                    10,352           172,533                   12,338            205,633         11.817         196,950
                                                                                                                   ITALY                                     571,824         9,530,400                  563,185          9,386,417        604.836      10,080,600
                                                                                                                   LATVIA                                      3,360            56,000                    3,828             63,800          3.068          51,133
                                                                                                                   LITHUANIA                                   1,228            20,467                    1,444             24,067          1.643          27,383
                                                                                                                   LUXEMBOURG                                    689            11,483                      892             14,867            814          13,567
                                                                                                                   MALTA                                           1                17                        2                 33             34             567
                                                                                                                   NETHERLANDS                               174,129         2,902,150                  177,130          2,952,167        190.174       3,169,567
                                                                                                                   POLAND                                    103,408         1,723,467                  116,644          1,944,067        122.605       2,043,417
                                                                                                                   PORTUGAL                                   51,539           858,983                   49,922            832,033         53.089         884,817
                                                                                                                   ROMANIA                                    20,292           338,200                   19,229            320,483         16.983         283,050
                                                                                                                   SLOVAKIA                                    3,270            54,500                    4,571             76,183          5.342          89,033
                                                                                                                   SLOVENIA                                   13,310           221,833                   17,616            293,600         24.368         406,133
                                                                                                                   SPAIN                                     262,817         4,380,283                  250,061          4,167,683        261.500       4,358,333
                                                                                                                   SWEDEN                                    110,650         1,844,167                  108,350          1,805,833        106.588       1,776,467
                                                                                                                   UNITED KINGDOM                            176,672         2,944,533                  160,175          2,669,583        192.657       3,210,950

                                                                                                                   EU28TOTAL                               3,430,345        57,172,425                3,240,796         54,013,267      3,421,547      57,025,783

                                                                                                                   SWITZERLAND                               139,250         2,320,833                  146,480          2,441,333       158,587        2,643,117
                                                                                                                   NORWAY                                     34,938           582,300                   34,916            581,933        31,246          520,767
                                                                                                                   ICELAND                                     1,148            19,133                    1,073             17,881           931           15,517

                                                                                                                   WESTERN EUROPE TOTAL                    3,605,681        60,094,691                3,387,240         57,054,414      3,612,311      60,205,184

                                                                                                                   Albania                                    9,240            154,000                     9,300           155,000            N.A.             N.A.
                                                                                                                   Belarus                                   16,500            275,000                    17,400           290,000            N.A.             N.A.
                                                                                                                   Bosnia                                       and
                                                                                                                   Herzegovina                               24,300            405,000                   23,460            391,000           N.A.              N.A.
                                                                                                                   Georgia                                   11,220            187,000                   11,400            190,000           N.A.              N.A.
                                                                                                                   North                                   Macedonia             9,180                  153,000              9,060       151,000               N.A.
                                                                                                                   N.A.
                                                                                                                   Moldova                                     3,060            51,000                    3,120             52,000            N.A.             N.A.
                                                                                                                   Montenegro                                  3,540            59,000                    3,540             59,000            N.A.             N.A.
                                                                                                                   Russian                                 Federation          313,980                5,233,000            328,080      5,468,000              N.A.
                                                                                 N.A.
                                                                                            Serbia                                     32,820           547,000                    34,560           576,000            N.A.             N.A.
                                                                                                                   Ukraine                                    71,040         1,184,000                    68,820         1,147,000            N.A.             N.A.

                                                                                                                   CENTRAL AND EASTERN EUROPE                494,880         8,248,000                  508,740          8,479,000           N.A.              N.A.

                                                                             EUROPE TOTAL                            4,100,561        68,342,691                3,895,980         65,533,414           N.A.              N.A.


                                                                                                                                                                                                 CoffeeTrend magazine Dicembre I December 2019
To produce wide range of grinds "Turkish, Espresso, Capsule, Pod, Moka and Percolator" - Newscai
portati (+5,1%). Paradossalmente, l’im-            two largest consumer countries in per                                 Tab. 2 - Exports of green coffee to Europe by country 2016 - 2018 - in tonnes and % -

     port è in calo nei due massimi paesi con-          capita terms: Sweden (-1.7%) and Fin-                                 COUNTRY                                                  2016                                           2017                            2018
     sumatori in termini pro capite: la Svezia          land (-9.1%).                                                                                                   IN TONNES        % OF TOTAL                    IN TONNES       % OF TOTAL         IN TONNES     % OF TOTAL
     (-1,7%) e la Finlandia (-9,1%).                    The data of extra-EU Europe are mo-
                                                                                                                              BRAZIL                                       922,069              31.0%                    840,649              29.5%         900,193             30.1%
     I dati dell’Europa extra-UE sono in mas-           stly a copy of 2017. Only the figures for                             VIETNAM                                      729,069              24.5%                    660,922              23.2%         758,618             25.4%
                                                                                                                              HONDURAS                                     192,546               6.5%                    211,048               7.4%         228,112              7.6%
     sima parte una fotografia del 2017. Di-            Switzerland are available, where imports                              COLOMBIA                                     193,665               6.5%                    186,975               6.6%         172,380              5.8%
                                                                                                                              UGANDA                                       123,466               4.1%                    149,337               5.3%         161,520              5.4%
     sponibili, infatti, le sole cifre relative alla    are up 8.3% to 2,643,117 bags, Finland                                INDIA                                        140,737               4.7%                    148,093               5.2%         157,119              5.3%
     Svizzera, dove le importazioni sono in             (-10.5%) and Iceland (-13.2%).                                        PERU
                                                                                                                              ETHIOPIA
                                                                                                                                                                           122,989
                                                                                                                                                                            80,288
                                                                                                                                                                                                 4.2%
                                                                                                                                                                                                 2.7%
                                                                                                                                                                                                                         118,780
                                                                                                                                                                                                                          77,256
                                                                                                                                                                                                                                               4.2%
                                                                                                                                                                                                                                               2.7%
                                                                                                                                                                                                                                                            127,361
                                                                                                                                                                                                                                                             87,266
                                                                                                                                                                                                                                                                                 4.2%
                                                                                                                                                                                                                                                                                 2.9%
     crescita dell’8,3% a 2.643.117 sacchi,             This brings the total of Western Europe                               INDONESIA
                                                                                                                              GUATEMALA
                                                                                                                                                                           122,951
                                                                                                                                                                            32,155
                                                                                                                                                                                                 4.1%
                                                                                                                                                                                                 1.1%
                                                                                                                                                                                                                         140,784
                                                                                                                                                                                                                          35,217
                                                                                                                                                                                                                                               4.9%
                                                                                                                                                                                                                                               1.2%
                                                                                                                                                                                                                                                             64,512
                                                                                                                                                                                                                                                             43,803
                                                                                                                                                                                                                                                                                 2.2%
                                                                                                                                                                                                                                                                                 1.5%
     della Finlandia (-10,5%) e dell’Islanda            (an expression which actually includes                                NICARAGUA                                     23,394               0.8%                     31,127               1.1%          43,023              1.4%
                                                                                                                              CHINA                                         42,937               1.4%                     39,046               1.4%          42,349              1.4%
     (-13,2%).                                          the Eastern European countries) for 2018                              MEXICO                                        23,824               0.8%                     22,314               0.8%          27,381              0.9%
                                                                                                                              KENYA                                         25,331               0.9%                     23,139               0.8%          21,856              0.7%
     Ciò porta il totale dell’Europa occidenta-         at 60,205,184 bags, up 6.5% compared                                  PAPUA NEW GUINEA                              23,023               0.8%                     25,580               0.9%          20,899              0.7%
                                                                                                                              TANZANIA                                      31,731               1.1%                     22,165               0.8%          20,020              0.7%
     le (espressione in cui rientrano, in realtà,       to 2017.                                                              COTE D’IVOIRE                                 35,692               1.2%                     17,176               0.6%          19,024              0.6%
     anche i paesi dell’est appartenenti all’U-                                                                               COSTA RICA
                                                                                                                              CAMEROON
                                                                                                                                                                            15,085
                                                                                                                                                                            23,261
                                                                                                                                                                                                 0.5%
                                                                                                                                                                                                 0.8%
                                                                                                                                                                                                                          16,023
                                                                                                                                                                                                                          17,166
                                                                                                                                                                                                                                               0.6%
                                                                                                                                                                                                                                               0.6%
                                                                                                                                                                                                                                                             15,974
                                                                                                                                                                                                                                                             14,704
                                                                                                                                                                                                                                                                                 0.5%
                                                                                                                                                                                                                                                                                 0.5%
     nione Europea) per il 2018 a 60.205.184            In Italy the maximum increases                                        EL SALVADOR
                                                                                                                              BURUNDI
                                                                                                                                                                             7,737
                                                                                                                                                                             9,136
                                                                                                                                                                                                 0.3%
                                                                                                                                                                                                 0.3%
                                                                                                                                                                                                                           7,859
                                                                                                                                                                                                                           7,666
                                                                                                                                                                                                                                               0.3%
                                                                                                                                                                                                                                               0.3%
                                                                                                                                                                                                                                                             11,430
                                                                                                                                                                                                                                                              9,162
                                                                                                                                                                                                                                                                                 0.4%
                                                                                                                                                                                                                                                                                 0.3%
     sacchi, in crescita del 6,5% rispetto al           In absolute terms, Italy is the European                              OTHERS                                        51,151               1.7%                     45,868               1.6%          44,436              1.5%

     2017.                                              Union country that recorded the most                                  EU28 (excl. Intra-EU)                      2,972,973            100.0%                   2,844,190             100.0%       2,991,099             100%

                                                        significant increases in volume in the
     In Italia i massimi incrementi                     2016-2018 period, with higher imports                                   Tabella 7 – Unione Europea: esportazioni di caffè in tutte le forme (in tonnellate)
                                                                                                                              Tab. 3 - EU28 Imports per Type of Coffee - % of total green coffee imports
                                                                                                                                Table 7 – European Union 28 Countries: coffee exports in all forms (in tonnes)
     In termini assoluti, l’Italia è il paese dell’U-   for 33,012 tons or 550,200 bags (+5.8%)
                                                                                                                                                                                                                                                  2017                  2018
     nione Europea che ha registrato i più              over this period biennium. Followed
                                                                                                                               Arabicas                                                                                                          62.9%                 60.5%
     significativi incrementi a volume nel pe-          by Poland (19.197 tons; +18.6%) and                                    Brazilian Naturals                                                                                                32.3%                 33.2%
                                                                                                                               Colombian Milds                                                                                                    8.2%                  7.2%
                                                                                                                               Other Milds                                                                                                       20.5%                 20.1%
                                                                                                                               Robustas                                                                                                          34.8%                 35.4%
                                                                                                                               Others                                                                                                             2.3%                  4.1%

                                                                                                                               TOTAL                                                                                                            100.0%                100.0%

„ŒˆŠ                                                                     ‘ ˆ                       Tab. 4 - EU28 imports of roasted coffee (incl. decaf) from non-EU destinations 2016-2018, in tonnes

‰                                                           ˆ
                                                                                           Ž
                                                                                                                               COUNTRY                                                                                2016                        2017                  2018

                                                                            “
                                                                                                                               SWITZERLAND                                                                       49,590                          52,423                61,319
                                                                                                                               UNITED STATES                                                                      3,418                           2,586                 1,082
                                                                                                                               BRAZIL                                                                               562                           1,105                   698
                                                                                                                               BOSNIA AND HERZEGOVINA                                                               523                             617                   675
  †‡  ˆ  ˆ‰Š                                                                          SYRIA
                                                                                                                               SERBIA
                                                                                                                                                                                                                    416
                                                                                                                                                                                                                    445
                                                                                                                                                                                                                                                    574
                                                                                                                                                                                                                                                    486
                                                                                                                                                                                                                                                                          637
                                                                                                                                                                                                                                                                          565
‡‹‹ˆ‹‡ˆ  ˆ 
 ‡ŒŽ ‡
ˆ ‘ ’‰ˆ’                                                                              Tab. 5 - EU28 imports of soluble coffee from non-eu origins - 2015-2017, in tonnes and % of total imports
ŠŒˆ‡ 
ŠŠ ‡ ‰Š                                                                                                COUNTRY                                                  2016                                           2017                            2018
 ‘  ˆ‡                                                                         ‚‚ƒ„ 
                                                                                                                                                                            Tonnes                   %                       Tonnes              %           Tonnes                %
‡ŒˆŠ                                                           ƒ
‡                                                                                    
                                                                                                                              BRAZIL                                        12,615              23.5%                         9,900           20.1%          10,020             21.1%
 ˆ                                                                                                         INDIA
                                                                                                                              ECUADOR
                                                                                                                                                                             5,568
                                                                                                                                                                             9,967
                                                                                                                                                                                                10.4%
                                                                                                                                                                                                18.6%
                                                                                                                                                                                                                              6,425
                                                                                                                                                                                                                              8,850
                                                                                                                                                                                                                                              13.1%
                                                                                                                                                                                                                                              18.0%
                                                                                                                                                                                                                                                              8,010
                                                                                                                                                                                                                                                              6,396
                                                                                                                                                                                                                                                                                16.8%
                                                                                                                                                                                                                                                                                13.4%
                                                                                     
ˆŠ                                                                                                             VIETNAM                                        4,034               7.5%                         5,478           11.1%           6,168             13.0%
                                                                                            ­­­€­
                                                                                                               SWITZERLAND
                                                                                                                              COLOMBIA
                                                                                                                                                                             5,409
                                                                                                                                                                             4,528
                                                                                                                                                                                                10.1%
                                                                                                                                                                                                 8.4%
                                                                                                                                                                                                                              4,851
                                                                                                                                                                                                                              4,390
                                                                                                                                                                                                                                               9.9%
                                                                                                                                                                                                                                               8.9%
                                                                                                                                                                                                                                                              5,168
                                                                                                                                                                                                                                                              4,487
                                                                                                                                                                                                                                                                                10.9%
                                                                                                                                                                                                                                                                                 9.4%
 
                                                                                              
                                                                                                                              OTHERS                                        11,496              21.5%                         9,241           18.8%           7,335             15.4%
ˆŽ
‡                                                                                                   TOTAL                                         53,617            100.0%                         49,135          100.0%          47,584          100.0%

ˆ‰
‰                                                                                                               Tab. 6 - EU28 Exports of green coffee and (semi)finished coffee products to non-EU destinations in tonnes, 2016-2018
 †‡
                                                                                                                                                                                                           2016                        2017                  2018
 ‡Š                                                                                                             Green coffee (09011100)                                                           42,386                          38,506                44,820
 Šˆ                                                                                                             Green coffee, decaffeinated (09011200)                                            99,278                          97,609                92,406
Š                                                                                                               Roasted coffee (09012100)                                                        118,903                         132,351               140,729
 ˆŒŠˆ                                                                                                              Roasted coffee, decaffeinated (09012200)
                                                                                                                               Coffee extracts (21011100)
                                                                                                                                                                                                                  2,701
                                                                                                                                                                                                                 46,257
                                                                                                                                                                                                                                                  2,914
                                                                                                                                                                                                                                                 46,350
                                                                                                                                                                                                                                                                        2,829
                                                                                                                                                                                                                                                                       48,447
 
 ‹Š
 ‡
‡                                                                                

                                                                                                                                                                                                                CoffeeTrend magazine Dicembre I December 2019
To produce wide range of grinds "Turkish, Espresso, Capsule, Pod, Moka and Percolator" - Newscai
Tab. 7 - EU28 exports of roasted coffee (incl. Decaf) to non-EU destinations - 2016-2018, in tonnes and % of total exports

                     COUNTRY                                                2016                                        2017                                2018

                     Russian Federation                           17,875             15.1%                   20,683             15.6%              23,115           16.4%
                     Ukraine                                      13,399             11.3%                   15,198             11.5%              16,945           12.0%
                     United States                                13,402             11.3%                   15,968             12.1%              16,187           11.5%
                     Switzerland                                  11,309              9.5%                   10,632              8.0%              11,340            8.1%
                     Norway                                        5,893              5.0%                    6,359              4.8%               6,435            4.6%
                     Canada                                        4,233              3.6%                    5,720              4.3%               6,291            4.5%
                     Australia                                     6,744              5.7%                    7,183              5.4%               6,169            4.4%
                     Turkey                                        3,268              2.8%                    3,604              2.7%               4,462            3.2%
                     Israel                                        2,710              2.3%                    2,634              2.0%               3,135            2.2%
                     China                                         2,527              2.1%                    3,093              2.3%               2,878            2.0%
                     United Arab Emirates                          3,362              2.8%                    2,830              2.2%               2,645            1.9%
                     South Korea                                   2,147              1.8%                    2,529              1.9%               2,621            1.9%
                     Albania                                       2,305              1.9%                    2,305              1.7%               2,583            1.8%
                     Japan                                         2,179              1.8%                    2,305              1.7%               2,528            1.8%
                     Saudi Arabia                                  1,411              1.2%                    1,757              1.3%               2,525            1.8%
                     Belarus                                       2,393              2.0%                    2,051              1.6%               2,228            1.6%
                     Lybia                                           653              0.5%                      943              0.7%               1,903            1.3%
                     Serbia                                        1,412              1.2%                    1,623              1.2%               1,808            1.3%
                     Bosnia and Herzegovina                        1,613              1.4%                    1,600              1.2%               1,719            1.2%
                     Brazil                                        1,495              1.3%                    1,573              1.2%               1,226            0.9%
                     Others                                       18,515             15.5%                   21,757             16.5%              21,986           15.6%

                     TOTAL                                      118,745            100.0%                   132,347            100.0%             140,729          100.0%

                  riodo 2016-2018, con maggiori impor-                                                         France (16.246 tons; +7.8%). The most
                  tazioni per 33.012 tonnellate o 550.200                                                      marked drops, in the same time period,
                  sacchi (+5,8%) nell’arco di questo bien-                                                     are observed in Belgium, with 24,452
                  nio. Seguono Polonia (19,197 tonnellate;                                                     fewer tons (-8%), Germany (-17,757
                  +18,6%) e Francia (16,246 tonnellate;                                                        tons; -1.6%) and Greece (-17,021 tons;
                  +7,8%).                                                                                      -34.6% ).
                  I cali più marcati, nella stesso arco                                                        In percentage terms, the +3.3% recor-
                  temporale, si osservano in Belgio, con                                                       ded, in the same period, from Malta, as
                  24.452 tonnellate in meno (-8%), Germa-                                                      well as +90.9% and +83.1% related to
                  nia (-17,757 tonnellate; -1,6%) e Grecia                                                     Cyprus and Slovenia. It should be em-
                  (-17.021 tonnellate; -34,6%).                                                                phasized that the smallest countries are
                  In termini percentuali spicca il +3.300%                                                     those that normally show the most mar-
                  registrato, nello stesso periodo, da Malta,                                                  ked fluctuations from one year to another.
                  nonché il +90,9% e il +83,1% relativi a                                                      The largest negative changes are found
                  Cipro e Slovenia. È bene sottolineare che                                                    in Greece (-34.6%), Romania (-16.3%),
                  i paesi più piccoli sono quelli che eviden-                                                  Finland (-14.2%), Croatia (-13.1%) and
                  ziano di norma le oscillazioni più marcate                                                   Denmark (-11.4 %).
                  da un anno all’altro.
                  Le variazioni negative maggiori si riscon-                                                   Main origins
                  trano invece in Grecia (-34,6%), Roma-                                                       Brazil, Vietnam, Honduras, Colombia and
                  nia (-16,3%), Finlandia (-14,2%), Croazia                                                    Uganda are confirmed as the highest
                  (-13,1%) e Danimarca (-11,4%).                                                               suppliers of the European Union (Table 2).
                                                                                                               Brazil recovers volumes (+7.1%) and
                  Le principali origini                                                                        market shares (30.1%), going back to
                  Brasile, Vietnam, Honduras, Colombia e                                                       900,193 tons or 15,003,217 bags, but
                  Uganda si confermano i massimi fornitori                                                     remains below the historical highs of
                  dell’Unione Europea (tab. 2). Il Brasile re-                                                 2016. The rise of Vietnam instead resu-
                  cupera volumi (+7,1%) e quote di merca-                                                      mes, from which the European Union
                  to (30,1%), risalendo a 900.193 tonnella-                                                    has imported 758,618 tons (12,643,633
                  te o 15.003.217 sacchi, ma rimane al di                                                      bags), with an increase of 14.8% compa-
                  sotto dei massimi storici del 2016.                                                          red to 2017 and a market share that rises
                  Riprende invece l’ascesa del Vietnam,                                                        to 25.4%.

14 15   CoffeeTrend magazine Dicembre I December 2019
To produce wide range of grinds "Turkish, Espresso, Capsule, Pod, Moka and Percolator" - Newscai
Then the rise of Honduras (+8.1%) con-           Tab. 8 - EU28 exports of soluble coffee to non-EU destinations 2015-2017, in tonnes and % of total exports

                                                  tinues: 228,112 tons or 3,801,867 gre-
                                                                                                                                                         2016                                       2017                         2018
                                                  en coffee bags arrived from the Central
                                                  American country, for a share that now                                                       Tonnes                 %                   Tonnes                   %    Tonnes              %

                                                  reaches 7.6%.                                    RUSSIAN FEDERATION                          12,075             26.1%                   10,568                22.8%    9,931           20.5%
                                                                                                   UKRAINE                                      6,446             13.9%                    5,610                12.1%    7,124           14.7%
                                                  The role of Colombia is still being redu-        AUSTRALIA                                    5,267             11.4%                    5,576                12.0%    6,077           12.5%
                                                  ced, from which 172.380 tons (2.873.000          SOUTH AFRICA
                                                                                                   UNITED STATES
                                                                                                                                                3,512
                                                                                                                                                1,933
                                                                                                                                                                   7.6%
                                                                                                                                                                   4.2%
                                                                                                                                                                                           4,347
                                                                                                                                                                                           2,355
                                                                                                                                                                                                                 9.4%
                                                                                                                                                                                                                 5.1%
                                                                                                                                                                                                                         4,485
                                                                                                                                                                                                                         2,867
                                                                                                                                                                                                                                          9.3%
                                                                                                                                                                                                                                          5.9%
                                                  bags) were imported, with a decline on           NORWAY                                       1,766              3.8%                    1,714                 3.7%    1,843            3.8%
                                                                                                   TURKEY                                       1,630              3.5%                    1,761                 3.9%    1,507            3.1%
                                                  the previous year of 7.8% and a market           EGYPT                                        1,610              3.5%                    1,218                 2.6%    1,400            2.9%
                                                                                                   CANADA                                       1,228              2.7%                    1,434                 3.1%    1,199            2.5%
                                                  share that drops to 5.8%.                        SWITZERLAND                                  1,158              2.5%                    1,787                 3.9%    1,181            2.4%
                                                  Finally, fifth place in Uganda is consolida-     OTHERS                                       9,632             20.8%                    9,980                21.4%   10,833           22.4%

                                                  ted, from which the European Union im-           TOTAL                                       46,257           100.0%                    46,350           100.0%       48,447          100.0%
                                                  ported 161,520 tons or 2,692,000 bags
                                                  of coffee, a further increase of 8.2%.
  dal quale l’Ue ha importato 758.618 ton-        Behind the top five suppliers we see           Così cambia                                                                                 of Arabica, which has fallen from 62.9%
  nellate (12.643.633 sacchi), con un incre-      growth volumes for India (+6.1%), Peru         la geografia delle origini                                                                  to 60.5%.
  mento del 14,8% rispetto al 2017 e una          (+7.2%) and Ethiopia (+13%), which is          Il grafico 2 riporta i paesi i paesi che han-                                               Among the latter, the share of Natu-
  quota di mercato che sale al 25,4%.             matched by the collapse of exports from        no registrato le variazioni più significative,                                              ral Brazilians improves, from 32.3% to
  Prosegue poi l’ascesa dell’Honduras             Indonesia, more than halved (-54.2%)           a livello di volumi esportati, tra il 2016 e il                                             33.2%, while those of the Other Sweets
  (+8,1%): dal paese centroamerica-               compared to the previous year.                 2018. Al di là del già citato caso dell’In-                                                 and, above all, of the Sweet Colombians
  no sono arrivate 228.112 tonnellate o           To motivate this drastic downturn, the lo-     donesia si osserva un andamento negati-                                                     fall.
  3.801.867 sacchi di caffè verde, per una        wer harvest of the island of Sumatra, the      vo sui due anni anche per la Colombia e                                                     In any case, the report calls for these
  share che raggiunge ormai il 7,6%.              country’s maximum production area. But         per lo stesso Brasile, che - pur in ripresa                                                 statistics to be taken with discernment,
  Si ridimensiona ancora il ruolo della Co-       the liveliness of domestic demand (com-        - non è riuscito a risalire ai livelli del 2016.                                            given the difficulties encountered in cal-
  lombia, dalla quale sono state importate        pared to a population that now exceeds         Trend positivi si osservano invece per                                                      culating data broken down by origin and
  172.380 tonnellate (2.873.000 sacchi),          270 million inhabitants), which makes In-      Uganda, Honduras, Vietnam, Nicaragua                                                        type.
  con una flessione sull’anno preceden-           donesia one of the fastest-growing glo-        e India.
  te del 7,8% e una quota di mercato che          bal coffee markets, also had an impact.        Nella tabella 3, la ripartizione per tipolo-                                                European imports:
  scende al 5,8%.                                 As you can see in chart 1, the top five        gie evidenzia invece, tra il 2017 e il 2018,                                                more roasted and less
  Si consolida infine il quinto posto dell’U-     supplier countries cover almost three          una crescita della quota dei Robusta, che                                                   instant coffee
  ganda, da cui l’Unione Europea ha im-           quarters (74.3%) of European imports.          passa dal 34,8% al 35,4%, cui fa riscon-                                                    In 2018, the imported volumes of roasted
  portato 161.520 tonnellate o 2.692.000                                                         tro una flessione della quota degli Arabi-                                                  coffee (table 4) grew by 11.4% reaching
  sacchi di caffè, in ulteriore incremento        Changing the geography                         ca, che scende dal 62,9% al 60,5%. Tra                                                      62,674 tons or just over a million bags.
  dell’8,2%.                                      of the origins                                 questi ultimi migliora la share dei Brasilia-                                               Added to this is an increase in decaffei-
  Dietro ai primi cinque fornitori si osserva-    Graph 2 shows the countries the countri-       ni Naturali, dal 32,3% al 33,2%, mentre                                                     nated coffee imports (+14.7%), which ri-
  no volumi in crescita per India (+6,1%),        es that recorded the most significant          arretrano quelle degli Altri Dolci e, soprat-                                               ses to 5,478 tons.
  Perù (+7,2%) ed Etiopia (+13%), cui fa          changes, at the level of exported volu-        tutto, dei Colombiani Dolci.                                                                As many as 61,319 tons (+17%) of roa-
  riscontro il crollo dell’export dall’Indone-    mes, between 2016 and 2018.                    Il rapporto invita comunque a prendere                                                      sted coffee arrived from Switzerland and
  sia, più che dimezzato (-54,2%) rispetto        Beyond the aforementioned case of In-          queste statistiche cum grano salis, viste                                                   it is very probable – we add - that this
  all’anno precedente.                            donesia, there is a negative trend over        le difficoltà che si incontrano nel calcolo                                                 volume consists mainly of capsules with
  A motivare questa drastica flessione, il        the two years also for Colombia and for        dei dati disaggregati per origine e per ti-                                                 Nespresso brand.
  minor raccolto dell’isola di Sumatra, mas-      Brazil itself which, although recovering,      pologia.                                                                                    On the other hand, there was a negative
  sima area di produzione del paese. Ma           failed to reach the 2016 levels.                                                                                                           trend for soluble imports (table 5), which
  ha inciso anche la vivacità della domanda       Positive trends are observed for Ugan-         L’Europa importa più caffè                                                                  fell by a further 3.2% to 47,584 tonnes
  interna (a fronte di una popolazione che        da, Honduras, Vietnam, Nicaragua and           torrefatto e meno caffè solubile                                                            by the end of 2018: approximately 793
  supera ormai i 270 milioni di abitanti), che    India.                                         Nel 2018, i volumi importati di caffè tor-                                                  thousand bags.
  fa dell’Indonesia uno dei mercati del caffè     In the table 3, the breakdown by type          refatto (tab. 4) sono cresciuti dell’11,4%                                                  Note the pre-eminence of the producing
  in maggiore crescita su scala globale.          shows, instead, between 2017 and               raggiungendo le 62.674 tonnellate o                                                         countries, in particular Brazil and India,
  Come è possibile vedere nel grafico 1, i        2018, an increase in the share of Robu-        poco più di un milione di sacchi. A ciò                                                     which also see their volumes grow, in
  primi cinque paesi fornitori coprono quasi      sta, which goes from 34.8% to 35.4%,           va aggiunto un incremento dell’import di                                                    contrast with the general trend noted
  i tre quarti (74,3%) dell’import dell’UE.       which is matched by a drop in the share        caffè decaffeinizzato (+14,7%), che sale                                                    above.

16 17    CoffeeTrend magazine Dicembre I December 2019                                                                                                                             CoffeeTrend magazine Dicembre I December 2019
To produce wide range of grinds "Turkish, Espresso, Capsule, Pod, Moka and Percolator" - Newscai
Top Green Coffee Suppliers to EU28 Countries 2018 (in tonnes, % of total EU28 imports)   European Exports growing
                                                                                         The re-exports of green coffee from the
                                                                                         European Union (table 6) are once again
                                                                                         growing, exceeding the record levels of
                                                                                         2016.
                                                                                         Different dynamics for the export of de-
                                                                                         caffeinated green coffee, down for the
                                                                                         third consecutive year (-5.3%) and now
                                                                                         far from the nearly 100 thousand tons of
                                                                                         2016.
                                                                                         But the most interesting developments
                                                                                         are recorded in terms of exports of pro-
                                                                                         cessed coffee.
                                                                                         In particular, the strong growth trend in
                                                                                         the export of non decaffeinated roasted
                                                                                         coffee stands out, passing from 118.903
                                       a 5.478 tonnellate. Ben 61.319 tonnellate         tons (1.981.717 bags) in 2016 to 140.729
                                       (+17%) di caffè tostato sono arrivate dalla       (2.345.483 bags) in 2018, with an incre-
                                       Svizzera ed è molto probabile – aggiun-           ase of 18.4% over the two years, as well
                                       giamo noi – che tale volume sia costituito        as 6.3% over last year.
                                       in massima parte da capsule a marchio             The trend in soluble coffee exports was
                                       Nespresso. Trend negativo invece per le           also positive, growing by 4.5% compa-
                                       importazioni di solubile (tab. 5), che arre-      red to 2017, reaching 48,447 tons.
                                       trano di un ulteriore 3,2% attestandosi, a        Exports of decaffeinated roasted meats
                                       fine 2018, a 47.584 tonnellate: circa 793         only fell (-2.9%), though with very modest
                                       mila sacchi. Da notare la preminenza dei          volumes.
                                       paesi produttori, in particolare di Brasile
                                       e India, che vedono peraltro crescere i           Russia: best European customer
                                       loro volumi, in controtendenza rispetto al        Let’s now focus on the main non-Euro-
                                       trend generale sopra rilevato.                    pean markets to which the roasted is ex-
                                                                                         ported (table 7). The Russian Federation
                                       Export in crescita                                remains the most important foreign cu-
                                       Le riesportazioni di caffè verde dell’Unio-       stomer of coffee roasters in the Europe-
                                       ne Europea (tab. 6) tornano a crescere            an Union, maintaining a ten-year growth
                                       superando i livelli record del 2016. Dina-        trend.
                                       mica diversa per l’export di caffè verde          In the 2016-2018 two-year period alone,
                                       decaffeinizzato, in flessione per il terzo        volumes increased by 29.3%, reaching a
                                       anno consecutivo (-5,3%) e lontano or-            new high of 23,115 tons (385,250 bags)
                                       mai dalle quasi 100 mila tonnellate del           last year.
                                       2016.                                             Exports to the Ukraine are also growing
                                       Ma gli sviluppi più interessanti si registra-     strongly (+26.5% between 2016 and
                                       no sul fronte delle esportazioni di caf-          2018), which becomes the second Euro-
                                       fè trasformato. Spicca, in particolare, il        pean Union market bypassing the United
                                       trend di forte crescita dell’export di caffè      States, despite a strong increase in ex-
                                       torrefatto non decaffeinizzato, che pas-          ports, even at the time of this last country
                                       sa dalle 118.903 tonnellate (1.981.717            (+20.8% in the last two years).
                                       sacchi) del 2016 alle 140.729 (2.345.483          Sales to Switzerland are recovering,
                                       sacchi) del 2018, con un incremento del           growing by 6.6% in 2018, reaching a new
                                       18,4% nell’arco dei due anni, nonché del          high of 11,340 tons. The four countries
                                       6,3% rispetto all’anno scorso.                    mentioned above absorb 48% of Euro-
                                       Positivo anche l’andamento delle espor-           pean exports alone.

18 19             CoffeeTrend magazine Dicembre I December 2019
PR
                                                                                                                                                                                                                                                                                        OU
                                                                                                                                                                                                                                                                                          DLY
                                                                                                                                                                                                                                                                                            MA
                                                                                                                                                                                                                                                                                              DE
                                                                                                                                                                                                                                                                                                 IN
                                                                                                                                                                                                                                                                                                 ITA
                                                                                                                                                                                                                                                                                                    LY
  tazioni di caffè solubile, che crescono del         Green Coffee Exporters to EU28 Countries - Largest variations in volume, exported tonnes, 2016-2018
                                                                                                                                                                                                                                                COLOMBINI GRINDERS
  4,5% rispetto al 2017 raggiungendo le                                                                                                                                                                                                         PERFECT GROUND AT YOUR SERVICE
  48.447 tonnellate.
  Risulta in flessione (-2,9%) il solo export                                                                                                                                                                                                       It can process over 1000 kgs per hour
  di torrefatto decaffeinizzato, a fronte però                                                                                                                                                                                                      Pods and capsules over 800 per minute
  di volumi molto modesti.

  La Russia il nostro migliore cliente
  Soffermiamoci ora sui principali mercati
  extra-UE verso i quali il torrefatto viene
  esportato (tab. 7). La Federazione Russa
  rimane il cliente estero più importante dei
  torrefattori dell’Unione Europea mante-

                                                                                                                                                                                     THE ART
  nendo un trend di crescita ormai decen-
  nale. Nel solo biennio 2016-2018, i volu-        In almost all markets, exports are growing.
  mi sono lievitati del 29,3% raggiungendo,        The only exceptions are the United Arab
  l’anno scorso, un nuovo massimo di               Emirates, Australia, Brazil and Belarus.

                                                                                                                                                                                OF COFFEE GRINDING
  23.115 tonnellate (385.250 sacchi).              EU exports of instant coffee (officially:
  In forte progressione anche l’export ver-        extracts, essences and coffee concen-
  so dell’Ucraina (+26,5% tra il 2016 e il         trates) recorded an increase of 4.5% in
  2018), che diventa il secondo mercato            2018 (table 8).
  dell’Unione scavalcando gli Stati Uni-           Also for this item, Russia and Ukraine re-

                                                                                                                                                              PRODUCTIVE EXCELLENCE MADE EASY
  ti, nonostante un forte incremento delle         main the two main destinations.
  esportazioni anche alla volta di quest’ulti-     But exports to the Federation continue to
  mo paese (+20,8% negli ultimi due anni).         mark time - confirming a trend that has
  In ripresa le vendite verso la Svizzera, che     been underway since the beginning of                                                                                                    Colombini industrial grinders and degassing system
  crescono del 6,6% nel 2018 raggiungen-           the decade - and fell to 9,931 tons (-6%)
  do un nuovo massimo di 11.340 tonnel-            last year.                                                                                                                                        are designed to fit in any plant
  late. I quattro paesi sopra citati assorbo-      On the other hand, export volumes are
  no da soli il 48% dell’export dell’UE.           growing as regards the other main mar-                                                                   DEGASSING SYSTEM
  In quasi tutti i mercati, le esportazioni        kets, starting with Ukraine, which recor-                                                                DEFINITELY LOW DEGASSING TIMES
  sono in crescita. Fanno eccezione sol-           ded +27% compared to 2017, Australia                                                                     (EVEN MORE THAN 30% LESS THAN OTHER SYSTEMS
  tanto Emirati Arabi, Australia, Brasile e        (+9%), South Africa (+3.2%) and the Uni-                                                                 ON THE MARKET) WITH CAPSULES 8 HOURS
  Bielorussia.                                     ted States (+21.7%).
  L’export dell’UE di caffè solubile (“ufficial-                                                                                                             Facilitated degassing through the use of high vacuum inside
  mente: estratti, essenze e concentrati di                                                                                                                  silos (up to 850 millibar depression)
  caffè”) ha registrato nel 2018, come già                                                                                                                   No coffee residues in pipes and silos
  detto, un incremento del 4,5% (tab. 8).                                                                                                                    Uniform injection of nitrogen inside the ground coffee thanks
  Anche per questa voce, Russia e Ucraina                                                                                                                    to the vacuum.
                                                                                                                                                             Integrated vacuum conveyor from the grinder to the silo and
  rimangono le due principali destinazioni.                                                                                                                  from the silo to the packaging machine
  Ma l’export verso la Federazione conti-                                                                                                                    Reduced energy and nitrogen consumption (max 5m3/hour)
  nua a segnare il passo – confermando
  una tendenza in atto da inizio decennio
  – ed è sceso, l’anno scorso, a 9.931 ton-                                                                                                                 COLOMBINI TAKES CARE OF EVERY STEP OF COFFEE PRODUCTION
  nellate (-6%).
  Volumi in crescita invece per quanto ri-
                                                                                                                                                            AND OFFERS A FULL RANGE OF MACHINERY, TO SUIT EVERY NEED.
  guarda gli altri principali mercati. A comin-
  ciare dall’Ucraina, che registra un +27%
                                                                                                                                                            Find out more on: www.colombini.srl
  rispetto al 2017, per continuare con l’Au-
  stralia (+9%), il sud Africa (+3,2%) e gli
  Stati Uniti (+21,7%).
                                                                                                                                                                                                                             COLOMBINI srl | info@colombini.srl | www.colombini.srl
                                                                                                                                                                                                                             via De Francisco, 130/16 10036 Settimo T.se (TO) Italy
20 21    CoffeeTrend magazine Dicembre I December 2019                                                                                                                                                                       tel +39 (0) 118211407 fax +39 (0) 118958221
Quattro tipologie
                                                                                                                   Four market types
                                          di mercato caratterizzano                                             shaping global coffee
                                          la domanda globale                                                                demand
                                          di caffè

                                                                                           La crescita dei consumi e della popala-               The growth of coffee is a global phenom-
                                                                                           rità della nera bevanda è un fenomeno                 enon, however there are different types of
                                                                                           globale, tuttavia esistono diversi macro-             coffee market worldwide. This is based
                                                                                           trend che caratterizzano e influenzano le             on the leading factor in their future growth
Paesi Consumatori I Consuming Countries

                                                                                           tipologie di consumo nei diversi mercati.             potential:
                                                                                           Questi trovano fondamento nell’insieme                • premiumisation,
                                                                                           di fattori principali che ne guidano il futuro        • income,
                                                                                           potenziale sviluppo e che possono esse-               • population,
                                                                                           re suddivisi in quattro distinte tipologie di         • soft drivers (generally lifestyle trends).
                                                                                           mercato:
                                                                                           • mercati guidati dalla premiumizzazione;             It is rare that a market is only shaped by
                                                                                           • mercati guidati dal reddito;                        one, but in most cases one of these is
                                                                                           • mercati guidati dalla grandezza/numero-             dominant over the others and plays a de-
                                                                                           sità della popolazione;                               cisive role in shaping the nature of future
                                                                                           • mercati guidati da mode e tendenze                  coffee demand.
                                                                                           (soft drivers).                                       Premiumisation tends to be most impor-
                                                                                                                                                 tant in the developed world and is es-
                                                                                           Seppur distinti in specifiche macrocatego-            pecially strong in East Asia and Western
                                                                                           rie è raro riscontrare che un determinato             Europe.
                                                                                           mercato possa essere modellato soltan-                Developing Asia and Eastern Europe,
                                                                                           to da un insieme di fattori ricadenti in una          meanwhile, are generally income-led,
                                                                                           specifica tipologia. Al contrario, sarebbe            while population is the most important
                                                                                           più corretto parlare di contaminazioni e di           driver in Africa and Central America. In all
                                                                                           coopresenza di due o più tipologie dove,              regions however, there are outliers that
                                                                                           nella maggior parte dei casi, una di queste           resist this neat geographical correlation.
                                                                                           è dominante sulle altre e svolge un ruolo             About half of global value growth will take
                                                                                           decisivo nel determinare la natura della fu-          place in premiumisation-led markets as
                                                                                           tura domanda di caffè.                                consumers trade up to higher-value for-
                                                                                           La premiumizzazione tende ad essere la                mats of coffee. In volume terms however,
                                                                                           più importante nei paesi sviluppati ed è              they play only a minor role since these
                                                                                           particolarmente forte in Asia orientale ed            tend to be highly mature markets with
                                                                                           Europa occidentale.                                   slow population growth.
                                                                                           Lo sviluppo dell’Asia e dell’Europa orien-            Coffee shops are growing worldwide
                                                                                           tale è invece generalmente guidato dal                but most global growth will come from

                                  22 23    CoffeeTrend magazine Dicembre I December 2019                                                    CoffeeTrend magazine Dicembre I December 2019
IMA COFFEE HUB
                                                                                                                                                          Coffee Processing & Packaging Solutions
                  reddito, mentre la popolazione è il motore        income-led markets. For these consum-
                  più importante in Africa e in America cen-        ers, the coffee shop is an important sta-
                  trale. In tutte le regioni, tuttavia, esistono    tus symbol as much as it is about coffee.
                  valori anomali che resistono a questa net-        Population-led markets are seeing pric-
                  ta correlazione geografica.                       es stay relatively stable and little format
                  Circa la metà della crescita globale del va-      switching occurring. What performs best
                  lore avverrà nei mercati guidati dalla pre-       is inexpensive products in categories al-
                  miumizzazione che orienta i consumatori           ready familiar to consumers. Nearly all
                  verso formati di caffè a più alto valore ag-      future instant growth is taking place in
                  giunto, sia in termini di qualità di prodot-      these countries as well as a significant
                  to che di praticità di consumo come ad            proportion of standard ground growth.
                  esempio le bevande porzionate.
                  In termini di volume, tuttavia, svolgono un       Global overview
                  ruolo alquanto marginale poiché tendono           The major sources of global coffee growth
                  a caratterizzare mercati altamente maturi         show a remarkable range of diversity.
                  con una crescita della popolazione lenta          There are the mature markets whose
                  se non stabile.                                   absolute size is enough to make up for
                  Altro trend in atto è lo svilluppo di caffet-     slower relative growth (Italy, the US), large
                  terie e outlets di catene a marchio, a cui si     developing markets with strong traditions
                  affiancano caffetterie e coffeeshops indi-        of coffee drinking boosted by rising in-
                  pendenti. Tale fenomeno si sta diffonden-         comes and populations (Ethiopia, Indo-
                  do un po’ in tutto il mondo, ma la mag-           nesia) and tea-drinking countries where
                  gior parte della crescita globale avverà          coffee is rapidly gaining in importance
                  nei mercati guidati dal reddito. Per questi       (Turkey, the UK).
                  consumatori, la frequentazione di caffet-         Above all there is Brazil, whose large
                  terie è un importante status symbol tanto         population, enthusiasm for coffee, and
                  quanto lo è la possibilità di un consumo          recovering economic prospects make
                  abituale di caffè.                                its absolute growth prospects over four
                  I mercati guidati dalla grandezza/nume-           times those of any other country in the
                  rosità della popolazione vedono i prezzi          world.                                                                                          AT EVERY STEP, A SPECIALIST
                  rimanere relativamente stabili e si verifi-       This range shows that global coffee
                  cano scarsi cambi di formato relativo alle        growth is coming from a diversified base
                  diverse modalità e tipologie differenti di        that will make it resilient in the coming
                  consumo. Le migliori performance di dif-          years. It also shows that one-size-fits-all
                  fusione sono infatti raggiunte da prodotti        strategies are impossible in global cof-
                  economici in categorie già familiari ai con-      fee and even within many coffee-drinking
                  sumatori. Quasi tutta la futura crescita dei
                  mercati del prodotto istantaneo è infatti                                                         Where the art of process meets
                  concentrata in questa tipologia di paesi, a
                  cui si aggiunge una percentuale significati-                                                      the technology of packaging.
                  va di crescita del prodotto caffè macinato.                                                                                                                                        1.             2.          3.            4.              5.
                                                                                                                                                                                                     GREEN COFFEE   ROASTING    GRINDING      PACKAGING       ENDOFLINE
                                                                                                                    From coffee to cup, IMA launches the broadest technical and commercial           INTAKE         PROCESS

                                                                                                                    organisation to serve the coffee processing industry. Today’s hub integrates
                  Panoramica globale                                                                                market-leading competences, in-depth industry experience and application-
                  Le principali fonti di crescita globale del                                                       specific know-how. Now reaching every corner of the coffee handling,
                  caffè mostrano una notevole varietà di                                                            processing and packaging universe, IMA, with its growing strategic
                  diversità. Ci sono mercati maturi le cui                                                          partnerships, is ready to serve it up, full flavour and in a class of its own.
                  dimensioni assolute sono sufficienti a                                                                                                                                                                                                    Visit us at:
                                                                                                                    IMA COFFEE HUB the world’s best blend of experience and expertise.
                  compensare una crescita relativa più len-                                                                                                                                                                                                        SIGEP
                  ta (Italia, Stati Uniti), grandi mercati in via                                                   www.ima.it                                                                                       Rimini, Italy • 18-22 January • Hall D1, Booth #008
                  di sviluppo con forti tradizioni di consumo
                  di caffè sostenute dall’aumento dei redditi

24 25   CoffeeTrend magazine Dicembre I December 2019
e delle popolazioni (Etiopia, Indonesia) e       regions. Much has become globalised in
  paesi che bevono tè il caffè sta guada-          coffee but local conditions continue to
  gnando rapidamente importanza (Turchia,          play a critical role in shaping demand and
  Regno Unito).                                    growth patterns will play out in very differ-
  Soprattutto c’è il Brasile, la cui grande        ent ways in the years ahead.
  popolazione, l’entusiasmo per il caffè e il
  recupero delle prospettive economiche
  rendono le sue prospettive di crescita as-
  solute oltre quattro volte quelle di qualsiasi
  altro paese al mondo.
  Questa gamma mostra che la crescita
  globale del caffè proviene da una base
  diversificata che lo renderà resistente nei
  prossimi anni. Mostra anche che le stra-
  tegie a misura unica sono impossibili nel
  caffè globale e persino in molte regioni che
  bevono caffè. Molto si è globalizzato nel
  caffè, ma le condizioni locali continuano
  a svolgere un ruolo critico nel dare forma                                                       Complete artisanal and industrial
  alla domanda e i modelli di crescita si svol-
  geranno in modi molto diversi negli anni a
                                                                                                      coffee processing plants
  venire.
  Parlando in termini generali, tre principali
  fattori di crescita determinano la domanda
  di caffè: premiumizzazione nei paesi svi-
  luppati, crescita del PIL in Europa orientale    Speaking in general terms, three major
                                                                                                            OUR INNOVATIVE
  e in Asia e popolazione in Africa, Australa-     growth drivers shape coffee demand:                      TECHNOLOGY
  sia e Medio Oriente.                             Premiumisation in developed countries,
  I paesi in cui i driver soft sono i più gran-    GDP growth in Eastern Europe and Asia,
  di sono molto più sparsi a livello globale       and population in Africa, Australasia, and
  sebbene il Medio Oriente ne abbia un gran        the Middle East.                                         The original patented Vortex system, together with heat
  numero.                                          Countries where soft drivers are largest                 generator separated from the drum, allows a perfect
  Nonostante la complessità del mercato,           are much more scattered globally al-                     temperature control during the whole roasting process,
  esistono quattro tipi generali di modelli di     though the Middle East has a large num-                  guaranteeing a uniform heat transfer inside the drum.
  crescita del caffè. Pensare al mercato del       ber of them.
  caffè in termini di questi quattro tipi rivela   Despite the complexity of the market,
  intuizioni impossibili usando raggruppa-         exist four general types of coffee growth                A technology that respects the ambient, since IMF roasters
  menti più tradizionali come la regione ge-       patterns. Thinking of the coffee market                  do not need any additional catalyzer, with emissions
  ografica.                                        in terms of these four types reveals in-
                                                                                                            widely below law limits.
                                                   sights not possible using more traditional
  Mercati guidati dalla                            groupings like geographic region.
  premiumizzazione
  La premiumizzazione risponde alla do-            The premiumisation-led markets                           Respect towards coffee beans, enhancing
  manda di mercato di accedere ad un’e-            Premiumisation is important everywhere                   the organoleptic characteristics of every origin
  sperienza unica, speciale, lussuosa a            but it is especially important in countries              in the cup.
  prezzi accessibili. È il sogno di ciascuno       with slow population growth and mature
  che diventa possibile. Inoltre, fornisce         coffee markets.
  occasione a un particolare prodotto di           These are countries, nearly entirely in
  distinguersi dagli altri per dar nuova vita      the developed world, where coffee is a
  alle vendite e soprattutto fidelizzare il con-   well-established portion of consumer life-
  sumatore. Stiamo parlando comunque di            styles.

26 27    CoffeeTrend magazine Dicembre I December 2019
prodotti di alta gamma a cui si cerca di          The coffee market is highly mature and               Prodotti monodose, bevande RTD (rea-             purely from increases in value. The shift
                         dare una percezione di super-premium.             with average consumption high and pop-               dy-to-drink) e Cold Brew (categoria che          into pods at home has been the major
                         La premiumizzazione è importante ovun-            ulation growth low there is little potential         comprende l’insieme di prodotti realizzati       driver of this, as well as increasing inter-
                         que ma è particolarmente importante nei           in volumes. Higher-value approaches                  tramite lentra estrazione del caffè) saranno     est in ethical coffee (compostable pods,
                         paesi con crescita lenta della popolazione        though are doing very well and taking oc-            fortemente dipendenti da questi paesi nei        fair trade certification, and organic prod-
                         e mercati del caffè maturi. Questi sono pa-       casions from long-established formats                prossimi anni.                                   ucts are all doing well and present val-
                         esi, quasi interamente nei paesi sviluppati,      like standard ground and instant.                    L’Italia fornisce forse l’esempio più chiaro     ue-added attributes that consumers are
                         in cui il caffè è una parte consolidata degli     Nearly half of all value growth globally be-         di un mercato in cui la crescita del caffè è     willing to pay for). Even growing demand
                         stili di vita dei consumatori.                    tween 2020 and 2023 will take place in               ormai quasi interamente dipendente dalla         for lower priced pods still represents pre-
                         In presenza di un mercato del caffè molto         these countries as consumers trade up                premiumizzazione. La crescita della popo-        miumisation given their greater expense
                         maturo con un consumo medio elevato               to more expensive formats. Pods and                  lazione è piatta e con una persona adulta        over other at-home formats.
                         e una crescita della popolazione bassa,           cold brew RTDs in particular will be heav-           media che consuma due tazzine al giorno,         Premiumisation is particularly acute in re-
                         il volume è limitato nel suo potenziale di        ily reliant on these countries in the com-           la crescita del volume è in gran parte im-       tail because unlike in many other places
                         crescita. Da qui l’esigenza di un approc-         ing years.                                           possibile. Tuttavia rimane una delle princi-     the coffee shop does not provide a ma-
                         cio di marketing tendente a valorizzare il        Italy provides perhaps the clearest exam-            pali fonti mondiali di crescita del caffè solo   jor source of value growth. Italians have
                         prodotto per le sue caratteristiche e quali-      ple of a market where coffee growth is               grazie all’aumento di valore.                    strong expectations about what foodser-
                         tà che può rifìguardare tutta la tipologia di     now nearly entirely reliant on premiumi-             Il notevole aumento dell’utilizzo del seg-       vice coffee should consist of, which has
                         formati.                                          sation. Population growth is flat and with           mento monodose in casa (sistema cialda/          made it much more difficult to innovate
                         Quasi la metà di tutta la crescita del va-        the average adult already drinking around            capsula e macchina per caffè dedicata) è         than elsewhere (Starbucks’s historic re-
                         lore a livello globale tra il 2020 e il 2023      two cups a day, volume growth is large-              stato il principale motore di questa cresci-     luctance to enter the Italian market can
                         avverrà in questi paesi, poiché i consuma-        ly impossible. Yet it remains one of the             ta, così come il crescente interesse per il      largely be attributed to this) particularly if
                         tori commerceranno in formati più costosi.        world’s leading sources of coffee growth             caffè etico (cialde/capsule compostabili,        it means higher prices. The largest sin-

   ALL PACK
   ideal partner for flexible packaging

   IMBALLAGGI FLESSIBILI
   PER LA TORREFAZIONE IN BOBINA
   E IN BUSTA PERFORMATA CON O SENZA VALVOLA
                                                                                            A L L
                                                                                                                L
   STAMPA FLEXO E ROTO

                                                                                                            ACK
                                                                                                              L
                                                                                                  PA PACK
   PRODUZIONE ANCHE DI PICCOLE QUANTITÀ

All Pack srl
          x - Viale del Commercio
                CoffeeTrend magazine 14/A - 37135
                                     Dicembre      Verona2019
                                              I December   (Vr) Tel./Fax 045-8266539 - info@allpacksrl.it - www.allpacksrl.it
certificazione del commercio equo e pro-
  dotti biologici rappresentao i prodotti a
  valore aggiunto che i consumatori sono
  sempre più disposti a pagare).
  Anche la crescente domanda di prodotti
  single-serve a basso prezzo ricadono an-
  cora nella categoria della premiumizzazio-
  ne, poiché conservano grandi marginalità
  di guadagno rispetto ai classici formati
  domestici in grani o macinato della grande
  distribuzione.                                   gle component in most of premiumisa-
  La premiumizzazione è particolarmente            tion coffee markets is switchover to pods
  evidente nel settore retail poiché nel setto-    from other formats. This is because of the
  re bar-caffetteria di per sé non costituisce     considerably higher price per cup when
  un importante fonte di valore, come inve-        coffee is placed into a single-serve pod.
  ce lo è in altre macro categorie prese sotto     Pods, however, are a category that is be-
  in esame.                                        coming mature and already global growth
  In Italia i consumatori hanno una radica-        rates are down from what they once
  ta tradizione del settore caffeario ed una       were. In a handful of countries growth
  scarsa propensione ad abbracciare nuo-           has already turned negative. In any given
  ve o innovative modalità di consumo se           market, the number of addressable pod
  questo si traduce in un aumento del costo        occasions eventually hits a ceiling and at
  del prodotto (da cui la storica riluttanza di    that point it becomes very difficult to grow
  Starbucks ad espandesi nel Belpaese).            further since the rise of unbranded pods
  La principale caratteristica dei mercati gui-    pushes unit prices in the category down-
  dati dalla premiumizzazione è quindi stret-      wards. This then has noticeable effects
  tamente connesso al passaggio al settore         on premiumisation at a category level. In
  del monoporzionato che genera un costo           the US, for example, premiumisation has
  per tazza decisamente maggiore rispetto          shrunk in size as a driver as pod growth
  alle tradizionali modalità di consumo. Il        has slowed and shifted towards less ex-
  monodose rappresenta tuttavia una cate-          pensive private label products.
  goria già matura e già i tassi di crescita       The example of Finland shows that the
  globali sono in calo rispetto a quelli di una    end of pod growth does not mean the
  volta. In alcuni paesi la crescita è già di-     end of premiumisation however. As pod
  ventata negativa. L’aumento del consumo          sales decline an average of 4% annu-
  del caffè monodose attraverso i cosidet-         ally, bean sales have picked up and pre-
  ti cloni spinge poi verso il basso i prezzi      miumisation in standard ground through
  unitari nella categoria. Ciò ha quindi effetti   attributes such as organic certification
  notevoli sulla premiumizzazione a livello di     has strengthened and overall rising price
  categoria. Negli Stati Uniti, ad esempio, la     continue to drive the Finnish market. This
  premiumizzazione si è ridotta in termini di      makes Finland an outlier among the pre-
  driver in quanto la crescita del monodose        miumisation markets for now but per-
  ha rallentato e si è spostata verso prodotti     haps a template for the others to follow
  a marchio del distributore meno costosi.         in the future as pod growth slows down.
  L’esempio della Finlandia mostra che la
  fine della crescita del monodose non si-         The income-led markets
  gnifica tuttavia la fine della premiumizza-      These are countries that in most cases
  zione. Poiché le vendite di caffè porziona-      have historically preferred tea to coffee,     V IS IT US AT:
  to diminuisce in media del 4% all’anno, le       but as incomes rise are seeing increasing
  vendite di caffè in grani sono aumentate         numbers of consumers with disposable
  anche attraverso attributi come la certifi-      income embrace coffee as a sign of their
                                                                                                  7 - 13 MAY 2020 • DÜSSELDORF
                                                                                                  S TAND D4 5 HALL 1 3
30 31    CoffeeTrend magazine Dicembre I December 2019
cazione biologica, che si è rafforzata, e il     arrival in the global middle class. They
                  prezzo complessivo registra un costante          are found mostly in developing portions
                  aumento dei prezzi.                              of Eastern Europe and Asia and unlike in
                  Ciò rende la Finlandia un caso anomalo           the premiumisation markets both value
                  tra i mercati guidati della premiumizzazio-      and volumes are doing well here.
                  ne, ma forse rappresenta un modello per          Coffee shops are particularly important
                  gli altri, dato che la crescita del monodo-      here both because they allow a place for
                  se potrebbe rallentare sensibilmente nel         consumers to learn about coffee as well
                  prossimo futuro anche in altri paesi.            while also serving a social role.
                                                                   Over half of global coffee shop growth
                  Mercati guidati dal reddito                      will take place in these countries in the
                  Questi sono paesi che nella maggior parte        coming years. Example countries: China,
                  dei casi hanno storicamente preferito il tè      Indonesia, Russia.
                  al caffè, ma con l’aumentare del reddito si
                  vede un numero crescente di consumato-
                  ri con reddito disponibile che abbraccia il
                  caffè come un segno del loro arrivo nella
                  classe media globale. Si trovano principal-
                  mente nelle aree in via di sviluppo dell’Eu-
                  ropa orientale e dell’Asia e, diversamente
                  dai mercati della premiumizzazione, sia il
                  valore che i volumi presentano buoni trend
                  di crescita.
                  Le caffetterie sono particolarmente im-
                  portanti in queste tipologie di mercato, sia
                  perché consentono ai consumatori di ave-
                  re un posto per conoscere il caffè, sia al
                  contempo svolgere un ruolo sociale. Oltre
                  la metà della crescita globale delle caffet-
                  terie avverrà in questi paesi nei prossimi
                  anni. Sono paesi di esempio la Cina, l’In-
                  donesia e la Russia.

                  Mercati guidati dalla popolazione
                  In questi paesi la crescita proviene dal nu-
                  mero di nuovi consumatori di caffè. Ciò
                  funziona a vantaggio dei già radicati e pre-     The population-led markets
                  senti format, poiché difficilmente i consu-      In these countries growth comes from
                  matori sono disposti a variare le modalità       a rising number of coffee drinkers. This
                  di consumo, o meglio, potrebbero essere          works to the benefit of current formats as
                  attirati da nuove forme di preparazione,         these markets see little in the way of cat-
                  ma sono spesso limitati dai loro bassi red-      egory switching.
                  diti, il che significa che rimangono legati ai   Consumers may want to trade up but
                  formati di base e convenienti come il caffè      are often restricted by their incomes from
                  istantaneo.                                      doing so, which means that basic and af-
                  Questi paesi si trovano generalmente in          fordable formats like instant are the key
                  Africa o in America centrale. Una mancia-        to the overall market.
                  ta si trova nei paesi sviluppati e anche in      These countries are generally found in
                  luoghi in cui i tassi di immigrazione sono       Africa or Central America. A handful are
                  abbastanza alti. Sono peasi di esempio il        found in developed countries as well in
                  Canda, l’Etiopia e il Messico.                   places where immigration rates as high

32 33   CoffeeTrend magazine Dicembre I December 2019
Puoi anche leggere