Robeco - Institutional Asset Management Solutions - Itinerari Previdenziali
←
→
Trascrizione del contenuto della pagina
Se il tuo browser non visualizza correttamente la pagina, ti preghiamo di leggere il contenuto della pagina quaggiù

Robeco - Institutional Asset Management Solutions
RobecoSAM Smart Materials – Azionario Sostenibile Tematico
Robeco Euro Sustainable Credit – Obbligazionario Europa

                                                             Annual Meeting sul Welfare Integrato
                                                             Fiuggi, 8 – 10 Novembre 2018
Per Investitori Professionali

                                                                                              1
Dati societari

           Masse Gestite: EUR 167 miliardi

           890 dipendenti di cui 227 sono professionisti d’investimento

           Uffici in 15 paesi nel mondo

           EUR 58 miliardi gestiti con tecniche sistematiche

           EUR 102 miliardi gestiti con criteri ESG Sostenibilità

           Rating A+ nelle classificazioni PRI (Principi Investimento Responsabile)

Dati a Giugno 2018

                                                         Robeco                       2
Punti di forza: esperienza in Cinque aree chiave

 Focus su 5 competenze chiave:

                                                     Mercati                Investimenti          Strategie
          Quant                  Credito                                                          Tematiche
                                                    Emergenti                 Sostenibili

Decenni di ricerca applicata   Consistenza e   Approccio Innovativo e   Leadership consolidata   Cogliere i trend,
   agli investimenti per         prudenza          diversificato           da oltre 25 anni      cambiamenti e
    soluzioni efficienti                                                                           innovazioni
                                                                                                    strutturali

                                                          Robeco                                                     3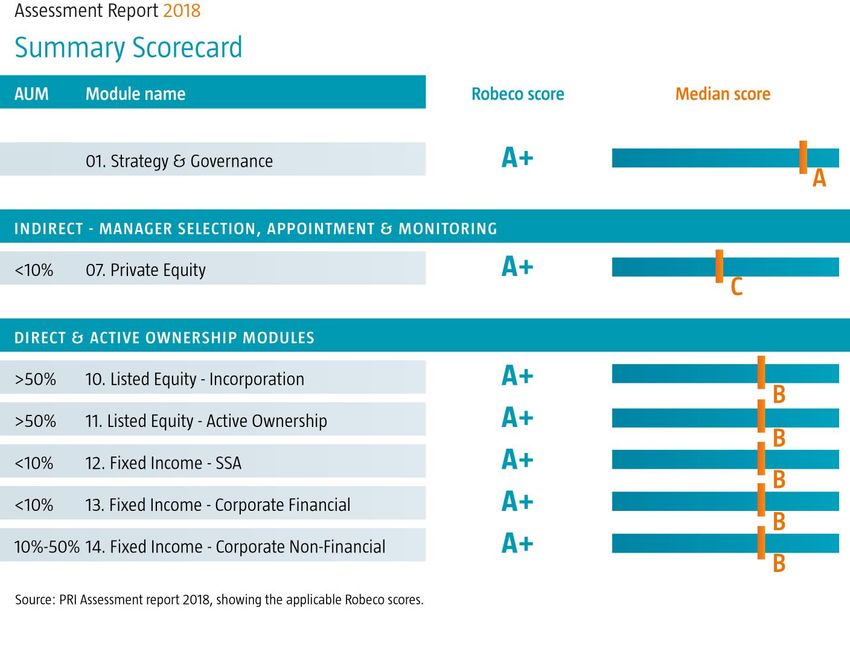
Punti di forza: esperienza in Cinque aree chiave

Focus su 5 competenze chiave:
                               Consistenza e                            Leadership consolidata     Cogliere i trend,
                                 prudenza                                  da oltre 25 anni    cambiamenti e innovazioni
                                                                                                      strutturali

                                                     Mercati                Investimenti             Strategie
          Quant                   Credito                                     Sostenibili            Tematiche
                                                    Emergenti

Decenni di ricerca applicata                   Approccio Innovativo e
    agli investimenti                              diversificato
  per soluzioni efficienti

                                                          Robeco                                                           4
Tratti distintivi del nostro approccio

                           > 23 anni di esperienza nell’investimento sostenbile
                           > Tra i principali sostenitori della sostenibilità
       trasparente         > Stretta collaborazione tra team dedicati ed esperti
      Cultura della
                           > Una strategia di engagement proattiva e visibile
      Sostenibilità
                           > Ricerca proprietaria Corporate Sustainability Assessment (CSA) su più di 4,600 aziende
                           > Analisi proprietaria sulla sostenibilità top-down di 65 Paesi
        esclusiva          > Punteggio Smart ESG per eliminare distorsione dei dati
Ricerca su Sostenibilità
                           > L’analisi di rilevanza fornisce input per la valutazione delle strategie di sostenibilità aziendale

                           > Diverse fasi del nostro processo di investimento beneficiano dell’analisi integrata
                           > L’analisi sulla sostenibilità rafforza il nostro processo di selezione titoli
       integrata           > I nostri parametri avanzati di sostenibilità migliorano il processo di costruzione del
Analisi Finanziaria &        portafoglio
  di Sostenibilità

                           > Alto grado di personalizzazione in funzione delle specifiche necessità del cliente
                           > Ampia gamma di fondi e mandati personalizzati
       Flessibilità        > Reportistica all’avanguardia dedicata agli obiettivi di sostenibilità
       di soluzioni

                                                                         Robeco                                                    5
P.R.I. – Principi Investimento Responsabile
Giudizio 2018 per Robeco

                                      Robeco   6
RobecoSAM
                                Smart Materials

Per Investitori Professionali
Investimento in nuovi materiali e risorse
Investire nelle risorse tradizionali Materiali Innovativi
• Investire in risorse scarse • Investire nella soluzione alle risorse scarse
• Potenziali di miglioramento limitate • Innovazione e qualità in aumento
• Esposizione ciclica alla crescita • Esposizione alla crescita secolare
• Reattività alla domanda passata • Anticipano la domanda futura
• Quote di mercato instabili • Crescita quote di mercato
1. Migliori potenziali d’investmento
2. Rischio più contenuto
Robeco SAM Smart Materials 10Selezione dei trends e ambito d’investimento
Materiali di trasformazione Materiali avanzati
• Ultraleggeri • Metalli Strategici &
Speciali
• E-Paper & Nuovi Displays
• Materiali funzionali
• Bio-materiali
• Contenitori di Energia
Automazione e Robotica Processi teconologici
• Robotics & Lasers • Recycling & Riutilizzo
• Automation & Process • Gas Industriali
Control
• Strumenti analitici
• Software
Robeco SAM Smart Materials 11Le fibre di carbonio leggere crescono per l’industria aerea
Boeing and Airbus : evoluzione dei materiali per gli aerei nel tempo
80%
Alluminio
100%
50% Aluminum-Lithium alloys
Fibre di carbonio
30% Others
20%
10%
0%
B747 (1970s) B777 A340 A380 B787 (2007) A350
Source: Bank of America, 2010.
Robeco SAM Smart Materials 12L’avvenire della robotica
Stabile trend di crescita
- Espansione in settori con minore impiego attuale
- Aumento densità di utilizzo nei paesi manifatturieri (es.
China)
• Nuovi modelli di robot come i “Cobots”
Robeco SAM Smart Materials 11Performance dal lancio
RobecoSAM Smart MaterialsFund (30.09.2018, Gross of fees, EUR)
200%
150%
100%
50%
0%
-50%
-100%
10-2006 10-2008 10-2010 10-2012 10-2014 10-2016
RobecoSAM Smart Materials Fund MSCI World Index TRN
Inception date: 02.10.2006
Fonte : RobecoSAM. Data al 30.09.2018
Ci sono costi quali commissione di gestione e altri costi . Questi hanno un effetto negativo sui rendimenti mostrati. I periodi inferiori ad un anno non sono annualizzati. Il valore degli
investimenti possono variare. I risultati ottenuti nel passato non forniscono garanzia per i futuri.
Robeco SAM Smart Materials 12Robeco Euro Sustainable Credits Per Investitori Professionali
Processo d’investimento

Integrazione criteri ESG a tre livelli del processo decisionale e d’investmento
> Selezione dell’universo: determinare i titoli potenzialmente investibili escludendo chi resta indietro
> Analisi d’investimento: classificazione e giudizio sui fondamentali
> Costruzione del portafoglio: ottimizzazione dell’impatto ambientale e selezione di “obbligazioni green”

Selezione Universo Analisi d’investimento

     Giudizio di                 Outlook Credito        Costruzione del portafoglio       Gestione del rischio       Implementazione
                    TOP DOWN

    Sostenibilità                  Trimestrale
                                 Credit Beta target,             Portafoglio                 Linee guida per                Portafoglio
                                  Portfolio themes
   Peggior 50%                                                    Modello                  controllo del rischio             Investito
                                 Performance driver
  escluso in ogni                  risk allocation                                        Risk Management/Ufficio
      settore                                             Gestore                         legale e conformità        Gestore/Traders

                                      Ricerca             › Selezione emittenti
                                                          › Esposizione beta                                         › Implementazione con
                    BOTTOM UP

                                  Fondamentale            › Strategie di overlay          › Controllo restrizioni      obbligazioni e indici di
                                     F-Scores e                                             d’investimento e linee     credito
      Robeco &                                           Ottimizzazione Impatto &           guida societarie e del   › Duration e copertura
                                  Raccomandazioni              Green bonds
     RobecoSAM                                                                              fondo                      rischio di cambio
                                RobecoSAM giudizio di
                                    sostenibilita’

Source: Robeco

                                                        Robeco Euro Sustainable Credits                                                           14
Processo d’investimento: giudizio di sostenibilità
L’universo investibile è riclassificato in base ai giudizi di sostenibilità. Solo il primo 50% di ogni settore viene incluso.
Classifica di sostenibilità
Top 50%
Selezione Positiva
Emittenti investibili
Selezione Negativa
Bottom 50% Emittenti non investibili
Emittenti per settore
Fonte : RobecoSAM
Robeco Euro Sustainable Credits 15Analisi di credito fondamentale : profondità & multi-dimensionalità
All’avanguardia nella ricerca e analisi delle informazioni societarie rilevanti
Componenti dell’analisi
> Posizione competitiva Company characteristics Management
Industry characteristics strategy
> Strategia Industry trends/outlook Risk appetite
Market position Growth strategy
Country/sovereign risk Bondholder friendliness
> Posizione finanziaria
> Struttura societaria F Focus ai rischi di ribasso
Leverage/Liquidity
> Profilo ESG Sostenibilità Coverage Score Aspetti finanziari
Expected recovery Rilevanti
Margins
Financial forecasts Considerazione
di Impatto
Analisi di credito :
Ownership structure
Corporate structure
> Giudizio fondamentale [-3 a +3] Quality of covenants
> Giudizio basato sui fondamentali di credito relativi e attesi
dato il suo rating, nei diversi settori
> Raccomandazione d’investmento (Underperform, In Line, Outperform)
> Giudizio sulla valutazione in relazione ai fondamentali
Source: Robeco
Robeco Euro Sustainable Credits 16Analisi di credito fondamentale : profondità & multi-dimensionalità
All’avanguardia nella ricerca e analisi delle informazioni societarie rilevanti
Componenti dell’analisi
> Posizione competitiva Company characteristics Management
Industry characteristics strategy
> Strategia Industry trends/outlook Risk appetite
Market position Growth strategy
Country/sovereign risk Bondholder friendliness
> Posizione finanziaria
> Struttura societaria F Focus ai rischi
Leverage/Liquidity di ribasso
> Profilo ESG Sostenibilità Coverage Score
Expected recovery Aspetti finanziari
Margins Rilevanti
Financial forecasts
Considerazione
Analisi di credito : di Impatto
Ownership structure
Corporate structure
> Giudizio fondamentale [-3 a +3] Quality of covenants
> Giudizio basato sui fondamentali di credito relativi e attesi
dato il suo rating, nei diversi settori
> Raccomandazione d’investmento (Underperform, In Line, Outperform)
> Giudizio sulla valutazione in relazione ai fondamentali
Source: Robeco
Robeco Euro Sustainable Credits 17Analisi Fondamentale di credito: i criteri ESG per identificare i rischi di ribasso
Completa integrazione dei criteri ESG nel processo d’investimento obbligazionario
Accesso alla ricerca
> Combinazione di ricerca proprietaria su sostenibilità con
fonti esterne inclusi RobecoSAM, Sustainalytics, RepRisk e
Glass Lewis
Accesso alla Integrazione
ricerca Integrazione ESG
Integrazione ESG ESG
Sostenibilità
> Analisi di credito che giudica il profilo ESG di ciascun
emittente obbligazionario, basato su una profonda
conoscenza settoriale e sulla ricerca in sostenibilità
Partecipazione
Partecipazione attiva (Active Ownership) Attiva
> Partecipazione attiva agli organi di governo delle società per (Active Ownership)
migliorare il profilo ESG e accrescere la nostra ricerca sulla
sostenibilità
Source: Robeco
Robeco Euro Sustainable Credits 18Costruzione di portafoglio: le Obbligazioni Green sono in crescita nel portafoglio
Per emittenti “best-in-class” spesso acquistiamo Green Bonds piuttosto che obbligazioni tradizionali
> Più e più emittenti di Green Bonds accanto alle obbligazioni tradizionali
> I rendimenti dei Green Bonds tendono ad essere buoni, poichè i fondi dedicati li utilizzano
> Siamo acquirenti di Green Bonds se gli emittenti appartengono alla categoria “best-in-class” del nostro universo
investibile e quando ne apprezziamo il potenziale di rendimento
In casi specifici acquistiamo Green Bonds di un emittente che non appartiene alla selezione “best-in-class”
> In questi casi richiediamo un’analisi ulteriormente approfondita della documentazione del Green Bond, oltre la
tradizionale analisi obbligazionaria
Posizionamento attuale
> Possediamo circa 9% del portafoglio in Green Bonds*
> Nessuna posizione appartiene ad emittenti che non siano classificati come “best-in-class”
*Fonte: Robeco. Dati a fine Maggio 2018
Robeco Euro Sustainable Credits 19Posizionamento : Rating & 10 investimenti principali
Rating scomposizione Rating scomposizione
Pesi assoluti Pesi relativi in “risk points”
60% 150 128
51%
47%
50% 100 73
38%
40% 43
27% 50 11
30%
0
20%
6% 9% 10% 7% -50 -11
10% 1% 1% 0%
0%
0% -100 -67
AAA AA A BBB BB B AAA AA A BBB BB B
◼ Robeco Euro Sustainable Credits ◼ Benchmark
Top 10 active positions(asmeasured by riskpoints) Weight (w) Spread (s) Spread-duration (sd) (w) x (s) x (sd)
Issuer Sector Port BM Delta Port BM Delta Port BM Delta Port BM Delta
BANKIASA Banking 1.1% 0.0% 1.1% 649 0 649 6.7 0.0 6.7 49 0 49
IBERDROLA Utilities 1.8% 0.7% 1.1% 200 123 77 8.6 6.0 2.6 36 6 30
VOLKSWAGEN Consumer cyclical 0.0% 1.6% -1.6% 0 210 -210 0.0 6.7 -6.7 0 30 -30
BARCLAYSPLC Banking 1.1% 0.6% 0.5% 336 144 191 8.7 3.5 5.1 32 3 29
CAIXABANK Banking 1.2% 0.3% 0.8% 354 220 133 5.8 5.6 0.2 31 4 27
KBCGroup NV Banking 1.0% 0.3% 0.8% 241 134 107 9.2 4.0 5.2 24 2 23
ABN AMRO BANKNV Banking 1.9% 0.7% 1.2% 243 109 134 4.0 3.8 0.2 23 3 21
BANCO SANTANDERSA Banking 2.2% 0.6% 1.6% 301 179 122 4.4 5.2 -0.9 27 7 20
ASRNEDERLAND NV Insurance 1.0% 0.1% 1.0% 347 368 -21 6.1 5.7 0.4 21 1 20
NN GROUP NV Insurance 1.3% 0.3% 1.0% 335 274 61 5.2 5.7 -0.5 24 5 19
Fonte: Robeco. Fund: Robeco Euro Sustainable Credits. Benchmark: Bloomberg Barclays Euro Aggregate: Corporates. Dati a fine Sett 2018
E’ un esempio per sole finalita’ informative e non intende essere una sollecitazione o consiglio d’investimento in nessun modo.
Robeco Euro Sustainable Credits 20Portafoglio: include società con i migliori giudizi di sostenibilità
Portfolio: Robeco Euro Sustainable Credits
Benchmark: Bloomberg Barclays Euro Aggregate: Corporates
RobecoSAM Sustainability Scores for Robeco Euro Sustainable Credits versus the benchmark (end of June 2018).
E’ un esempio per sole finalita’ informative e non intende essere una sollecitazione o consiglio d’investimento in nessun modo.
Robeco Euro Sustainable Credits 21Robeco Euro Sustainable Credits: performance prodotto dal lancio
Annualized performance Robeco Euro Sustainable Credit Bonds 30-Jun-2018
YTD 1Year 3 Year 5 Year Since Jun-10
Robeco Euro Sustainable Credit Bonds -0.87% 1.28% 2.77% 3.55% 4.42%
Bloomberg Barclays Euro Aggregate: Corporates -0.64% 1.12% 2.49% 3.28% 4.01%
Relative performance -0.23% 0.16% 0.28% 0.27% 0.40%
Tracking error 0.36% 0.42% 0.40% 0.50%
Information ratio 0.43 0.67 0.69 0.81
Calendar year performance Robeco Euro Sustainable Credit Bonds
2017 2016 2015 2014 2013 2012
Robeco Euro Sustainable Credit Bonds 3.28% 4.95% -0.08% 8.05% 2.73% 14.80%
Bloomberg Barclays Euro Aggregate: Corporates 2.41% 4.73% -0.56% 8.40% 2.37% 13.59%
Relative performance 0.87% 0.23% 0.48% -0.35% 0.36% 1.20%
> Outperforming the “mainstream” index rather than a customized benchmark
Source: Robeco. Robeco Euro Sustainable Credits DH EUR share class, gross of fees, based on net asset value, all figures in EUR. Benchmark: Bloomberg Barclays Euro Aggregate: Corporates
Ci sono costi quali commissione di gestione e altri costi . Questi hanno un effetto negativo sui rendimenti mostrati. I periodi inferiori ad un anno non sono annualizzati. Il valore degli investimenti possono variare.
I risultati ottenuti nel passato non forniscono garanzia per i futuri.
Robeco Euro Sustainable Credits 22Informazioni Importanti - Disclamer
Important Information This document is not directed to, or intended for distribution to or use by any person or entity
Robeco Institutional Asset Management B.V. has a license as manager of Undertakings for who is a citizen or resident of or located in any locality, state, country or other jurisdiction where
Collective Investment in Transferable Securities (UCITS) and Alternative Investment Funds (AIFs) such distribution, document, availability or use would be contrary to law or regulation or which
(“Fund(s)”) from The Netherlands Authority for the Financial Markets in Amsterdam. would subject any Fund or Robeco Institutional Asset Management B.V. to any registration or
licensing requirement within such jurisdiction. Any decision to subscribe for interests in a Fund
This document is solely intended for professional investors, defined as investors qualifying as offered in a particular jurisdiction must be made solely on the basis of information contained in
professional clients, have requested to be treated as professional clients or are authorized to the prospectus, which information may be different from the information contained in this
receive such information under any applicable laws. Robeco Institutional Asset Management B.V document. Prospective applicants for shares should inform themselves as to legal requirements
and/or its related, affiliated and subsidiary companies, (“Robeco”), will not be liable for any also applying and any applicable exchange control regulations and applicable taxes in the
damages arising out of the use of this document. Users of this information who provide countries of their respective citizenship, residence or domicile.
investment services in the European Union have their own responsibility to assess whether they
are allowed to receive the information in accordance with MiFID II regulations. To the extent this The Fund information, if any, contained in this document is qualified in its entirety by reference
information qualifies as a reasonable and appropriate minor non-monetary benefit under MiFID to the prospectus, and this document should, at all times, be read in conjunction with the
II, users that provide investment services in the European Union are responsible to comply with prospectus. Detailed information on the Fund and associated risks is contained in the prospectus.
applicable recordkeeping and disclosure requirements. The prospectus and the Key Investor Information Document for the Robeco Funds can all be
obtained free of charge at www.robeco.com.
The content of this document is based upon sources of information believed to be reliable and
comes without warranties of any kind. Without further explanation this document cannot be Additional Information for investors with residence or seat in Italy
considered complete. Any opinions, estimates or forecasts may be changed at any time without This document is considered for use solely by qualified investors and private professional clients
prior warning. If in doubt, please seek independent advice. It is intended to provide the (as defined in Article 26 (1) (b) and (d) of Consob Regulation No. 16190 dated 29 October 2007). If
professional investor with general information on Robeco’s specific capabilities, but has not been made available to Distributors and individuals authorized by Distributors to conduct promotion
prepared by Robeco as investment research and does not constitute an investment and marketing activity, it may only be used for the purpose for which it was conceived. The data
recommendation or advice to buy or sell certain securities or investment products and/or to and information contained in this document may not be used for communications with
adopt any investment strategy and/or legal, accounting or tax advice. All rights relating to the Supervisory Authorities. This document does not include any information to determine, in
information in this document are and will remain the property of Robeco. This material may not concrete terms, the investment inclination and, therefore, this document cannot and should not
be copied or used with the public. No part of this document may be reproduced, or published in be the basis for making any investment decisions.
any form or by any means without Robeco's prior written permission.
Investment involves risks. Before investing, please note the initial capital is not guaranteed.
Investors should ensure that they fully understand the risk associated with any Robeco product
or service offered in their country of domicile (“Funds”). Investors should also consider their own
investment objective and risk tolerance level. Historical returns are provided for illustrative
purposes only. The price of units may go down as well as up and the past performance is not
indicative of future performance. If the currency in which the past performance is displayed
differs from the currency of the country in which you reside, then you should be aware that due
to exchange rate fluctuations the performance shown may increase or decrease if converted into
your local currency. The performance data do not take account of the commissions and costs
incurred on trading securities in client portfolios or on the issue and redemption of units. Unless
otherwise stated, the prices used for the performance figures of the Luxembourg-based Funds
are the end-of-month transaction prices net of fees up to 4 August 2010. From 4 August 2010, the
transaction prices net of fees will be those of the first business day of the month. Return figures
versus the benchmark show the investment management result before management and/or
performance fees; the Fund returns are with dividends reinvested and based on net asset values
with prices and exchange rates of the valuation moment of the benchmark. Please refer to the
prospectus of the Funds for further details. Performance is quoted net of investment
management fees. The ongoing charges mentioned in this document are the ones stated in the
23
Fund's latest annual report at closing date of the last calendar year.Appendice
24Portfolio Exposure (1/2) – as of September 30th, 2018
Cluster exposure Sector exposure Market capitalization exposure
(excluding cash) (Global Industry Classification Standard excluding cash) (excluding cash)
0% 10% 20% 30% 40% 50% 0% 10% 20% 30% 40% 50% 0% 20% 40% 60% 80%100%
41,4%
42,0% 51,6%
Transformational
Materials 36,2%
Materials
29,6% Large caps (>USD
48,9%
4,7% 10bn)
92,6%
28,7%
24,6%
Automation and Information
26,3%
Robotics Technology
30,1%
19,1% 25,4%
Mid caps (USD 2-
41,2%
10bn)
27,6% 7,4%
20,7%
Advanced Materials Industrials 29,6%
19,8%
11,3%
23,1%
2,3% Small caps (Portfolio Exposure (2/2) – as of September 30th, 2018
Regional exposure Country exposure Currency exposure
(excluding Cash) (Company domicile, excluding cash) (including cash)
0% 20% 40% 60% 80% 0% 20% 40% 60% 80% 0% 20% 40% 60% 80%
44,8% 47,0%
51,0% United States 44,6% USD 46,6%
62,0% 62,3%
America 46,9%
13,1% 15,5%
65,3% Japan 18,6% EUR 13,1%
8,5% 11,0%
8,9% 12,8%
26,2% United Kingdom 4,2% JPY 18,6%
6,1% 8,5%
Europe 25,9%
8,0% 8,6%
21,9% Korea 4,9% GBP 4,6%
6,1%
6,6% 7,8%
22,8% Germany 3,5% KRW 4,9%
3,3%
Asia 27,1%
4,4% 4,3%
12,6% Canada 1,1% CAD 0,7%
3,4% 3,4%
RobecoSAM Smart Materials St Strategic Theme Reference* MSCI World Index TRN
ra
Source: RobecoSAM. Data as of 30.09.2018
*Refers to the Strategic Theme Reference (STR): market cap adjusted reflection of the universe.
Queste informazioni sono incluse solo a scopo illustrativo per quanto riguarda tendenze e condizioni economiche o processi di investimento. Non si deve presumere che gli investimenti in settori e / o mercati identificati siano o saranno redditizi. Le informazioni presentate si basano
account rappresentativo nel composito. Il portafoglio di ciascun investitore è gestito individualmente e può variare rispetto alle informazioni mostrate.
Robeco SAM Smart Materials 26Posizionamento del portafoglio
Top-down
> Esposizione al mercato del credito è attualmente cauta con beta di 0.94
Regionale
> Overweight in Spagna, Olanda e Regno Unito
> Underweight in Francia, Germania e Italia
Settoriale
> Overweight principali nel settore Assicurazioni e Banche
> Underweight principali nel settore Consumer cyclical, Energia e Trasporti
Il fondo ha esposizione over-weight a debito subordinato (emesso da istituzioni finanziare e non)
Source: Robeco Euro Sustainable Credits. Benchmark: Bloomberg Barclays Euro Aggregate: Corporates. Over- and underweights are based on risk points (duration times spread). Data end of June 2018
E’ un esempio per sole finalita’ informative e non intende essere una sollecitazione o consiglio d’investimento in nessun modo.
Robeco Euro Sustainable Credits 27Robeco Euro Sustainable Credits: caratteristiche del fondo
Caratteristiche Fondo Benchmark Differenza
Yield to Maturity 1.0% 1.1% -0.1%
Yield (hedged to EUR) 0.9% 1.1% -0.2%
Interest rate duration (OADin years) 5.1 5.2 -0.1
Spread duration (OASDin years) 4.4 5.3 -0.9
Credit spread (OASin bps) 102 114 -12
Coupon 1.7% 2.0% -0.3%
DTSbeta 0.91 1.00
Emittenti 93 563
Rating medio A3/ BAA1 A3/ BAA1
Fonte: Robeco. Fund: Robeco Euro Sustainable Credits. Benchmark: Bloomberg Barclays Euro Aggregate: Corporates. Dati a fine Sett 2018
E’ un esempio per sole finalita’ informative e non intende essere una sollecitazione o consiglio d’investimento in nessun modo.
Robeco Euro Sustainable Credits 28Performance
Impatto : profonda valutazione degli impatti ambientali
Portfolio: Robeco Euro Sustainable Credits
Benchmark: Bloomberg Barclays Euro Aggregate: Corporates
RobecoSAM Impact Overview for Robeco Euro Sustainable Credits versus the benchmark (end of June 2018). *European average figures per year. Average carbon dioxide emissions from new passenger cars per yea
average 20,000 km and 130 g CO2-eq/km; in t CO2-eq (source: www.eea.europa.eu) 2.6 Average electricity consumption per household and year; in MWh (source: www.ec.europa.eu/Eurostat) 3.9
Average water consumption per person and year; in m3 (source:www.eea.europa.eu) 47.5. Average waste generation per household and year; in t (source: www.ec.europa.eu/eurostat) 0.4
Robeco Euro Sustainable Credits 29Dati e classificazione della masse gestite
Masse gestite da Robeco
> EUR 167 miliardi a Giugno 2018
Scomposizione per asset-class Tipologia di clientela Aree geografiche Tipologia clienti istituzionali
◼ Azionario 51% ◼ Istituzionali 70% ◼ Europa 85% ◼ Fondi Pensione 60%
◼ Obbligazionario 25% ◼ Retail 30% ◼ Asia-Pacifico 6% ◼ Banche 19%
◼ Bilanciato 21% ◼ America 5% ◼ Instituzioni ufficiali 9%
◼ Alternativi 2% ◼ Medio Oriente & Africa 4% ◼ Assicurazioni 9%
◼ Monetario 1% ◼ Corporate 2%
◼ Altri 1%
Dati a Giugno 2018
Robeco 30Una lunga storia e solide credenziali
23 anni di esperienza negli investimenti sostenibili:
Il primo Introduzione Integrazione Punteggio Robeco firma Lancio del
Lancio del fondo di del servizio Tra i primi massimo in l’agenda primo
ESG in tutte
Fondazione primo fondo fondi PE Voting & firmatari tutte le olandese fondo
le
di Robeco azionario sostenibile Engagement dello UN PRI categorie “SDG credito
competenze
sostenibile di UN PRI investing” globale SDG
gestionali
Robeco
1929 1995 1999 2001 2004 2005 2006 2010 2013 2014 2015 2016 2017 2018
Fondazione Cooperazion Lancio del Il primo RobecoSA Tra i primi Introduzione Introduzion Lancio del
di e con primo fondo di M entra in firmatari punteggi e fondo
RobecoSAM Dow Jones fondo fondi PE Robeco dello UN Smart ESG piattaforma Sustainable
sostenibile Clean Tech Group PRI Impact Global
sull’acqua al mondo Investing Impact
Equities
Source: Robeco, RobecoSAM
Robeco 31Informazioni Importanti - Disclamer
Important Information This document is not directed to, or intended for distribution to or use by any person or entity
Robeco Institutional Asset Management B.V. has a license as manager of Undertakings for who is a citizen or resident of or located in any locality, state, country or other jurisdiction where
Collective Investment in Transferable Securities (UCITS) and Alternative Investment Funds (AIFs) such distribution, document, availability or use would be contrary to law or regulation or which
(“Fund(s)”) from The Netherlands Authority for the Financial Markets in Amsterdam. would subject any Fund or Robeco Institutional Asset Management B.V. to any registration or
licensing requirement within such jurisdiction. Any decision to subscribe for interests in a Fund
This document is solely intended for professional investors, defined as investors qualifying as offered in a particular jurisdiction must be made solely on the basis of information contained in
professional clients, have requested to be treated as professional clients or are authorized to the prospectus, which information may be different from the information contained in this
receive such information under any applicable laws. Robeco Institutional Asset Management B.V document. Prospective applicants for shares should inform themselves as to legal requirements
and/or its related, affiliated and subsidiary companies, (“Robeco”), will not be liable for any also applying and any applicable exchange control regulations and applicable taxes in the
damages arising out of the use of this document. Users of this information who provide countries of their respective citizenship, residence or domicile.
investment services in the European Union have their own responsibility to assess whether they
are allowed to receive the information in accordance with MiFID II regulations. To the extent this The Fund information, if any, contained in this document is qualified in its entirety by reference
information qualifies as a reasonable and appropriate minor non-monetary benefit under MiFID to the prospectus, and this document should, at all times, be read in conjunction with the
II, users that provide investment services in the European Union are responsible to comply with prospectus. Detailed information on the Fund and associated risks is contained in the prospectus.
applicable recordkeeping and disclosure requirements. The prospectus and the Key Investor Information Document for the Robeco Funds can all be
obtained free of charge at www.robeco.com.
The content of this document is based upon sources of information believed to be reliable and
comes without warranties of any kind. Without further explanation this document cannot be Additional Information for investors with residence or seat in Italy
considered complete. Any opinions, estimates or forecasts may be changed at any time without This document is considered for use solely by qualified investors and private professional clients
prior warning. If in doubt, please seek independent advice. It is intended to provide the (as defined in Article 26 (1) (b) and (d) of Consob Regulation No. 16190 dated 29 October 2007). If
professional investor with general information on Robeco’s specific capabilities, but has not been made available to Distributors and individuals authorized by Distributors to conduct promotion
prepared by Robeco as investment research and does not constitute an investment and marketing activity, it may only be used for the purpose for which it was conceived. The data
recommendation or advice to buy or sell certain securities or investment products and/or to and information contained in this document may not be used for communications with
adopt any investment strategy and/or legal, accounting or tax advice. All rights relating to the Supervisory Authorities. This document does not include any information to determine, in
information in this document are and will remain the property of Robeco. This material may not concrete terms, the investment inclination and, therefore, this document cannot and should not
be copied or used with the public. No part of this document may be reproduced, or published in be the basis for making any investment decisions.
any form or by any means without Robeco's prior written permission.
Investment involves risks. Before investing, please note the initial capital is not guaranteed.
Investors should ensure that they fully understand the risk associated with any Robeco product
or service offered in their country of domicile (“Funds”). Investors should also consider their own
investment objective and risk tolerance level. Historical returns are provided for illustrative
purposes only. The price of units may go down as well as up and the past performance is not
indicative of future performance. If the currency in which the past performance is displayed
differs from the currency of the country in which you reside, then you should be aware that due
to exchange rate fluctuations the performance shown may increase or decrease if converted into
your local currency. The performance data do not take account of the commissions and costs
incurred on trading securities in client portfolios or on the issue and redemption of units. Unless
otherwise stated, the prices used for the performance figures of the Luxembourg-based Funds
are the end-of-month transaction prices net of fees up to 4 August 2010. From 4 August 2010, the
transaction prices net of fees will be those of the first business day of the month. Return figures
versus the benchmark show the investment management result before management and/or
performance fees; the Fund returns are with dividends reinvested and based on net asset values
with prices and exchange rates of the valuation moment of the benchmark. Please refer to the
prospectus of the Funds for further details. Performance is quoted net of investment
management fees. The ongoing charges mentioned in this document are the ones stated in the
32
Fund's latest annual report at closing date of the last calendar year.Puoi anche leggere