AN EXPERIMENTAL SETUP FOR COMBINED WAVE-CURRENT FLOW INTERACTING AT A RIGHT ANGLE OVER A PLANE BEACH - DOIs
←
→
Trascrizione del contenuto della pagina
Se il tuo browser non visualizza correttamente la pagina, ti preghiamo di leggere il contenuto della pagina quaggiù
DOI: 10.4408/IJEGE.2020-01.S-11

AN EXPERIMENTAL SETUP FOR COMBINED WAVE-CURRENT FLOW INTERACTING
               AT A RIGHT ANGLE OVER A PLANE BEACH

                         Massimiliano MARINO(*), Carla FARACI(**) & Rosaria Ester MUSUMECI(*)

                  (*)
                        University of Catania – Department of Civil Engineering and Architecture – Via Santa Sofia, 46 – 95123, Catania, Italy
                                     (**)
                                            University of Messina – Department of Engineering – C.da Di Dio 98166, Messina, Italy
                                                                 Corresponding author: ms.marino@unict.it

EXTENDED ABSTRACT
     Onde e correnti sono spesso presenti simultaneamente in zona costiera. La loro interazione dà luogo ad un complesso campo di
moto idrodinamico, il quale governa importanti processi costieri e.g. trasporto solido. Lungo la costa tale campo di moto è ulteriormente
complicato dall’interazione con il fondale, il quale può essere fisso, erodibile, inclinato o presentare forme di fondo. Sebbene siano
stati compiuti grandi progressi nello studio dell’interazione onde-correnti e nello sviluppo dei relativi modelli teorici, la conoscenza del
fenomeno presenta ancora delle criticità importanti. Innanzitutto, la maggior parte dei dati sperimentali esistenti provengono da esperimenti
sull’interazione fra onde e correnti co-lineari, ovvero aventi la stessa direzione, sebbene l’angolo di attacco fra onde e correnti avvenga in
zona costiera prevalentemente con un angolo ortogonale o quasi ortogonale. La mancanza di dati nelle suddette condizioni è probabilmente
dovuta a difficoltà connesse alla modellazione fisica e alla mancanza di apparati di laboratorio adeguati alla riproduzione di questo
particolare campo di moto. Ciò ha fatto sì che i modelli teorici esistenti siano stati validati prevalentemente su esperimenti co-lineari,
malgrado studi recenti mostrino come questo abbia determinato una insensibilità direzionale ed una non corretta ricostruzione degli sforzi
tangenziali al fondo di tali modelli. Inoltre, i pochi esperimenti esistenti sono prevalentemente su fondo piano, dunque gli effetti non lineari
determinati dalla propagazione del moto ondoso su un fondale con profilo inclinato (e.g., shoaling) su una corrente diretta ortogonalmente
non sono stati studiati approfonditamente in letteratura.
     Nel presente lavoro è stato condotto uno studio sperimentale sull’interazione ortogonale fra onde e correnti su fondo inclinato. Il
lavoro è incentrato sulla caratterizzazione idrodinamica del setup sperimentale. Una serie di esperimenti è stata effettuata all’interno di una
vasca sperimentale, dove mediante un generatore di onde e un sistema di ricircolo delle correnti è possibile dar luogo alla contemporanea
presenza di onde e correnti interagenti ad angolo retto. Sono stati effettuati esperimenti sia in condizioni di sola corrente che di onde più
correnti. Il moto ondoso e la corrente interagiscono in corrispondenza di un fondo fisso liscio con pendenza 1:25. Un moto oscillatorio
regolare con altezza d’onda H = 0.01 m e periodo T = 1.0 s è stato sovrapposto ad una corrente con velocità media U = 0.11 m/s. Sono stati
condotti 19 test, 14 dei quali in condizione di sola corrente e 5 in condizione di onde più correnti. La sopraelevazione d’onda e le velocità
sono state misurate, rispettivamente, mediante sonde resistive e velocimetri acustici ad effetto Doppler. I velocimetri sono stati posizionati
all’interno dell’area di acquisizione al fine di caratterizzare spazialmente il campo di moto. Nello specifico, sono state riprodotte tre
disposizioni geometriche della strumentazione di misura: con un array lineare in direzione della corrente, con un array lineare in direzione
delle onde, a croce in entrambe le direzioni.
     In presenza di sola corrente, i risultati dei profili di velocità media mostrano che all’interno del setup sperimentale è possibile riprodurre
una corrente soddisfacentemente ortogonale rispetto alla direzione del moto ondoso, sebbene all’allontanarsi dall’asse di mezzeria della
sezione di ingresso e di uscita della corrente questa subisce un effetto di deviazione nella direzione del moto ondoso. Questo suggerisce la
presenza di regioni di ricircolo, le quali all’allontanarsi dalla regione di ingresso/uscita della corrente inducono una deviazione del flusso
in direzione ortogonale rispetto alla direzione prevista. I profili di velocità mostrano inoltre la presenza di un moto medio verticale in
direzione normale al fondo. Questo può essere dovuto ad un rallentamento della corrente in prossimità della sezione di uscita. In presenza
di onde sovrapposte alla corrente, i risultati dei profili di velocità media mostrano un aumento di velocità della corrente per effetto della
sovrapposizione del moto ondoso. Tale dato suggerisce la presenza di un trasferimento di quantità di moto media nella direzione della
corrente per effetto del moto oscillatorio. L’incremento di velocità è maggiore a profondità relativamente minori, ed è tale da ridurre
l’effetto di richiamo delle regioni di ricircolo.

Italian Journal of Engineering Geology and Environment, 1 (2020)              © Sapienza Università Editrice                             www.ijege.uniroma1.it   99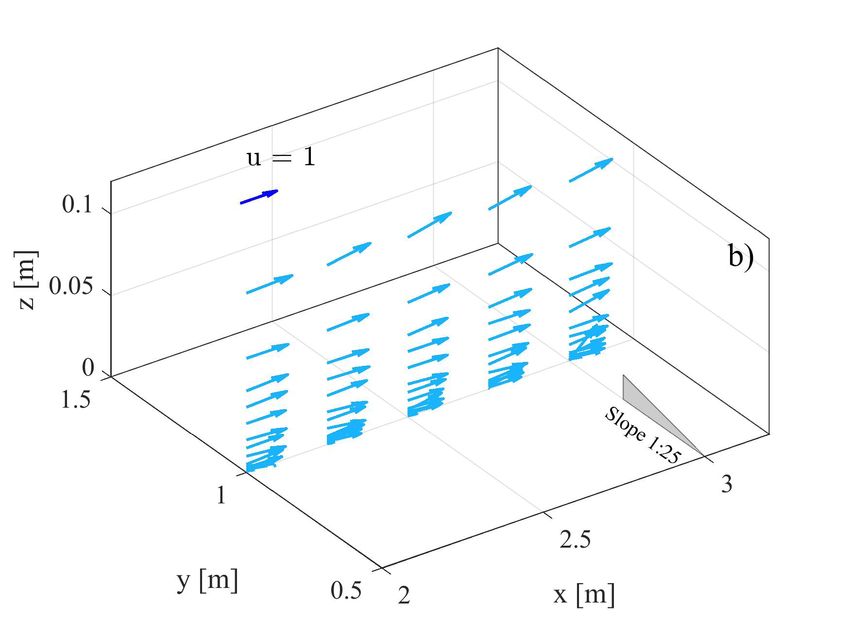
M. MARINO, C. FARACI & R. E. MUSUMECI

      ABSTRACT                                                                        have been recovered, and results compared with theoretical
          In the present work an investigation on combined wave-                      models of wave-current combined flow nonlinear interaction.
      current orthogonal flow over a planar beach is presented. A series              Results showed that for the larger wave heights none of the
      of tests have been carried out in an experimental tank, in which a              models has been able to reconstruct properly the observed
      wavemaker coupled with a flow recirculation system allows the                   velocity profile, whereas for smaller wave heights most of the
      superposition of an oscillatory flow over an orthogonal steady                  models are in good agreement with the observations. Faraci
      current. Waves and current interact over a fixed smooth bed                     et alii (2018) gathered near-bed velocity statistics of WCI at
      with a 1:25 sloping profile. Current only and wave plus current                 a right angle over different roughness elements: sand, gravel
      tests have been performed, during which surface elevation and                   and ripples. Probability density function of near-bed velocities
      velocity profiles measurements have been recovered. Velocity                    showed a Gaussian distribution for current only case, whereas
      measurements have been carried out at different positions in                    a double peak distribution is observed in the combined flow.
      the tank in order to investigate effects on the velocity profile                Characteristics of the double peak is strictly related to the wave
      determined by presence of the sloping bottom at different                       kinematics such as wave steepness and relative water depth. An
      depths. Results of current only tests showed that a satisfactory                investigation on turbulent flow was also carried out, showing
      steady current is achieved within the tank, although presence                   an alteration of near-bed high order velocity statistics, such as
      of a minor recirculation effect determines a mean flow to arise                 skewness and kurtosis, exerted by oscillatory flow on current.
      in the direction orthogonal to the current. Superposition of                    Slight differences between the different bed roughnesses have
      waves determines a mean momentum transfer on current, which                     been observed. Lim & Madsen (2016) investigated WCI with
      results in an increased current velocity and a reduction of the                 different angles of attack (60°, 90° and 120°) over a ceramic
      recirculation effect.                                                           marble bottom, and compared the velocity profile at the bottom
                                                                                      boundary layer with the one modeled by the Grant & Madsen
      Keywords: nonlinear waves, wave-current interaction, nearshore current,         (1979) model (GM). Results showed that, when as the angle
      sediment transport                                                              between wave and current directions increases, the GM model
                                                                                      tend to over-predict wave influence on current. Moreover,
      INTRODUCTION                                                                    presence of nonlinear components in the wave motion may
           Waves and currents are generally simultaneously present                    induce a veering of the current from its main direction due to
      in coastal and estuarine environments (Svendsen, 2006;                          turbulence asymmetry.
      Stancanelli et alii, 2018; Viviano et alii, 2018, Stancanelli et                     Despite the amount of effort in investigating WCI, the
      alii, 2020). The hydrodynamics of wave-current combined flow                    phenomenon is not yet well understood and some critical issues
      drives important coastal processes, such as sediment transport.                 remain. First, experimental data of WCI at a right angle are
      A fairly amount of experimental investigations on wave-current                  scarce, thus most of the existing models have been validated
      interaction (WCI) has been carried out in the last decades with                 by means of collinear WCI experimental data. This resulted in
      waves and current propagating in the same or opposite directions                a directional insensitivity and an incorrect estimation of bottom
      (Kemp & Simons, 1983; Mathisen & Madsen, 1996; Lodahl                           shear stresses of these models. Moreover, presence of coastal
      et alii, 1998) or with currents generated by wave breaking                      hydrodynamics processes related to a depth varying bottom
      (Sancho et alii, 2001; De Serio & Mossa, 2013). Although                        which induce large nonlinearities (Marino et alii, 2018), have
      in the near-shore WCI usually occurs with a near-orthogonal                     not been investigated extensively in the context of WCI at a
      angle of attack, experimental data on WCI at a right angle are                  right angle.
      relatively limited, probably due to difficulties in the physical                     The present work investigates WCI at a right angle over a
      modeling. Musumeci et alii (2006) investigated orthogonal                       sloping bed by means of a laboratory investigation in a wave tank.
      WCI over sand and gravel bottoms in a 3D tank, showing                          The work focuses on the issues encountered in the development
      that an oscillatory flow out of phase with respect to the wave                  of the experimental setup, and on the correct reconstruction of
      velocity is observed in the current direction in the presence of                the WCI hydrodynamics over a sloping profile in a laboratory
      the combined flow. Faraci et alii (2008) investigated combined                  environment, about which few studies exist (Marino et alii,
      waves and currents over flat bed and fixed ripples through                      2020). The flow is analyzed at different locations of the tank
      numerical and laboratory tests. Results showed that presence                    with different water depth, in order to observe how the flow
      of ripples act as a macroroughness, inducing turbulence to                      field is altered by the presence of the slope at different depths.
      intensify and current apparent roughness to increase. Fernando                  Surface elevation and 3D velocity measurements have been
      et alii (2011) carried out experiments of WCI at a right angle in               recovered by means of resistive wave gauges and an Acoustic
      a wave basin over movable bed, from which bed shear stresses                    Doppler Velocimeter respectively.

100   Italian Journal of Engineering Geology and Environment, 1 (2020)    © Sapienza Università Editrice                            www.ijege.uniroma1.it
AN EXPERIMENTAL SETUP FOR COMBINED WAVE-CURRENT FLOW INTERACTING AT A RIGHT ANGLE OVER A PLANE BEACH
The paper is organized as follows: in the first section Test Regime x [m] y [m] h [m] H [m] T [s]
the experimental setup, plan and procedure are described in 1 CO 2.00 1.00 0.26 - -
detail along with the velocity data treatment, in the second 2 CO 2.25 1.00 0.26 - -
Line (x)
section results from the velocity data analysis are discussed. A 3 CO 2.50 1.00 0.26 - -
concluding section closes the work. 4 CO 2.75 1.00 0.26 - -
5 CO 3.00 1.00 0.26 - -
6 CO 2.50 0.50 0.28 - -
EXPERIMENTS
Line (y)
7 CO 2.50 1.00 0.26 - -
An experimental campaign in a wave tank (18.00 x 3.40 x
8 CO 2.50 1.50 0.24 - -
1.00 m) at the Hydraulics Laboratory of the University of Catania
9 CO 2.50 2.00 0.22 - -
(IT) has been carried out. The top view of the experimental tank
Pattern
10 CO 2.25 1.00 0.26 - -
is shown in Figure 1. 11 CO 2.50 1.50 0.24 - -
Cross
12 CO 2.50 1.00 0.26 - -
13 CO 2.50 0.50 0.28 - -
14 CO 2.75 1.00 0.26 - -
15 WC 2.25 1.00 0.26 0.085 1.0
16 WC 2.50 1.50 0.26 0.085 1.0
Cross
17 WC 2.50 1.00 0.26 0.085 1.0
18 WC 2.50 1.50 0.24 0.085 1.0
19 WC 2.75 1.00 0.28 0.085 1.0
Tab. 1 - Experimental plan: number of tests, wave-current regime, ADV
positions and patterns and wave conditions.
Mean current velocity U is equal to 0.11 m/s for all tests, regular
wave characteristics are: wave height H = 0.085 m and wave
period T = 1.0 s. The list of the experiments is shown in Table 1.
Fig. 1 - Experimental wave-current tank.
Test duration is 10 minutes.
At the offshore end of the tank, a flap-type wavemaker allows For every test the ADV is deployed in a different position in
the generation of regular waves; at the onshore end a coarse the tank in order to follow a specific pattern. In tests 1-5 the flow
material beach acts as a wave reflection passive absorber. A regime is CO and velocity measurement positions follow a line
recirculation system generates a steady current, which crosses the pattern parallel to the x direction, thus every test has a different
wave field at a right angle. The current is conveyed into the tank x (= 2.00 ÷ 3.00 m) and same y (= 1.00 m) and h (= 0.26 m). In
by an 11.0 kW submerged pump, with a maximum discharge of tests 6 - 9 the wave-current regime is CO, velocity measurement
0.25 m3/s; it flows within a series of channels and comb filters in positions are chosen in order to follow a line pattern parallel to
order to dampen turbulence. The flow enters the flume crossing the y direction, thus every position have a different y (= 0.50 ÷
through a 2.5 m wide current inlet and flows out through a 2.5 m 2.00 m) and consequently a different h (= 0.22 ÷ 0.28 m), as y is
outlet mirrored to the inlet section. the direction of the increasing slope, and same x (= 2.50 m).
Waves are generated over a horizontal bottom (water depth In tests 10-14 the regime is CO and velocity measurement
h = 0.30 m) and then shoal on a 1:25 fixed planar beach. Surface positions are located as to follow a cross pattern, with a central
elevation is measured by means of 5 resistive wave gauges position (x = 2.50 m and y = 1.00 m), two positions with same y
(WG), with one WG located in the proximity of the wave maker, but different x (x = 2.50 ± 0.25 m, y = 1.00 m) and two positions
and 4 WG right behind the start of the slope; wave reflection is with same x but different y (x = 2.50 m, y = 1.00 ± 0.50 m). In
computed through the 4-probes method by Faraci et alii (2014). WC tests 15-19 the ADV positions are the same of tests 10 - 14,
Velocity measurements are gathered by means of a Nortek with a wave height H = 0.01 m and a wave period T of 1.0 s. ADV
Vectrino Acoustic Doppler velocimeter (ADV), which measured positions during the tests are reported in Table 1.
velocities u*, v* and w* in the x (current-), y (wave-) and z (vertical Velocity data are treated in order to remove spikes and outliers
upward-) direction respectively, where the * denote dimensional determined by electrical noise or temporary lack of seeding
quantity. The resolution of the ADV is 0.001 m/s, the accuracy is particles that prevents acoustic reflection to occur. Signal with
± 0.5% of the measured value. Sampling frequency is 50 Hz for signal-to-noise ratio less than 10 and correlation less than 70% are
the WGs and 100 Hz for the ADVs. removed and then replaced by means of a cubic polynomial fitting
Experiments in the presence of current only (CO) and waves of the remaining local data. Velocity measurements are treated
plus current (WC) have been carried out, for a total of 19 tests. in order to remove spikes with Goring & Nikora (2002) phase-
Italian Journal of Engineering Geology and Environment, 1 (2020) © Sapienza Università Editrice www.ijege.uniroma1.it 101M. MARINO, C. FARACI & R. E. MUSUMECI
space despiking method, which are removed and then replaced by analysis is an indirect technique to observe flow resistance
means of cubic polynomial fitting. Average amount of replaced determined by bottom shear stresses, which computation is
data is 15% (± 4%) of the original time series. Regarding wave extremely important in the study of sediment transport (Musumeci
plus current experiments, velocity and wave height measurements et alii, 2018) and the characterization of the hydrodynamic
are phase-averaged in order to obtain phase-averaged quantities flow field in general. Figure 3a shows the dimensionless time-
of interest and to carry out a phase analysis. averaged u =u̅ /U and v = v̅ /U velocity profiles, where u̅ and v̅
The number of wave cycles used within the computation are the time - averaged dimensional velocities in the current and
of the ensemble averaged wave is 600, fairly larger than the wave direction respectively for tests 1 - 5 (CO), Figure 3b shows
50 wave cycles minimum recommended by Sleath (1987) to the three-dimensional representation of u, v and w for the same
compute phase-averaged wave quantities. Figure 2 shows the tests. Within these tests y remain constant (y = 1.00 m) whereas x
phase-averaged wave surface elevation for Test 17 measured in is different (x = 2.25 ÷ 2.75 m), thus the positions of the ADV are
correspondence of the flat bottom (x = 1.70 m, y = -1.00 m). aligned in the x direction, thus the local depth h is constant and is
The maximum standard deviation is observed in equal to 0.26 m.
correspondence of the wave crest and is equal to ±0.0058 m,
corresponding to 6% of the wave height. Average standard
deviation at the wave crest for all the tests is 6%, with a maximum
of 15% for test 19. Wave peak period satisfactorily corresponds
to the target of 1.0 s, with an average deviation of 2% and a
maximum of 4% for test 19. Parameters h/gT2 and H/gT2 have
been computed in order to characterize the generated wave field
(Dean, 1970). In correspondence of the flat bottom (h = 0.3 m),
average shallowness parameter for all tests is 0.030 whereas
average nonlinear parameter is 0.012, therefore generated waves
can be considered highly nonlinear waves in intermediate depth,
in the range of validity of Stokes 5th order wave theory, relatively
close to the wave breaking limit (H/h ≈ 0.8). In the acquisition
area shallowness parameter ranges from to 0.028 to 0.024 as
depth decreases along the bed slope, therefore wave shoaling is
expected, although never reaching the wave breaking limit.
RESULTS
In the present section the results of the time-averaged velocity
profile data analysis are presented and discussed. Velocity profile
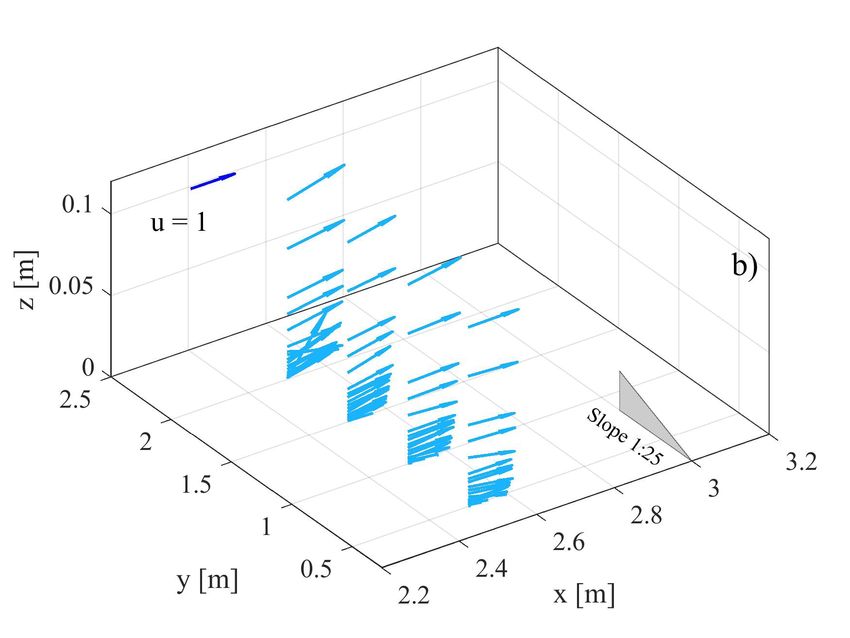
Fig. 3 - Dimensionless time-averaged velocity vertical profiles in the
current direction (u, circles) and in the wave direction (v,
squares) with same y and different x (shades of grey) (a), and
the three-dimensional representation of u, v and w with their
position in the tank (b) for tests 1-5 (current only). Local depth
Fig. 2 - Phase-averaged wave surface elevation for test 17. h = 0.26 for all tests.
102 Italian Journal of Engineering Geology and Environment, 1 (2020) © Sapienza Università Editrice www.ijege.uniroma1.itAN EXPERIMENTAL SETUP FOR COMBINED WAVE-CURRENT FLOW INTERACTING AT A RIGHT ANGLE OVER A PLANE BEACH
Figure 3a shows that along y = 1.00 m all the velocity profiles induced by the presence of a slower current downstream of the
present a quite similar behavior, for both u and v. No noticeable outlet, prompting the flow to be partly conveyed upward.
mean flow in the y direction is observed, showing that a steady Figure 4a shows the time-averaged u and v velocity profiles,
unidirectional current in the x direction is satisfactorily achieved. while Figure 4b shows the three-dimensional representation of u,
Velocity peaks are observed in the proximity of the bed for both v and w for tests 6-9 (current only). Within these tests x remain
u and v. Here, likely, the sampling volume of the ADV partially constant (x = 2.50 m) while y is different (y = 2.00 ÷ 3.00 m),
crosses the bottom plane, in this case the velocity measurement thus the positions of the ADV are aligned in the current direction.
is considered unreliable. Figure 3b shows a slight constant Local depth h ranges from 0.28 m (test 6) to 0.22 m (test 9).
mean flow in the upward z direction. This could be explained by Figure 4a shows that as the local depth decreases in the y
the presence of a slight tilt, i.e. an incorrect inclination of the direction, velocity in the current direction gradually increases
velocimeter, which may be not perfectly vertical and determine along the water column. Indeed, as the height of the inflow /
the current flow to be read along the z direction, thus the ADV is outflow section decreases in the y direction, velocity increases in
measuring a component of u in w. Another possible explanation the y direction to preserve mass continuity. However, profile at h
could be that the proximity of the outlet may determine an effect = 0.24 m seems not to follow this behavior, showing a velocity
decrease with respect to the profile at h = 0.26 m. This could
be due to the presence of a recirculation flow in the shoreward
direction, although no mean flow in the y direction is observed
at the same position. Figure 4b shows the presence of the mean
upward flow as already observed in Figure 3b.
Figure 5a shows the dimensionless time-averaged u and
v velocity profiles, while Figure 5b reports the top-view of the
3D velocity field for tests 10-14 (current only). Within these
tests the ADV positions follow a cross pattern, as described in
Section 2. In Figure 5a the marker indicates the y coordinate, the
line type indicates the x coordinate. Figure 5b shows a different
perspective (top view) with respect to the one shown in Figure 3b
and 4b. In the cross pattern, the position closer to the wavemaker
is also called “seaward position” (y = 0.50 m, h = 0.28 m), the
position closer to the gravel beach (y = 1.50 m, h = 0.24 m) is
called “shoreward position”, the three positions in the middle (y
= 1.00 m, h = 0.26 m) are called “central positions”.
Figure 5a shows that the u profiles at the central positions
(square marker), in comparison with the seaward position
(downward triangle marker, dashed line), show a larger depth-
averaged velocity determined by the continuity effect already
observed in Figure 4a. Figure 5a also shows that the shoreward
u profile (upward triangle marker, dashed line) do not follow this
behavior, showing instead a decreased velocity. As observed in
tests 6-9, the presence of the recirculation region may determine
the flow to be conveyed in the shoreward direction. Velocity
profiles of v in Figure 5a show the presence of a mean flow at
the shoreward position along the wave direction, although only
for the lower part of the profile. Figure 5b shows the effect of the
recirculation at the shoreward position, although less visible than
in the velocity profiles.
Fig. 4 - Dimensionless time-averaged velocity vertical profiles in the Figure 6a shows the time-averaged u and v velocity profiles,
current direction (u, circles) and in the wave direction (v, while Figure 6b and the top-view of the 3D velocity field for tests
squares) with same y and different x (shades of grey) (a), and
15-19 (wave plus current). Within these tests the ADV positions
the three-dimensional representation of u, v and w with their
position in the tank (b) for tests 6-9 (current only). Local depth follow the same cross pattern as tests 10-14, but with combined
h ranges from 0.22 m to 0.28 m. waves and current. Figure 6a shows that, in comparison with the
Italian Journal of Engineering Geology and Environment, 1 (2020) © Sapienza Università Editrice www.ijege.uniroma1.it 103M. MARINO, C. FARACI & R. E. MUSUMECI
Fig. 6 - Dimensionless time-averaged velocity vertical profiles in the
Fig. 5 - Dimensionless time-averaged velocity vertical profiles in the current direction (u) and in the wave direction (v) with different
current direction (u) and in the wave direction (v) with different x (line) and y (markers) (a) and the top-view of the 3D velocity
x (line) and y (markers) (a), and the top-view of the 3D velocity field (b) for tests 15-19 (wave plus current). Local depth h
field (b) for tests 10-14 (current only). Local depth h ranges ranges from 0.28 (test 15) m to 0.22 m (test 19). Wave height H
from 0.28 (test 10) m to 0.22 m (test 14). = 0.01 m, T = 1.0 s.
current only case, u velocity profiles at the central and seaward CONCLUSIONS
positions present a velocity increase. In the present work an experimental investigation on
This suggests that the superimposed oscillatory flow wave-current combined flow interacting at a right angle over a
determines a transfer of mean momentum to the flow in the sloping planar beach has been carried out. The work aimed at
current direction. This transfer is sufficiently large to reduce the investigating the complex interaction between wave and current
current deviation in the shoreward direction determined by the over a varying water depth. Here the focus is on the hydrodynamic
recirculation region at the shoreward position. Moreover, profiles characterization of the experimental setup. This is fundamental to
of v in Figure 6a show a mean flow in the seaward direction, which correctly interpret the experimental data.
may be determined both by the recirculation effect and by the Experiments have been conducted in a wave-current tank,
presence of a wave-generated undertow current determined by the where an oscillatory motion is generated by a wavemaker and it
presence of the sloping bed. Figure 6b shows, in comparison with is superimposed to a steady current generated at a right angle with
the current only case shown in Figure 5b, the velocity increase respect to the wave direction of propagation.
observed in Figure 6a. Deviation of the flow is observed in the Surface elevation and 3D velocities have been recovered
seaward direction in Figure 5a, at both seaward and shoreward by means of 5 resistive wave gauges and an Acoustic Doppler
positions, which confirms the presence of the undertow current. Velocimeter. Experiments have been carried out in both current
104 Italian Journal of Engineering Geology and Environment, 1 (2020) © Sapienza Università Editrice www.ijege.uniroma1.itAN EXPERIMENTAL SETUP FOR COMBINED WAVE-CURRENT FLOW INTERACTING AT A RIGHT ANGLE OVER A PLANE BEACH
only and wave plus current conditions. Results for current only investigations should focus on: (i) the current turbulent field and
tests showed that a satisfactory unidirectional steady current is how this is altered by the presence of wave motion; (ii) how to
achieved in the experimental tank. A recirculation phenomenon deal with or to reduce recirculation effects; (iii) shoaling effects
arises farther from the central axis of the inflow/outflow section, and presence of nonlinear components and how they affect the
determining the flow to be directed along or opposite to the wave steady current.
direction. Superposition of waves determined a velocity increase
of the current, which suggests a transfer of mean momentum from ACKNOWLEDGEMENTS
the wave motion to the steady current. The transfer of momentum This work has been partly funded by the EU funded project
is sufficient to oppose the recirculation effect in the shoreward HYDRALAB PLUS (proposal number 654110), by the project
direction. Veering in the y direction opposite to the direction “news - Nearshore hazard monitoring and EarlyWarning
of waves suggest the presence of an undertow triggered by the System” (code C1-3.2-60) in the framework of the programme
presence of the slope. INTERREG V-A Italia Malta 2014-2020, by University of
The presented experimental setup is a promising device Catania funded projects “Interazione onde correnti nella regione
that can properly generate an oscillatory motion superimposed costiera (inocs)”, “Piano triennale della Ricerca 2016-18” and by
to an orthogonal steady current over a plane beach. Further POR SICILIA FSE (CCI: 2014IT05SFOP014).
REFERENCES
De Serio F. & Mossa M. (2013) - A laboratory study of irregular shoaling waves. Experiments in fluids, 54 (6): 1536.
Dean R. G. (1970) - Relative Validiy of water Wave Theories. J. Waterways Harbors Div., ASCE, 96 No. WW1: 105 - 119.
Faraci C., Scandura P., Musumeci R. E. & Foti E. (2018) - Waves plus currents crossing at a right angle: near-bed velocity statistics. Journal of Hydraulic
Research, 1686, 1–18. https://doi.org/10.1080/00221686.2017.1397557.
Faraci C., Scandura P. & Foti E.(2015) - Reflection of sea waves by combined caissons. Journal of Waterway, Port, Coastal, and Ocean Engineering, 141: 1 -
12. https://doi.org/10.1061/(ASCE)WW.1943-5460.0000275.
Fernando P. C., Guo J. & Lin P. (2011) - Wave-current interaction at an angle 2: Theory. Journal of Hydraulic Research, 49 (4): 424 - 436. https://doi.org/10.1
080/00221686.2010.547036.
Fernando P. C., Guo J. & Lin P. (2011) - Wave-current interaction at an angle 1: Experiment. Journal of Hydraulic Research, 49 (4): 424 - 436. https://doi.org
/10.1080/00221686.2010.547036.
Goring D. G.,& Nikora V. I. (2002) - Despiking Acoustic Doppler Velocimeter Data. 128: 117 - 126.
Grant W. D. & Madsen O. S. (1979) - Combined wave and current interaction with a rough bottom. Journal of Geophysical Research: Oceans, 84 (C4): 1797
- 1808. https://doi.org/10.1029/JC084iC04p01797.
Kemp P. H. & Simons R. R. (1983) - The interaction of waves and a turbulent current: waves propagating against the current. Journal of fluid mechanics, 130:
73 - 89.
Lim K. Y. & Madsen O. S. (2016) - An experimental study on near-orthogonal wave-current interaction over smooth and uniform fixed roughness beds. Coastal
Engineering, 116: 258 - 274. https://doi.org/10.1016/j.coastaleng.2016.05.005.
Lodahl C. R., Sumer B. M. & FredsØe, J. (1998) - Turbulent combined oscillatory flow and current in a pipe. Journal of Fluid Mechanics, 373: 313 - 348. https://
doi.org/10.1017/S0022112098002559.
Marino M., CÀceres Rabionet,I., Musumeci R.E. & Foti E., (2018) - Reliability of pressure sensors to measure wave height in the shoaling region. Proceedings
of the 36th International Conference on Coastal Engineering, ICCE 2018; Baltimore; United States; 30 July 2018 through 3 August 2018; Code 152266.
DOI: 10.9753/icce.v36.papers.10.
Marino M., Musumeci R. E. & Faraci C., (2020) - Shoaling waves interacting with an orthogonal current. Journal of Marine Science and Engineering, 8 (4),
281. https://doi.org/10.3390/jmse8040281.
Mathisen P. P. & Madsen O. S. (1996) - Waves and currents over a fixed rippled bed 2. Bottom and apparent roughness experienced by currents in the presence
of waves. Journal of Geophysical Research: Oceans, 101(C7): 16543 - 16550.
Musumeci R. E., Cavallaro L., Foti E., Scandura P. & Blondeaux P. (2006) - Waves plus currents crossing at a right angle: Experimental investigation. Journal
of Geophysical Research: Oceans, 111 (7). https://doi.org/10.1029/2005JC002933.
Musumeci R. E., Marletta V., Sanchez-Arcilla,A. & Foti E. (2018) - A ferrofluid-based sensor to measure bottom shear stresses under currents and waves.
Journal of Hydraulic Research, 56 (5): 630 - 647. doi:10.1080/00221686.2017.1397779.
Sancho F., Mendes, P. A., Carmo J. A., Neves M. G., Tomasicchio G. R., Archetti R., Damiani L., Mossa M., Rinaldi,A., Gironella X. & Sanchez-Arcilla A.
(2002) - Wave hydrodynamics over a barred beach. In Ocean Wave Measurement and Analysis, 1170 - 1179).
Sleath J. F. A. (1987). Turbulent oscillatory flow over rough beds. Journal of Fluid Mechanics, 182: 369 - 409.
Italian Journal of Engineering Geology and Environment, 1 (2020) © Sapienza Università Editrice www.ijege.uniroma1.it 105M. MARINO, C. FARACI & R. E. MUSUMECI
Svendsen I. A. (2006) - Introduction to nearshore hydrodynamics (24) World Scientific.
Stancanelli L. M., Musumeci R. E. & Foti E. (2018) - Dynamics of gravity currents in the presence of surface waves. Journal of Geophysical Research: Oceans,
123 (3): 2254 - 2273. doi:10.1002/2017JC013273.
Stancanelli L. M., Musumeci R. E., Stagnitti M. & Foti E. (2020) - Optical measurements of bottom shear stresses by means of ferrofluids. Experiments in
Fluids, 61 (2): 52.
Viviano A., Musumeci R. E. & Foti E. (2018) - Interaction between waves and gravity currents: Description of turbulence in a simple numerical model.
Environmental Fluid Mechanics, 18 (1): 117 - 148.
Received September 2019 - Accepted January 2020
106 Italian Journal of Engineering Geology and Environment, 1 (2020) © Sapienza Università Editrice www.ijege.uniroma1.itPuoi anche leggere