ENVIRONMENTAL AND ENERGETIC IMPLICATIONS OF THE GEOTHERMAL ANOMALIES IN THE EASTERN PO PLAIN
←
→
Trascrizione del contenuto della pagina
Se il tuo browser non visualizza correttamente la pagina, ti preghiamo di leggere il contenuto della pagina quaggiù
DOI: 10.4408/IJEGE.2021-01.S-18

ENVIRONMENTAL AND ENERGETIC IMPLICATIONS OF THE GEOTHERMAL
              ANOMALIES IN THE EASTERN PO PLAIN

                                                Dimitra Rapti(*,**) & Riccardo Caputo(*,**)

                        (*)
                              New Energies and Environment, spinoff company of Ferrara University - via Saragat, 1- 44122 Ferrara, Italy
                                                (**)
                                                     University of Ferrara - Department of Physics and Earth Science
                                                             Corresponding author: rapti@nea-team.com

Extended abstract
     La ricerca presentata in questa nota vuole contribuire alla caratterizzazione delle risorse geotermiche a bassa e media entalpia esistenti
nel più ampio territorio ferrarese-modenese, in Italia settentrionale. Per il raggiungimento dell’obiettivo, è stato adottato un approccio
metodologico suddiviso in più fasi. In primo luogo, sono stati analizzati i dati di temperatura misurati durante la perforazione di pozzi
profondi per l’esplorazione di idrocarburi (Fig. 1). Sulla base di queste informazioni è stato possibile stimare i parametri termofisici del
sottosuolo a diverse profondità. A questo proposito è stata fondamentale un’analisi preliminare atta a discriminare l’influenza dei fluidi di
circolazione (utilizzati durante le operazioni di perforazione) sulle misure di temperatura in simili contesti sperimentali. A tal fine sono stati
quindi applicati diversi approcci metodologici per stimare i valori reali di temperatura delle rocce circostanti. In questo modo, per ogni
pozzo sono stati ricavati i profili di temperatura versus la profondità. In secondo luogo, sono stati attentamente analizzati diversi profili
di sismica a riflessione profonda eseguiti dall’ENI per l’esplorazione di idrocarburi. Tali profili consentono di ricostruire in profondità le
principali unità litologiche e l’assetto tettonico generale. In particolare, su tali profili sono state tracciate le temperature corrette dei pozzi
(Fig. 4) e ciò ha consentito l’interpolazione delle distribuzioni di temperatura in profondità e la ricostruzione di alcune principali isoterme
lungo i profili. A seguito di questo passaggio, è stato possibile enfatizzare la variabilità del gradiente termico, sia verticale che laterale (Fig.
6). In terzo luogo, per una migliore valutazione del possibile impatto ambientale e per stimare l’influenza dei fluidi geotermici profondi
sulle caratteristiche geochimiche delle acque sotterranee, sono stati analizzati dei dati isotopici e idrochimici (ottenuti da misurazioni di
pozzo e log di temperatura) relativi ai sistemi acquiferi confinati A1 e A2 (Fig. 2). Tali dati hanno messo in evidenza l’assenza di una
comunicazione idraulica diretta tra i fluidi geotermici e gli acquiferi. Infine, l’analisi integrata di tutti i dati suggerisce chiaramente che le
variazioni di temperatura, sia orizzontali che verticali, sono una diretta conseguenza dell’evoluzione geologica, idrogeologica e tettonica
del settore orientale della Pianura Padana. Proprio la mappatura di tali variazioni laterali permette di riconoscere le aree ad alto potenziale
geotermico (Fig. 5). L’analisi dei gradienti geotermici ottenuti suggerisce chiaramente che la conduttività termica (cioè il flusso conduttivo)
da sola non potrebbe giustificare tali variazioni verticali. D’altra parte, queste variazioni potrebbero essere attribuite all’instaurarsi di
flussi convettivi che interessano principalmente le rocce carbonatiche del Mesozoico (Fig. 6), generando quindi una forte diminuzione del
gradiente geotermico attraverso queste unità e un aumento nei depositi sovrastanti (Fig. 4). Questo modello termico potrebbe ovviamente
funzionare solo nel caso in cui in profondità sia presente una fonte di calore e una sufficiente permeabilità tali da consentire la circolazione
verso l’alto dei fluidi più profondi. Da un punto di vista ambientale, i dati geochimici analizzati suggeriscono che i serbatoi geotermici e
il loro sfruttamento non hanno interazioni con le falde acquifere poco profonde. Di conseguenza, il serbatoio a 1000-2000 m di profondità
potrebbe essere considerato idraulicamente isolato dai sistemi acquiferi A1 e A2. In altre zone, come ad esempio nella area vicino al pozzo
Marrara, ad una profondità di circa 400 m, dove il calore si trasmette per convezione e la temperatura raggiunge circa 35-40°C, il sottosuolo
potrebbe essere sfruttato per il riscaldamento urbano attraverso un sistema a circuito chiuso. Come ultimo commento, va sottolineato che
la presenza di un gradiente geotermico ‘normale’ potrebbe comunque consentire lo sfruttamento delle risorse geotermiche a bassa entalpia
praticamente su tutta l’area indagata e probabilmente su gran parte della Pianura Padana.

Italian Journal of Engineering Geology and Environment, 1 (2021)           © Sapienza Università Editrice                                  www.ijege.uniroma1.it   195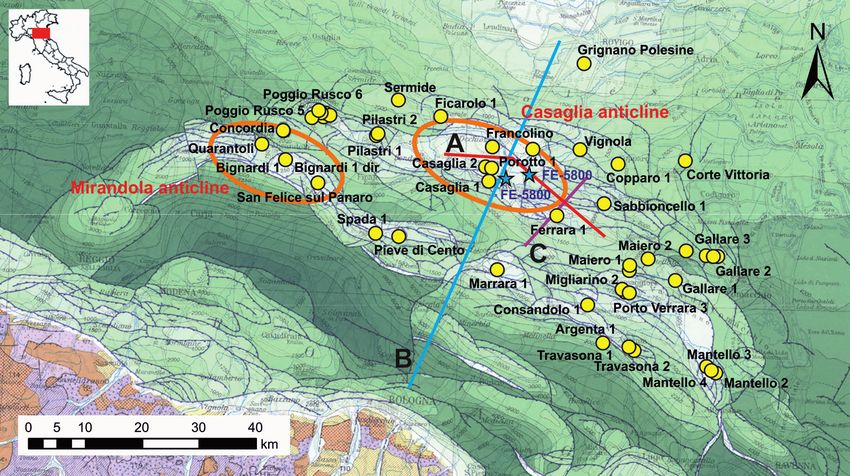
D. Rapti & R. caputo

      Abstract                                                                        environmental, economic, societal, and health benefits. In general,
          The present research is devoted to contributing on the                      the geothermal resources, by their reservoir temperatures, have
      characterization of the low-to-medium enthalpy geothermal                       been classified into high, medium and low (or shallow) enthalpy
      resources existing in the broader Ferrara-Modena territory,                     resources. However, the average reservoir temperature is used as
      Northern Italy. To achieve the goal, first, we analysed                         the classification parameter because it is considered as one of the
      temperature data in selected deep boreholes to estimate the                     simplest parameters. In Tab. 1, some of these classifications are
      local thermophysical parameters of the underground. In order                    presented.
      to discriminate the influence of the circulation fluids and then                     Also based on temperature, Sanyal (2005) has classified
      estimate the real temperature values of the surrounding rocks, we               the geothermal resources into seven categories focusing on the
      applied different methodological approaches. Secondly, different                prevailing/possible use by the geothermal developer: non-electrical
      deep seismic reflection profiles for hydrocarbon exploration were               grade ( SEI > 0,05) and low exergy resources
      and especially to recognize the area with a highest geothermal                  (SEI ≤ 0,05).
      potential within the region.                                                         In the EU, civil buildings are responsible for about the 36% of
                                                                                      CO2 emissions and the 40% of energy consumption, while as much
      Keywords: geothermal anomalies, aquifers, Po Plain                              as the 35% of the buildings are older than 50 years and almost 75% of
                                                                                      them are not energetically efficient (http://www.efficienzaenergetica.
      Introduction                                                                    enea.it/allegati/RapportoDirettiva2018_844.pdf). Moreover, based on
          In the European and Integrated National Energy and Climate                  Eurostat data relative to the 2017, 8% of the European population was
      Plan possible pathways to achieve “climate neutrality” by 2050                  unable to sufficiently heat their home; while in Italy this percentage
      have been proposed. In particular, for the period 2021-2030,                    was as high as 15%. Accordingly, the exploitation of low-medium
      specific actions for the growth of renewable sources have been                  enthalpy geothermal resources can contribute to the energy transition
      identified together with the improvement of energy efficiency and               because a) it is a renewable energy source; b) by means of a district
      the reduction of greenhouse gas emissions respectively of 32%,                  heating system, it can provide both heating and cooling in large
      32.5% and 40% compared to the 1990 values. While the final goal                 residential areas; c) it can contribute to the reduction of atmospheric
      of the Energy and Climate Plan is the reduction, by the 2050,                   emissions; and d) it can contribute to the improvement of the
      of the greenhouse gas emissions over 80% with respect to the                    microclimate reducing the creation of ‘hot air bubbles’ in urban areas
      1990. Also, according to the latest report of the World Health                  during the summer season due to the use of air-to-air heat pumps.
      Organization in Global (ambient air pollution report; 09/2016) in                    Following the above considerations, with the present research,
      Western Europe, Italy has the worst air, in terms of concentrations             we want to contribute to the national energetic transition project and
      of PM2.5, while in the Po Valley the concentrations exceed the                  particularly a) to the characterization of the geothermal reservoirs
      value of 25 µg/mq.                                                              existing in the broader Ferrara-Modena territory, Northern Italy,
          In order to achieve these goals, the request, the exploitation, the         which hosts in the subsoil some major tectonic structures with a high
      use and the diffusion of renewable energies should greatly increase             geothermal potential, like for example the Casaglia and the Mirandola
      in the next future. Due to the recent evolution of technological                anticlines (Fig. 1); and b) to preliminary evaluate the environmental
      plants, like district heating, the low-to-medium enthalpy                       impact on the shallow aquifer systems, due to the presence of the
      geothermal plants could fulfil the above needs with important                   deeper high temperature fluid.

      Tab. 1 - Classification of geothermal resources by temperature

196   Italian Journal of Engineering Geology and Environment, 1 (2021)    © Sapienza Università Editrice                                www.ijege.uniroma1.it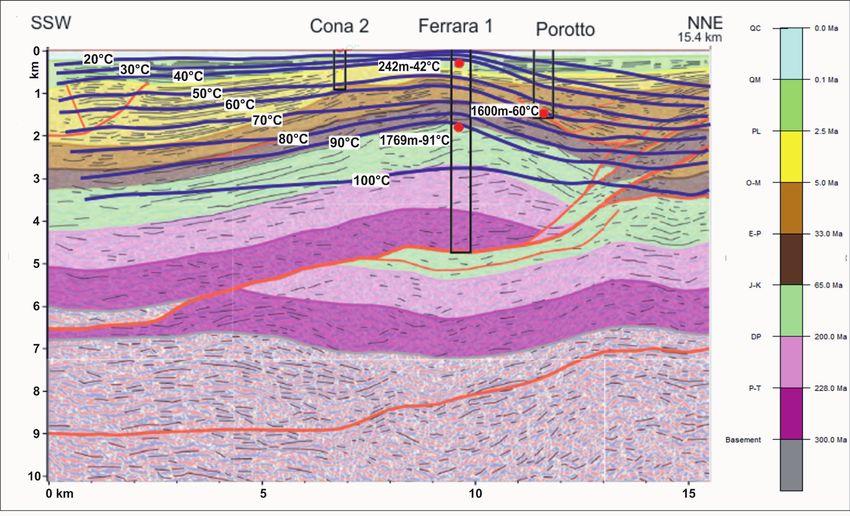
ENVIRONMENTAL AND ENERGETIC IMPLICATIONS OF THE GEOTHERMAL ANOMALIES IN THE EASTERN PO PLAIN

Fig. 1 - Study area showing the distribution of the analysed boreholes (yellow circles); hydrostratigraphic section (continuous red line; A); seismic reflection pro-
         files (continuous blue and purple lines; B and C) and shallow wells (blue asterisk). The base map is extracted from the structural model of Italy (Bigi et alii, 1990)

GEOLOGICAL SETTING                                                                          Plain. Accordingly, the competing role of the two tectonic
     Although the southern Po Plain is morphologically flat, it                             processes affecting the subsoil of the investigated area (i.e.
hosts in the subsoil the external sector of the Northern Apennines                          regional subsidence and local anticlinal uplift) together with the
fault-and-thrust belt, whose persistent tectonic activity is well                           sedimentary process generated a complex geological setting in
documented by both historical and instrumental seismicity                                   the subsoil with carbonate Mesozoic units locally at few hundred
(e.g. Caputo et alii, 2016). The buried accretionary wedge is                               meters depth relatively close to pluri-kilometre thick Neogene
partitioned in some major salients, one of which is the so-called                           clastic deposits. As we will see in the following sections, the
Ferrara Arc. The latter basically corresponds to the investigated                           consequent lithological lateral variability has a strong impact on
area. In the frame of the persisting regional shortening clearly                            the heat flow distribution across the region.
confirmed by geodetic data, contractional deformation affecting
this major tectonic feature is further partitioned in several                               HYDROGEOLOGICAL SETTING
minor-order structures (Caputo & Tarabusi, 2016), consisting                                    In the eastern Po Plain, the geometrical (thickness and lateral
of a system of low-to-medium angle reverse faults and                                       distribution), geochemical and hydrodynamic characteristics of
associated folds. In these tectonic conditions, crustal scale                               the aquifers strongly depend on the lateral and vertical facies
volumes are characterized by differential vertical movements                                variations of the sedimentary successions, which in turn are
and particularly by localized uplift in correspondence of the                               a consequence of the tectonic structures and the continuously
hanging-walls blocks and especially of the hinge areas of                                   varying depositional environments especially in the most recent
these blind faults. On the other hand, the broader geodynamic                               times. As a consequence, the Pliocene-Quaternary deposits are
setting is characterized by a regional-wide subsidence of the                               characterised by silty-muddy layers alternating with sandy and
Adria foreland undergoing subduction and the consequent                                     sometimes gravel lenses (Bortolami et alii, 1978; Regione
orogenic load on both north and south sides (i.e. Southern Alps                             Emilia-Romagna-ENI-AGIP, 1998).
and Northern Apennines, respectively). This in turn creates                                     At the regional scale, based on a hydrogeological perspective
accommodation space in this wide intermountain region,                                      of the depositional sequences during the last 4 Ma, two major
which is continuously filled by the clastic deposits of the Po                              sedimentary cycles could be distinguished (Regione Emilia-

Italian Journal of Engineering Geology and Environment, 1 (2021)               © Sapienza Università Editrice                                         www.ijege.uniroma1.it       197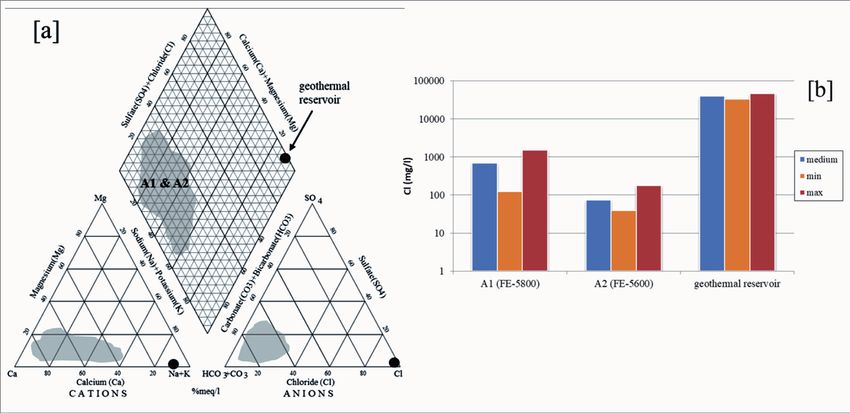
D. Rapti & R. caputo

      Fig. 2 - Synthetic hydrostratigraphic section (A1 to A4: aquifer systems; from Rapti-Caputo & Martinelli, 2009; for the position see Fig. 1)

      Romagna-Eni-Agip, 1998). They correspond to a) the deepest                            It should be noted that the salinity of aquifers and consequently
      marine Quaternary cycle (Qm; up to 0.65 Ma) containing the                       their natural chemical composition are mainly attributable to the
      aquifer group C, and b) the continental Quaternary cycle (Qc)                    different depositional environments (continental, lacustrine or
      divided into the Lower Emiliano-Romagnolo System (Qc1;                           marine) developed within the low delta Po plain. For example,
      Middle Pleistocene 650-350 ka) containing the aquifer group                      in the hinge area of the fold (Casaglia 1 borehole; Underground
      B, and the Upper Emiliano-Romagnolo System (Qc2; Middle-                         water reserves of the Emilia-Romagna Region, 1988), it is
      Holocene Pleistocene) characterized by cyclic alternations of                    possible to distinguish the Aquifer Group B and A within the
      fine-grained material (silts and clays) and coarser deposits with                first 130 m. They mainly consist of sandy material with variable
      sands and gravels texture where the aquifer group A is developed.                granulometry. In particular,
      Within the latter, the permeable intervals correspond to aquifer                 •     the top of Group B is located at a depth of 120 m and its
      systems referred to as A1, A2, A3 and A4. In the present paper, we                     thickness is about 10 m and it is saturated with fresh water;
      focus on the aquifer system A and particularly, due to the lack of a             •     the top of the aquifer system A4 is located at a depth of about
      geochemical monitoring network and the availability of borehole                        90 m, showing a thickness of about 18-20 m; it is saturated in
      data (Agip, 1977) used for the temperature and salinity analyses,                      salt/brackish water, while the total porosity varies between
      on the upper zone of the aquifer system A (A1 and A2). Figure 2                        34 and 41%;
      clearly shows the influence of the deep tectonic structures, like                •     at 70 m depth has been identified the top of the aquifer
      the Casaglia anticline, on the thickness and depth of the diverse                      system A3, saturated in fresh water with a thickness of about
      aquifer systems.                                                                       15 m. The total porosity varies between 32 and 38%;

198   Italian Journal of Engineering Geology and Environment, 1 (2021)     © Sapienza Università Editrice                                www.ijege.uniroma1.it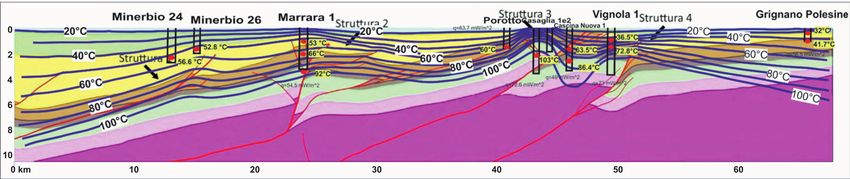
ENVIRONMENTAL AND ENERGETIC IMPLICATIONS OF THE GEOTHERMAL ANOMALIES IN THE EASTERN PO PLAIN

Fig. 3 - Eastern Po Plain basin A) synthetic representative stratigraphic column: 1) sand and sandstone, 2) clay and shale, 3) clayey and marly sand, 4)
         evaporite, 5) marl and silty shale, 6) silty and arenaceous marl, 7) argillaceous and marly limestone, 8) carbonate; B) Temperature versus depth;
         continuous and dashed lines indicate regional thermal gradient, while arrows represent likely thermal convection phenomena; C) Thermal gradients
         and thermal conductivity for each lithologic unit (λG: Gallare; λCN: Cascina Nuova borehole); standard error in brackets (from Pasquale et alii, 2013)

•    the top of the aquifer system A2 is at a depth of about 40 m                   hydrochemical data from monitoring wells near the area of the
     and its thickness is 15 m; the total porosity is between 32                    Casaglia reservoir were analysed.
     and 46%; the water electrical conductivity is about 1500 μS/
     cm and these values are likely to be attributed to the strong                  HYDROTHERMAL SETTING
     depression cones of the piezometric level caused by the                            Surface heat flux depends essentially on the concurrent role
     water extraction in the industrial area of Ferrara (30 l/s) and                of sedimentation (e.g. aggradation rate) and tectonics (fault and
     Mirabello (9 l/s) in addition to the salinization phenomena                    folds growth) phenomena. Based on numerical calculations,
     affecting the northern sector of the A2 aquifer system;                        Pasquale et alii (2012) suggested that heat-flow differences
•    at 10 m depth is the top of the aquifer complex A1 which has                   among the different tectonic units in the western Po Basin are
     a thickness of about 20 m; the total porosity is between 33 and                due mainly to tectonothermal processes that have taken place
     42%, while the water electrical conductivity is about 1000 μS/                 in the basin and the surrounding areas. By assuming a constant
     cm. The general flow direction is from NW to SE; influenced                    sedimentation rate, the same Authors applied the simplified
     by the extraction in the industrial area north of Ferrara.                     approach proposed by Von Herzen & Uyeda (1963) in order
    In order to define possible mixing phenomena due to intrusion                   to evaluate the thermal effect of the most recent and important
of the deep geothermal fluids to the shallow confined aquifers,                     deposition cycle (Pliocene-Quaternary), which strongly affected

Italian Journal of Engineering Geology and Environment, 1 (2021)        © Sapienza Università Editrice                                   www.ijege.uniroma1.it    199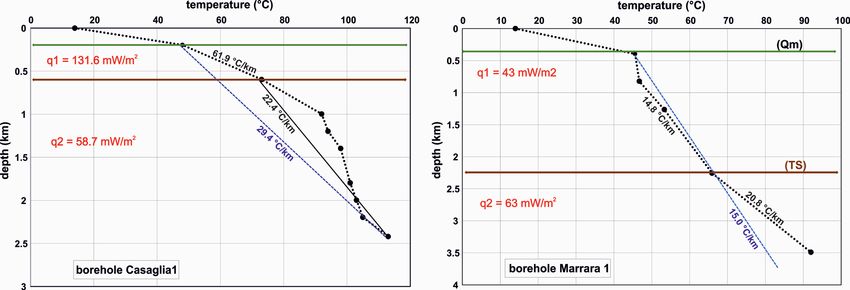
D. Rapti & R. caputo

      the Miocene formations acting as a basement; calculated that the               during the drilling operations. The difference between the
      decrease of surface heat flow is significant when sedimentation                temperature of the mud and that of the drilled host rock depends
      rate is >0.1 mm/a. In particular, the authors estimated the increase           on several factors like the borehole depth, the time required by
      of the average heat flow (about 39%) is due, above all, to the                 the muds for a complete circulation cycle, the thermal gradient,
      improved estimate of thermal conductivity, which accounts for                  the porosity of the stratigraphic units, the time lag of the
      by 24%.                                                                        measurement, fluid flow, exothermic reactions like setting cement
          Finally, the surface heat flow in the areas where heat                     and mineral oxidation (Zschocke, 2005; Lachenbruch & Brewer,
      conduction phenomena play an important role for heat                           1959, Eppelbaum & Kutasov, 2006, Raymond, 1969, Edwardson
      propagation is characterized by values in the range 54 and 78                  et alii, 1962).
      m·W/m2 (Haenel, 1974; Pasquale & Verdoya, 1990) while,                              Various temperature correction methods based on different
      lower heat flux values (
ENVIRONMENTAL AND ENERGETIC IMPLICATIONS OF THE GEOTHERMAL ANOMALIES IN THE EASTERN PO PLAIN
In case of a single temperature value, it has been proposed a (8)
correction for the temperature:
for T ≤ 137°C.
(2) The thermal conductivity and thermal diffusivity values of the
different formations were based on values proposed by Viganò et
which is also a function of depth, z (in kilometres) alii (2011) and Robertson (1988).
The total heat flux for each borehole was then calculated
(3) based on the thermal resistance (R) method, which correlates the
temperature difference between surface, T0, and depth, Td, with
Also in this case, for values of teD. Rapti & R. caputo
RESULTS and heat flow suggest that the heat flux occurs prevailingly or
The analysis of the obtained geothermal gradients clearly exclusively by means of conductive phenomena.
suggests that the thermal conductivity (viz. conductive flux) Geostatistical methods (Inverse Distance Weight) have
alone could not justify such vertical variations. On the other been then applied to define the spatial distribution of the data.
hand, these variations could be attributed to the occurrence of Due to non-homogeneous distribution of the boreholes and for
convective flows mainly affecting the Mesozoic carbonate rocks, a better representation of the processing data, within the broader
therefore generating a strong decrease of the geothermal gradient investigated area we distinguished and focused on two sub areas
across these units and an increase in the overlying deposits. This referred to as A and B, both with internal good spatial distributions
thermal model could obviously work only in case a heat source is (Fig. 5).
present at depth and a sufficient permeability allows the upwards The results of all the investigated boreholes have been plotted
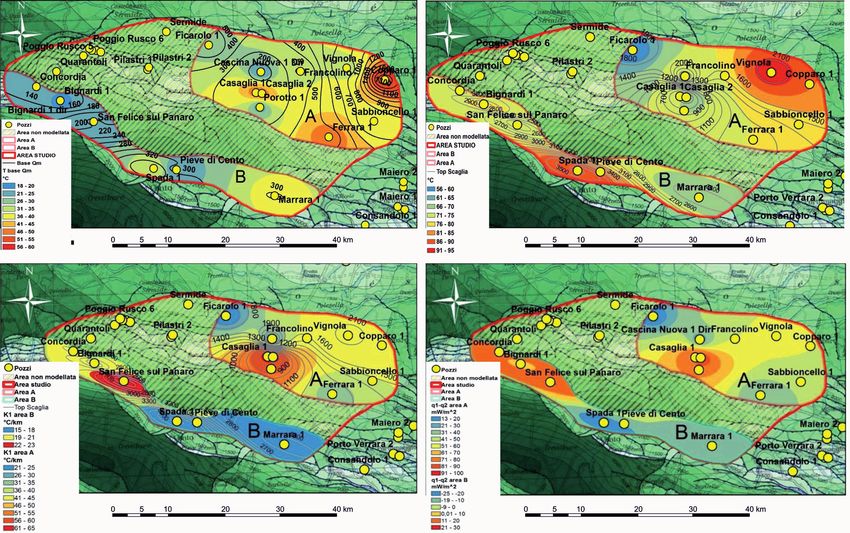
circulation of the deeper fluids. to generate thematic maps thus emphasizing (at least) the first
Accordingly, we focused our attention on the carbonate order geothermal anomalies. In particular, the data analysis
sedimentary succession, which indeed represents the geothermal allowed to observe the follow (Figure 5):
reservoirs. In particular, the heat transmission characterizing from the spatial distribution of temperatures, referred to
these rocks is a consequence of both conduction and convection the base of the marine Quaternary (Qm) and to the top of the
phenomena. Moreover, the largest differences in geothermal Scaglia formation, the influence of the stratigraphic and tectonic
gradient and heat flux characterizing successions S1 and S2 do structure is evident. At the base of the marine Quaternary
occur in correspondence with the major structural highs, like that layer, in the Ferrara and Casaglia area, a geothermal anomaly
associated to the Ferrara Thrust. For example, in the Casaglia 1 is clearly observed, with temperature values around 50 °C at a
borehole (depth: 2418 m) where the base of the marine Quaternary depth varying between 200 and 500 m, respectively; while a few
(Qm) and the top of the Scaglia Formation (TS) are at about 198 kilometres to the east (Copparo 1 borehole) the same temperature
m and 586 m depth, respectively, the temperature varies between values are located at 1650 m depth (Figure 5a). Furthermore, the
48 °C at 198 m to 113 °C at the bottom of the borehole with a spatial distribution shows that, at the top of Scaglia, at a depth of
mean slope of about 29.4 °C/km (Figure 4; dashed blue line). In about 2200-2300 m (Figure 5b), the temperature in the Vignola
particular, within S1 unit the thermal gradient and the heat flow are borehole is about 20 °C higher than that of San Felice sul Panaro
61.9 °C/km and 113.6 mW/m2, respectively; while, in the deeper (71 °C); while in other cases, similar temperature values (72-75
unit (S2) the thermal gradient and heat flow are 22.4 °C/km and °C) were calculated at depths ranging from 600 m (Casaglia 1) to
58.7 mW/m2, respectively. These values confirm the occurrence 1300 m (Ferrara 1).
and the role of the convective flow within the carbonate unit As for the geothermal gradient (K1; Fig. 5c), high
(S2) and the calculated values could be likely attributed to the values in the S1 unit can be attributed to convective motions
upwelling of fluids across the dense fracture system extending up developed at greater depths in correspondence of unit S2 or to
to shallow depths. the intrusion of geothermal fluids across the fracture systems;
In other cases, like in the Marrara 1 borehole (Figure 4), in both the latter hypothesis seems confirmed by the heat flux difference
upper units (S1 and S2), small variations of the thermal gradient map (q1-q2; Figure 5d). The lowest values of the geothermal
Fig. 4 - Example of geothermal gradients and heat flow calculated for the intervals S1 and S2 (see text for discussion)
202 Italian Journal of Engineering Geology and Environment, 1 (2021) © Sapienza Università Editrice www.ijege.uniroma1.itENVIRONMENTAL AND ENERGETIC IMPLICATIONS OF THE GEOTHERMAL ANOMALIES IN THE EASTERN PO PLAIN
Fig. 5 - Spatial distribution of a) temperature (°C) in the base of marine Quaternary deposits (Qm); b) temperature (°C) in the top of Scaglia (TS); c)
geothermal gradient (K1) in the Qm; d) differences of heat flow (q1-q2) in mW/m2. The contour lines in (a) and (b) represent the isobaths of the
base of Qm and the top of Scaglia formation, respectively
gradient observed in the southern and northern parts of the study the isotherms are denser in correspondence of the major anticlines
area, could be a consequence of the rapid sedimentation of the where the Mesozoic carbonate units have been strongly uplifted
siliciclastic series and by the absence of convective motions in as a consequence of the folding and faulting; conversely in the
the S2 unit. large synclines where the Neogene clastic sediments are thicker,
In order to better understand the distribution at depth of the the isotherms are more spaced and the thermal gradient lower.
analysed parameters, and particularly the vertical/lateral variability As above mentioned and in order to estimate the influence
of the thermal gradient, deep geological sections crossing the of the deep geothermal fluids on the groundwater geochemical
investigated area have been considered. These sections are based characteristics, we analysed isotopic and hydrochemical data
on the detailed analysis of seismic reflection profiles carried relative to the confined aquifers A1 and A2. At this regard,
out for hydrocarbon explorations, they have been carefully aquifer A1 is certainly the most explored one due to its diffuse
interpreted by means of dedicated software, stratigraphically exploitation for aqueduct purposes.
calibrated by exploiting the available boreholes and finally From the isotopic point of view, the data analysis carried out
depth converted (Allegra, 2016; Mistroni, 2016; Mastella, in the eastern territory of the Po Valley on the A1 and A2 aquifer
2018). On these sections, we plotted the boreholes temperatures systems (Rapti-Caputo, 2000; Rapti-Caputo & Martinelli,
corrected following the previously described methodological 2007; 2009) allowed to document that the 18O/16O ratio has
approaches, exploiting also the spatial distributions represented values between -10.86 and -7.44; while the D/H isotope ratio
in Figure 5. Based on these constraints, some principal isotherms shows values between -72.79 and -48.99. The waters of the A2
have been reconstructed and traced along the profiles. aquifer appear to be characterized by the most negative values
In Figure 6 are shown two geological profiles interpreted in in δ18O, documenting an age greater than 20,000 years and in
terms of geothermal gradients. Both examples clearly show that general greater than those found in the first confined aquifer (A1).
Italian Journal of Engineering Geology and Environment, 1 (2021) © Sapienza Università Editrice www.ijege.uniroma1.it 203D. Rapti & R. caputo
Fig. 6 - Lateral and vertical variations of the geothermal gradient emphasized by the isothermal distribution along two geological sections reconstructed
from seismic reflection profiles for hydrocarbon exploration. Top and bottom sections from Mistroni (2016) and Allegra (2016), respectively (for
the position see Fig. 1)
All values are aligned along a straight line analytically expressed systems, the Ca-HCO3 water type generally prevails, while the
by the equation: waters from the deep geothermal reservoir (about 1000 m-deep)
are characterized by a facies Na-Cl (Figure 7). In the same Figure
(10) 7b, it is evident a decrease in chloride concentrations from the first
confined aquifer A1 to the deeper on (A2). Accordingly, the processed
whose correlation coefficient is r2= 0.9. isotopic and hydrochemical data are indicative of not direct hydraulic
The distribution of isotopic values relating to δ18O-δD communication between deep waters and surface aquifers.
generally reflects the presence of waters of multiple origins, from
the Alps, the Northern Apennines as well as from ‘local’ waters FINAL REMARKS
due to mixing phenomena between meteoric or surface water with The integrated analysis of deep seismic reflection profiles
underground ones. (Figure 6) paired with the estimation of the thermophysical
From the distribution of the hydrochemical data on the diagram parameters down to a depth of ca. 3 km allowed to infer both
of Piper (1944), we observe how in the A1 and A2 confined aquifer the horizontal and vertical temperature distributions, which are
204 Italian Journal of Engineering Geology and Environment, 1 (2021) © Sapienza Università Editrice www.ijege.uniroma1.itENVIRONMENTAL AND ENERGETIC IMPLICATIONS OF THE GEOTHERMAL ANOMALIES IN THE EASTERN PO PLAIN
Fig. 7 - a) Piper (1944) diagrams showing the distribution of the chemical composition of the shallow confined aquifer (A1 and A2) and the geothermal
reservoir of Casaglia; and b) Comparison between the chloride concentrations in the shallow aquifers (A1 and A2; ARPAe database) and the
geothermal reservoir (the wells FE-5800 and Fe-5600 are close to the Casaglia anticline; for the position see Fig. 1)
clearly strongly affected by the geological, hydrogeological and withdrawal well and one or two for reinjection. Currently in the
tectonic evolution characterizing the region. Accordingly, the Casaglia area, the fluid contained in the geothermal reservoir is
most promising areas in terms of potential geothermal reservoirs exploited with a flow rate of 400 m3/h, providing a renewable
and their exploitation have been recognized in a sector of the thermal energy power of approximately 14 MWth.
eastern Po Plain. From an environmental point of view, the geochemical
For the calculation and mapping of the geothermal gradients data analyzed suggest that the geothermal anomalies and their
and the heat flow for each borehole, two reference levels were exploitation have no interactions with the shallow aquifers.
considered corresponding to the base of the marine Quaternary, Accordingly, the 1000-2000 m-deep reservoir could be
Qm, and the top of the Scaglia, SC. Significant variations in considered hydraulically isolated from A1 and A2 (Figure
the geothermal gradient (Figure 5c) have been attributed to the 7). In other areas, such as for example in the area near the
development of convective flows within the carbonate sedimentary Marrara well (Figures 5 and 6), at a depth of about 400 m,
succession. Following this approach, areas with greater geothermal where heat is transmitted by convection and the temperature
potential have been identified due to the higher temperatures. For reaches about 35-40°C, the subsoil could be exploited
example, near the Casaglia and Vignola wells (Figure 5), where through a close circuit system for building heating. As a
at 1000 m-depths the geothermal fluid reaches ca. 90° C and final comment, it should be stressed that the presence of a
50°C, respectively. Both areas are in correspondence of buried ‘normal’ geothermal gradient could allow the installation
structural highs. The exploitation of this geothermal resource of low enthalpy geothermal systems basically all over the
could take place through an open circuit system that includes a investigated area and likely most of the Po Plain.
References
Agip (1977) - Temperature sotterranee. Inventario dei dati raccolti dall’AGIP durante la ricerca e la produzione di idrocarburi in Italia. F.lli Brugora, Segrate
(MI), 1390 pp.
Allegra R. G. (2016) - Analisi di profili sismici per la ricostruzione del modello geologico tridimensionale ad est di Ferrara. MSc thesis University of Ferrara,
75 pp. (unpublished).
Ascencio F., Samaniego F. & Rivera J. (2006) - Application of a spherical-radial heat transfer model to calculate geothermal gradients from measurements
in deep boreholes. Geothermics, 35 (1): 70-78.
Italian Journal of Engineering Geology and Environment, 1 (2021) © Sapienza Università Editrice www.ijege.uniroma1.it 205D. Rapti & R. caputo
Axelsson G. & Gunnlaugsson E. (Eds.) (2000) - Long-term monitoring of high- and low-enthalpy fields under exploitation. World Geothermal Congress
2000 Short Course, 226 pp., Kokonoe, Kyushu District, Japan.
Bendritter Y. & Cormy G. (1990) - Possible approach to geothermal research and relative costs. In: DICKSON M.H. & FANELLI M., (Eds.) - Small
Geothermal Resources: A Guide to Development and Utilization, 59-69, UNITAR, New York.
Bigi G., Cosentino D., Parotto M., Sartori R. & Scandone P. (1990) - Structural Model of Italy: Geodynamic project, C.N.R.. Firenze, S.EL.CA., scale
1:500.000, 6 sheets.
Bortolami C., Braga G., Colombetti A., Dalpra A., Francani V., Francavilla F., Giuliano G., Manfredini M., Pellegrini M., Petrucci F.,
Pozzi R. & Stefanini S. (1978) - Hydrogeological features of the Po Valley (Northern Italy). In: Proc. Of the IAHS conference on hydrogeology of
great sedimentary basins, Budapest, Hungary, 304-321.
Caputo R. & Tarabusi G. (2016) - Il complesso sistema di sorgenti sismogeniche nell’area ferrarese e i loro effetti nella storia. Accademia delle Scienze
di Ferrara, Atti, 93: 166-177, ISSN 0365-0464.
Caputo R., Poli M.E., Minarelli L., Rapti D., Sboras S., Stefani M. & Zanferrari A. (2016) - Palaeoseismological evidence for the 1570 Ferrara
earthquake, Italy. Tectonics, 35: 1423-1445.
Cooper L.R. & Jones C. (1959) - The determination of virgin strata temperatures from observations in deep survey boreholes. Geophys. J. Royal Astron.
Soc., 2: 116-131.
Deming D. & Chapman D.S. (1988) - Heat flow in the Utah–Wyoming thrust belt from analysis of bottom-hole temperature data measured in oil and gas
wells. J. Geophys. Res., 93: 13657-13672.
Dowdle W. & Cobb W. (1975) - Static formation temperature from well logs-an empirical method. J. Petrol. Technol., 27 (11): 1326-1330.
Edwardson M. L., Girner H. M., Parkinson H. R., Williams C. D. & Matthews C. S. (1962) - Calculation of formation temperature disturbances caused
by mud circulation. J. Petrol. Technol., 14 (4): 416-426.
Eppelbaum L.V. & Kutasov I. M. (2006) - Determination of formation temperatures from temperature logs in deep boreholes: comparison of three methods.
J. Geophys. Eng., 3: 348-355.
Freeze R. A. & Cherry A. J. (1979) - Groundwater. Prentice-Hall Inc., 604 pp., Englewood Cliffs, New Jersey.
Haenel R. (1974) - Heat-flow measurements in Northern Italy and heat-flow maps of Europe. J. Geophys., 40: 367-380.
Haenel R., Rybach L. & Stegena L. (1988) - Handbook of Terrestrial Heat-Flow Density Determination. Kluwer Academic, Dordrecht, Netherlands, 9-57.
Hem J.D. (1985) - Study and interpretation of the chemical characteristics of natural water. 3nd edition U.S. Geological Survey, Water Supply, paper 2254, 263 pp.
Hochstein M.P. (1990) - Classification and assessment of geothermal resources. In: Small geothermal resources (eds. M. H. Dickson and M. Fanelli),
UNITAEWNDP Centre for Small Energy Resources, Rome, Italy, 31-59.
Horner D. R. (1951) - Pressure build-up in wells. Proc. 3rd World Petroleum Congress, 2: 924-931.
Hounslow A.W. (1995) - Water quality data: analysis and interpretation. Lewis Publishers, 416 pp., New York.
Kutasov I. M. (1999) - Applied Geothermics for Petroleum Engineers. Elsevier, 346 pp., Amsterdam.
Lachenbruch A. H. & Brewer M. C. (1959) - Dissipation of the temperature effect of drilling a well in Arctic Alaska. US Geol. Surv. Bull. 1083-C: 73-109.
Lee K.C. (2001) - Classification of geothermal resources by exergy. Geothermics, 30 (4): 431-442.
Lloyd J.W. & Heathcote J.A. (1985) - Natural inorganic hydrochemistry in relation to groundwater. Oxford University Press, 255 pp., New York.
Mastella G. (2018) - Interpretazione di profili sismici per la ricostruzione di un modello geologico 3D del sottosuolo di Ferrara. MSc thesis Università di
Ferrara, pp. 76 (unpublished).
Mistroni L. (2016) - Interpretazione di un profilo sismico attraverso l’Arco di Ferrara centrale. MSc thesis Università di Ferrara, pp. 58 (unpublished).
Muffler L.P.J. & Cataldi R. (1978) - Methods for regional assessment of geothermal resources. Geothermics, 7: 53-89.
Hochstein M.P. (1988) - Assessment and modelling of geothermal reservoirs (small utilization schemes). Geothermics, 17 (1): 15-49.
Pasquale V. & Verdoya M. (1990) - Geothermal regime of the Po Basin, Italy. Vol. Spec. Soc. Geol. It., 1: 135-144.
Pasquale v., Chiozzi p., Gola g. & Verdoya m. (2008) - Depth–time correction of petroleum bottom-hole temperatures in the Po Plain, Italy. Geophysics,
73: 187-196.
Pasquale V., Chiozzi P., Verdoya M. & Gola G. (2012) - Heat flow in the Western Po Basin and surrounding orogenic belts. Geophys. J. Int., 190: 8-22.
Pasquale V., Chiozzi P. & Verdoya M. (2013) - Evidence for thermal convection in the deep carbonate aquifer of the eastern sector of the Po Plain, Italy.
Tectonophys, 594: 1-12.
Piper A.M. (1944) - A graphical procedure in the geochemical interpretation of water analyses. Transactions, American Geophysical Union, 25: 914-923.
Rapti-Caputo D. (2000) - Risorse idriche sotterranee a est di Ferrara: indagini sul comportamento idrogeologico e idrochimico. Proposte per una gestione
ottimale. Ph.D. Thesis, University of Ferrara, 215 pp.
Rapti-Caputo D. (2007) - Caratterizzazione qualitativa dei serbatoi acquiferi. In: Risorse idriche sotterranee della Provincia di Ferrara. Regione Emilia-
Romagna, 41-46.
206 Italian Journal of Engineering Geology and Environment, 1 (2021) © Sapienza Università Editrice www.ijege.uniroma1.itENVIRONMENTAL AND ENERGETIC IMPLICATIONS OF THE GEOTHERMAL ANOMALIES IN THE EASTERN PO PLAIN
Rapti-Caputo D. & Martinelli G. (2007) - Geochimica isotopica. In: Risorse idriche sotterranee della Provincia di Ferrara. Regione Emilia-Romagna, 51-53.
Rapti-Caputo D. & Martinelli G. (2009) - The geochemical and isotopic composition of aquifer systems in the deltaic region of the Po River plain
(northern Italy). Hydrogeology Journal, 17 (2), 467-480.
Raymond L. R. (1969) - Temperature distribution in a circulating drilling fluid. J. Petrol. Technol., 21: 333-341.
Regione Emilia-Romagna-Eni-Agip (1998) - Riserve idriche sotterranee della regione Emilia-Romagna. A cura di G. Di Dio, S.EL.CA., 120 pp., Firenze
Robertson E.C. (1988) - Thermal properties of rocks. USGS Open-File Report 106 pp.
Sanyal S.K. (2005) - Classification of geothermal systems – a possible scheme. Proc. 30th Workshop on Geothermal Reservoir Engineering, 85-88,
Stanford, California.
Sekiguchi K. (1984) - A method for determining terrestrial heat flow in oil basinal areas. Tectonophys., 103 (1-4): 67-79.
Stumm W. & Morgan J. J. (1981) - Aquatic chemistry. 2 ed. New York: John Wiley & Sons.
Verma S. P., Andaverde J. & Santoyo E. (2006) - Application of the error propagation theory in estimates of static formation temperatures in geothermal
and petroleum boreholes. Energy Convers Manage, 47 (20): 3659-3671.
Viganò A., Della Vedova B., Ranalli G., Martin S. & Scafidi D. (2012) - Geothermal and rheological regime in the Po plain sector of Adria (Northern
Italy). Ital. J. Geosciences, 131 (2): 228-240.
Von Herzen R.P. & Uyeda S. (1963) - Heat flow through the eastern Pacific Ocean floor. J. Geophys. Res., 68 (14): 4219-4250.
Wong-Loya J., Andaverde J. & Santoyo E. (2012) - A new practical method for the determination of static formation temperatures in geothermal and
petroleum wells using a numerical method based on rational polynomial functions. J. Geophys. Eng., 9 (6): 711-728.
Zschocke A. (2005) - Correction of non-equilibrated temperature logs and implications for geothermal investigations. J. Geophys. Eng., 2: 364-371.
Received February 2021 - Accepted June 2021
Italian Journal of Engineering Geology and Environment, 1 (2021) © Sapienza Università Editrice www.ijege.uniroma1.it 207Puoi anche leggere