Development of a wind farm controller and wind farm control algorithm for wind tunnel testing - POLITesi
←
→
Trascrizione del contenuto della pagina
Se il tuo browser non visualizza correttamente la pagina, ti preghiamo di leggere il contenuto della pagina quaggiù
POLITECNICO DI MILANO
        Facoltà di Ingegneria Industriale e dell’ Informazione
        Corso di Laurea Magistrale in Ingegneria Aeronautica

      Development of a wind farm
   controller and wind farm control
   algorithm for wind tunnel testing

Relatore: Prof. Carlo Luigi Bottasso
Correlatore: Ing. Filippo Campagnolo

                                                Tesi di Laurea di:
                                 Nicola Troiano, matricola 782786

                 Anno Accademico 2012-2013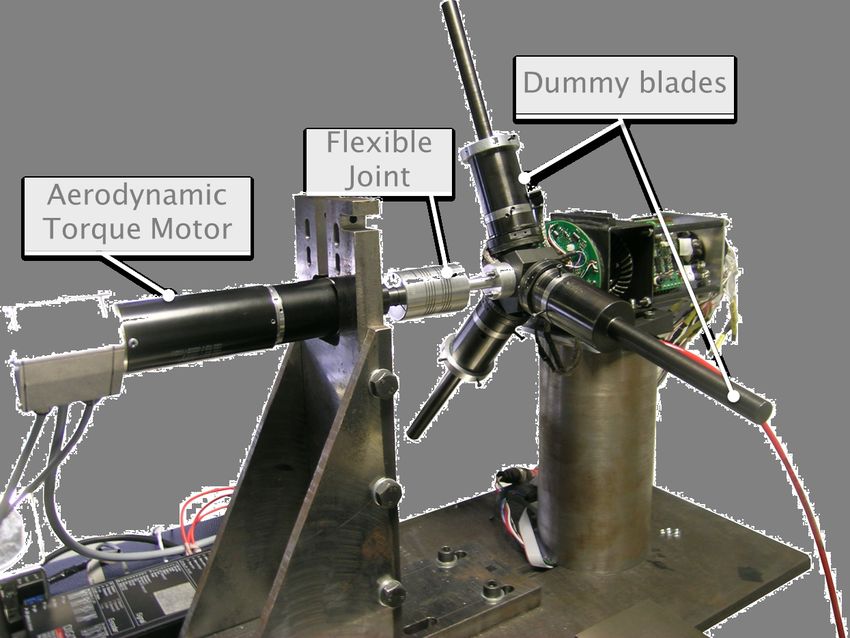
A mio padre, che ogni giorno si spacca
               la schiena per amore dei suoi figli.
       A mia madre, che ogni giorno con grande
amore mi fa sempre trovare un piatto caldo e una
  casa pulita ed ordinata in cui potermi riposare.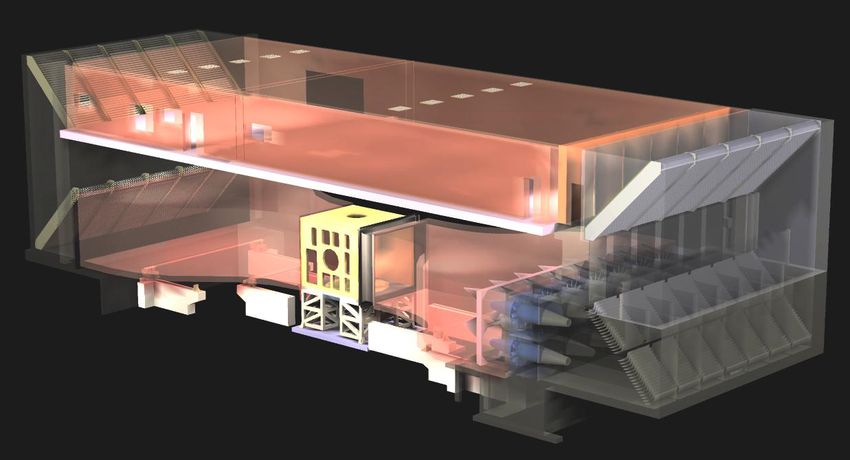
Ringraziamenti

In primo luogo, vorrei ringraziare il prof. Carlo Bottasso per avermi dato la
possibilità di intraprendere un lavoro di tesi cosı̀ interessante e avermi fornito
tutti gli strumenti necessari per portarlo a termine.
    Un grande ringraziamento va all’ing. Filippo Campagnolo, che con grande
dedizione mi ha seguito e accompagnato in questi mesi di lavoro, sopportando
le mie numerosissime sviste e distrazioni con grande pazienza e insegnandomi
ad usare un po’ più la testa e a ragionare da ingegnere.
    Vorrei ringraziare anche Federico Carlo e Stefano per il grande supporto
morale (e spesso anche pratico) che mi hanno dato, in particolar modo negli
ultimi 3 mesi, spesso anche solo con un gesto di cortesia o con un saluto.

          ...quando vedo crollare quello in cui credo, poi mi sollevo e
      riparto da zero e so che ogni cosa la devo alle palle quadre di mio
      padre e al suo sudore, al sorriso di mia madre, al viso di ogni
      nonno che proietta amore, a mio fratello piccolo ora più alto di
      me, nonna mi protegge sulla stella più bella che c’è...

    Con le semplici parole di una canzone degli Articolo 31, il mio primo
ringraziamento va ai miei genitori, per avermi sempre sostenuto, per aver
creduto nelle mie capacità sin dall’infanzia, per avermi sempre insegnato a
dare sempre il meglio di me e a mettere a frutto le capacità e i doni che ho
ricevuto. Un grazie va anche a mio fratello, perchè nonostante i mille litigi
e incomprensioni ha sempre dimostrato di stimarmi e di volermi bene dal
profondo del cuore.
    Un grazie gratuito, nonchè doveroso, va ad Elisa, la cui esplosività, ca-
parbietà, testardaggine, intelligenza, curiosità, tenerezza e soprattutto Amore
hanno accompagnato, accompagnano e, a questo punto, continueranno ad
accompagnare ogni singolo momento della mia vita, rendendomi ogni giorno
sempre più un uomo. La tua presenza ed il tuo amore sono stati ”luce e sale”,
perchè hanno illuminato ogni momento di buio di questo lungo cammino in

                                        V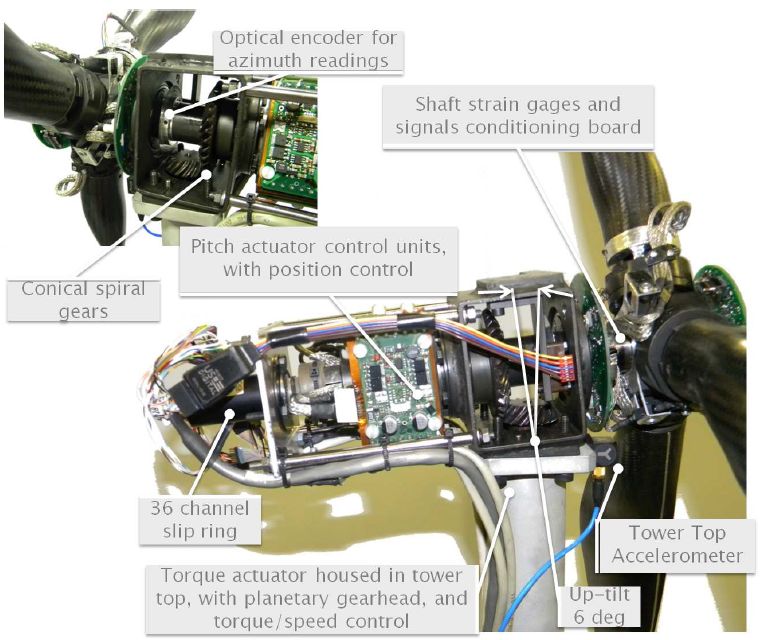
cui avrei rischiato di perdermi e sale perchè hanno dato il senso e il sapore a
questa esperienza.
    Un grazie va a tutti i miei amici, in particolar modo Emanuele, Marco, Si-
mone, Marco, Gabriele, Debora, Chiara Francesca e Guido, per aver sempre
condiviso le gioie e le difficoltà in modo sincero e gratuito, spesso accompa-
gnandole con una bella birra.
    Un ringraziamento va anche a Francesca, Michele, Andrea, Sara, Marco
e Chiara, per aver sempre dimostrato un amicizia salda e radicata in Cristo,
soprattutto nei momenti più difficili.
    Un grazie a Zaga, Miki e Teo, che in questi cinque anni hanno condiviso
questo calvario, la cui compagnia è stata di fondamentale importanza e mi
ha permesso di preservare un po’ della mia sanità mentale, ammesso e non
concesso che prima ce ne fosse.
    Un grazie lo dedico al maestro Alessandro Tulis, a Michele, Luca, Ivano,
Andrea, Andrea, Luca e a tutti gli allievi del Karate-do Rei, perchè sul
tatami, fra sangue e sudore ho imparato che nella vita l’importante è non
mollare mai e continuare a combattere. OSS!
    Ringrazio anche a tutte quelle persone che nei modi più disparati e fanta-
siosi hanno cercato di gettare le tenebre nella mia vita, facendomi arrancare
e vacillare, perchè grazie a voi ho trovato nuove forze e nuovo coraggio di
affrontare la vita. Un grazie a tutti quelli che non hanno mai creduto in
me e che null’ altro hanno cercato che distruggere la mia autostima, perchè
nonostante tutto questo, io ce l’ho fatta!!!

                        A chi molto è stato dato, molto sarà richiesto;
                  e a chi molto è stato affidato, tanto più si richiederà
                                                                   Lc 12,48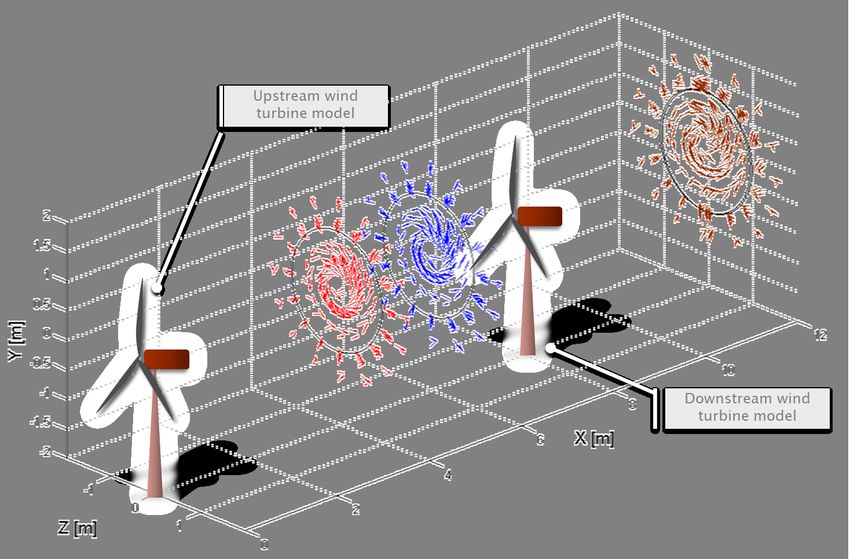
Contents

Ringraziamenti                                                                                                   V

Sommario                                                                                                     XIII

Abstract                                                                                                         XV

Riassunto                                                                                                    XVII

1 Introduction                                                                                                    1
  1.1 Wind energy . . . . . . .    . . . .   .   .   .   .   .   .   .   .   .   .   .   .   .   .   .   .   .    1
  1.2 Wind farms . . . . . . .     . . . .   .   .   .   .   .   .   .   .   .   .   .   .   .   .   .   .   .    2
  1.3 The Approach . . . . . .     . . . .   .   .   .   .   .   .   .   .   .   .   .   .   .   .   .   .   .    6
  1.4 W T 2 Project . . . . . .    . . . .   .   .   .   .   .   .   .   .   .   .   .   .   .   .   .   .   .    8
  1.5 Innovative content of the    thesis    .   .   .   .   .   .   .   .   .   .   .   .   .   .   .   .   .    9
  1.6 Thesis Outline . . . . . .   . . . .   .   .   .   .   .   .   .   .   .   .   .   .   .   .   .   .   .    9

2 The experimental set-up                                                                                        11
  2.1 The wind tunnel . . . . . . . . . . . . .                  .   .   .   .   .   .   .   .   .   .   .   .   11
  2.2 Wind turbine models . . . . . . . . . . .                  .   .   .   .   .   .   .   .   .   .   .   .   12
      2.2.1 General design . . . . . . . . . .                   .   .   .   .   .   .   .   .   .   .   .   .   13
            2.2.1.1 Nacelle design . . . . . .                   .   .   .   .   .   .   .   .   .   .   .   .   13
            2.2.1.2 Rotor and blade design .                     .   .   .   .   .   .   .   .   .   .   .   .   13
            2.2.1.3 Aerodynamics . . . . . .                     .   .   .   .   .   .   .   .   .   .   .   .   15
            2.2.1.4 Tower design . . . . . .                     .   .   .   .   .   .   .   .   .   .   .   .   16
            2.2.1.5 Sensors . . . . . . . . .                    .   .   .   .   .   .   .   .   .   .   .   .   17
            2.2.1.6 Actuators and control .                      .   .   .   .   .   .   .   .   .   .   .   .   17
      2.2.2 Real-time supervisor . . . . . . .                   .   .   .   .   .   .   .   .   .   .   .   .   19
            2.2.2.1 Model state machine . .                      .   .   .   .   .   .   .   .   .   .   .   .   19
      2.2.3 Support tools . . . . . . . . . . .                  .   .   .   .   .   .   .   .   .   .   .   .   21
      2.2.4 Simulation tools . . . . . . . . . .                 .   .   .   .   .   .   .   .   .   .   .   .   22

                                    VII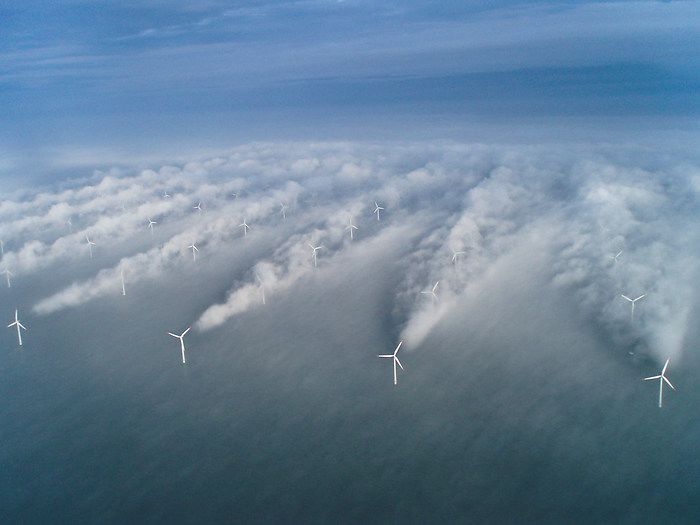
3 Wind farm control development                                                                         25
  3.1 Stand-alone wind turbine control . . . . . . . . . . . . . . . .                                  25
      3.1.1 Regulation policy . . . . . . . . . . . . . . . . . . . . .                                 25
      3.1.2 Control . . . . . . . . . . . . . . . . . . . . . . . . . .                                 29
  3.2 Wind turbine control for wind-farm control application . . . .                                    31
      3.2.1 The ISO-TSR approach . . . . . . . . . . . . . . . . .                                      33
  3.3 Wind farm control . . . . . . . . . . . . . . . . . . . . . . . .                                 36
      3.3.1 Wind farm control – wind turbine control communication                                      37
      3.3.2 Super-controller architecture . . . . . . . . . . . . . . .                                 39
             3.3.2.1 Manual mode . . . . . . . . . . . . . . . . .                                      39
             3.3.2.2 Automatic mode . . . . . . . . . . . . . . .                                       41
      3.3.3 Simulated Annealing . . . . . . . . . . . . . . . . . . .                                   41
             3.3.3.1 The algorithm . . . . . . . . . . . . . . . . .                                    42
  3.4 Algorithm calibration . . . . . . . . . . . . . . . . . . . . . . .                               44
      3.4.1 Wake model . . . . . . . . . . . . . . . . . . . . . . . .                                  44
      3.4.2 Wake interaction model . . . . . . . . . . . . . . . . .                                    45
      3.4.3 Calibration results . . . . . . . . . . . . . . . . . . . .                                 46
  3.5 Wind farm control testing on test bench . . . . . . . . . . . .                                   49
      3.5.1 ”ISO-TSR approach testing on test bench” . . . . . . .                                      49
      3.5.2 Wind farm testing on test bench . . . . . . . . . . . .                                     51
             3.5.2.1 Results . . . . . . . . . . . . . . . . . . . . .                                  53

4 Conclusions and future developmets                                                                    57
  4.1 Conclusions . . . . . . . . . . . . . .   .   .   .   .   .   .   .   .   .   .   .   .   .   .   57
  4.2 Wind tunnel testing . . . . . . . . . .   .   .   .   .   .   .   .   .   .   .   .   .   .   .   59
      4.2.1 Test procedure . . . . . . . .      .   .   .   .   .   .   .   .   .   .   .   .   .   .   59
  4.3 Future developments . . . . . . . . .     .   .   .   .   .   .   .   .   .   .   .   .   .   .   61

Bibliography                                                                                            63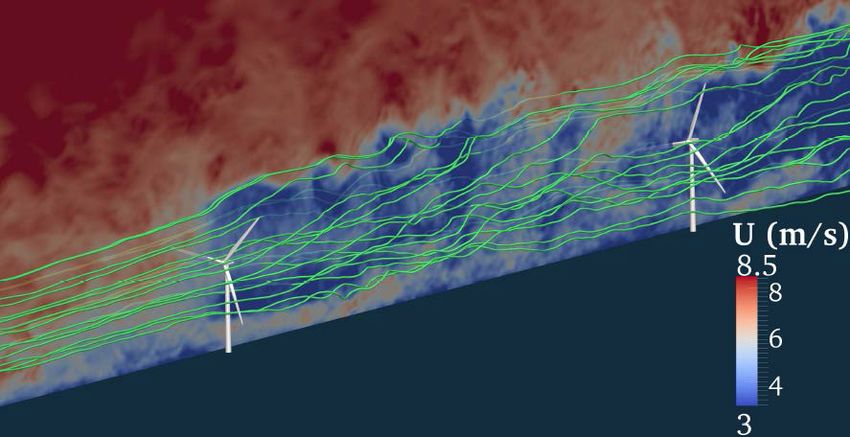
List of Figures
1 Regulation trajectory . . . . . . . . . . . . . . . . . . . . . . . XIX
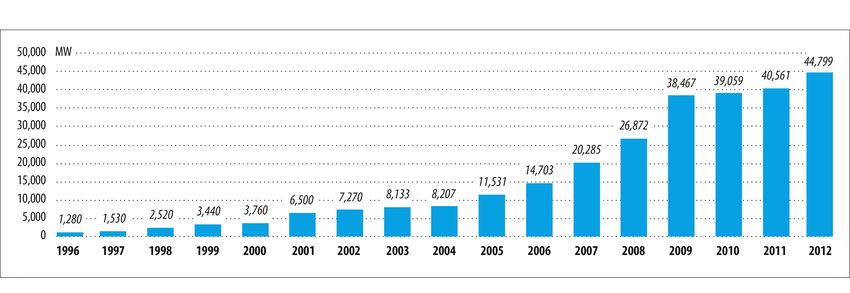
1.1 Global annual installed wind capacity 1996-2012 (source: GWEC) 1
1.2 Global cumulative installed wind capacity 1996-2012 (source:
GWEC) . . . . . . . . . . . . . . . . . . . . . . . . . . . . . . 2
1.3 Actuator disc. The actuator disc describes the wind speed in
proximity of an ideal wind turbine using the Momentum Theory 3
1.4 Power extracted from wind vs axial induction factor . . . . . . 4
1.5 Example of wake generated in a wind farm . . . . . . . . . . . 5
1.6 Hywind. The world’s first full-scale floating wind turbine . . . 7
1.7 Example of numerical simulations. [1] . . . . . . . . . . . . . . 7
2.1 Plant configuration of the GVPM wind tunnel . . . . . . . . . 11
2.2 Civil (left) and aeronautical (right) test section details. . . . . 12
2.3 Nacelle arrangement . . . . . . . . . . . . . . . . . . . . . . . 14
2.4 Scheme of torque transmission components . . . . . . . . . . . 14
2.5 Model airfoils shape. . . . . . . . . . . . . . . . . . . . . . . . 16
2.6 Torque control loop. . . . . . . . . . . . . . . . . . . . . . . . 19
2.7 Implemented model state machine. . . . . . . . . . . . . . . . 20
2.8 Graphical interface for the model management . . . . . . . . . 21
2.9 Test bench . . . . . . . . . . . . . . . . . . . . . . . . . . . . . 22
2.10 Aerodynamic torque computation. . . . . . . . . . . . . . . . . 22
2.11 Multi-body aero-servo-elastic simulation tool. . . . . . . . . . 23
3.1 Traditional regulation policy. . . . . . . . . . . . . . . . . . . . 26
3.2 Traditional control on CP vs TSR . . . . . . . . . . . . . . . . 28
3.3 V2 model control trajectories . . . . . . . . . . . . . . . . . . 29
3.4 Comparison between βref , given by the regulation trajectory
and βmin , introduced as anti-windup technique. . . . . . . . . 30
3.5 Regulation trajectory: ISO-TSR approach explaining . . . . . 33
3.6 Partialized Cp − λ curves for several partialization factors p . . 33
3.7 Partialized trajectories for rotor speed, pitch and torque . . . 34
3.8 A as funcion of TSR and CP . . . . . . . . . . . . . . . . . . . 35
IX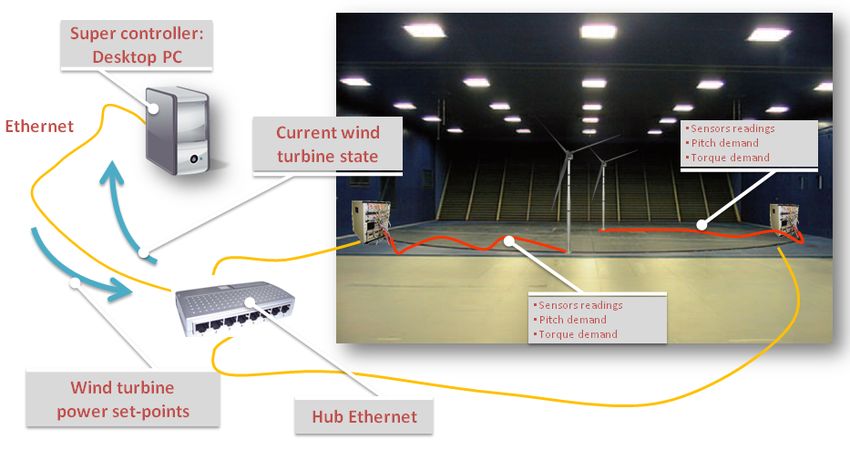
3.9 Super-controller conceptual scheme . . . . . . . . . . . . . . . 38
3.10 Super-controller scheme . . . . . . . . . . . . . . . . . . . . . 40
3.11 Manual mode scheme . . . . . . . . . . . . . . . . . . . . . . . 40
3.12 Automatic mode scheme . . . . . . . . . . . . . . . . . . . . . 41
3.13 Implemented simulated annealing algorithm scheme . . . . . . 43
3.14 Illustration of parameters for Park wake model . . . . . . . . . 45
3.15 Interaction model example . . . . . . . . . . . . . . . . . . . . 45
3.16 Park wake numerical results . . . . . . . . . . . . . . . . . . . 47
3.17 Trajectories at 60 %, 80% and 100 % of the available power
with 10 % of turbulence realized at test-bench . . . . . . . . . 50
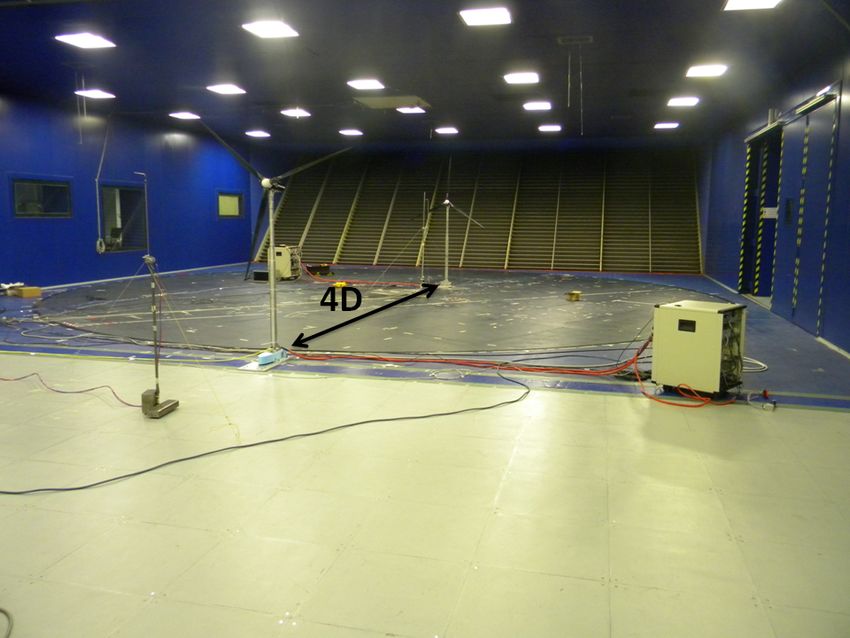
3.18 Transition examples at 3.5 m/s, 7 m/s and 9 m/s . . . . . . . 51
3.19 Hardware-in-the-loop test scheme . . . . . . . . . . . . . . . . 52
3.20 Park wake numerical results without including Reynolds effects 53
3.22 Wind farm total power production partializing at wind speed
3.5 m/s . . . . . . . . . . . . . . . . . . . . . . . . . . . . . . 55
3.23 Wind farm total power production partializing at the wind
speed: 3.5 m/s, 4 m/s, 5 m/s, 6 m/s and 7 m/s. Numerical
and experimental results . . . . . . . . . . . . . . . . . . . . . 56
4.1 Wind tunnel layout for wind farm testing . . . . . . . . . . . . 59List of Tables
2.1 Scaling factors used for mapping the V90 into the model char-
acteristics [2] . . . . . . . . . . . . . . . . . . . . . . . . . . . 12
2.2 Main dimensions of the scaled model [2] . . . . . . . . . . . . 13
3.1 Regulation policy resume . . . . . . . . . . . . . . . . . . . . . 28
3.2 Possible operative conditions at 90% of the available power . . 32
3.3 Regulation policy for partial-regulated machine . . . . . . . . 34
3.4 Algorithm calibration results . . . . . . . . . . . . . . . . . . . 49
XISommario
Negli ultimi anni, la produzione di energia attraverso fonti rinnovabili, in
particolar modo l’energia eolica, stanno vivendo un momento di grande es-
pansione. Questo incremento ha reso necessaria l’organizzazione di queste
macchine in grandi parchi eolici al fine di limitare gli spazi occupati.
L’organizzazione delle macchine in parchi eolici porta, tuttavia, a fenomeni
di interazione della scia generata dalle macchine poste a monte su quelle poste
a valle del vento, che si traducono in un calo delle prestazioni delle ultime e
quindi ad una riduzione delle prestazioni dell’intero parco eolico.
Di fronte a questo problema, la ricerca sta dedicando numerose energie
al fine di migliorare le prestazioni complessive dei parchi eolici, sviluppando
numerosi approcci, primo fra tutti quello numerico.
In questo lavoro è stato affrontato lo sviluppo di un controllore real-time
di un parco eolico composto da due macchine per la sperimentazione di leggi
di controllo in galleria del vento.
Nella prima parte, viene spiegata la politica di controllo, chiamata parzial-
izzazione ISO-TSR, che è stata sviluppata al fine di ridurre la potenza gen-
erata dalla macchina posta a monte, riducendo cosı̀ gli effetti della propria
scia su quella posta a valle. La politica di controllo si basa sull’invio di un
set-point di potenza, richiedendo a ciascuna macchina l’erogazione di una
certa percentuale della potenza disponibile date le condizione di vento.
Nella seconda parte, viene descritto in modo dettagliato il funzionamento
e lo sviluppo del controllore e la logica di funzionamento della modalità
manuale ed automatica. Nella modalità automatica, il controllore ricerca
la parzializzazione che ottimizza la potenza prodotta attraverso l’ algoritmo
“Simulated Annealing”.
Infine, vengono mostrati i risultati ottenuti dai test effettuati al banco
prova. Viene mostrata la capacità di inseguire le traiettorie parzializzate con
il metodo ISO-TSR in ogni condizione di vento, la capacità di passare da
una parzializzazione ad un’altra e la capacità del controllore di realizzare un
controllo real-time in galleria del vento.
Parole chiave:Parchi eolici, controllo, galleri del vento, simulated an-
nealing, approccio ISO-TSR.
XIIIAbstract
In the last years, the energy production based on renewable energies and
particularly wind energy, is experiencing a period of great expansion. This
increase has lead to the need to organize the wind turbines in wind farms in
order to reduce the occupied areas.
However, the compression of the wind turbines in wind farm has lead
to interaction phenomenon of the wakes generated by the upstream wind
turbines on the downstream ones, that generate a drop in the wind farm
total power production.
In this overview, the research is focusing the attention on this problem, in
order to improve the wind farm performance, developing different approaches,
first among everything the numerical one.
In the present work a real-time controller able to control a wind farm made
up of two wind turbines for wind tunnel application has been developed.
In the first part, the author explain how the ISO-TSR partialization
works, i.e. the control policy that has been developed in order to reduce
the power of upstream wind turbine and so the effects of the its wake on the
downstream one. The control policy consists in a power set-point sending,
asking to the wind turbine a certain percentage of the power available in that
wind condition.
In the second part, the author explain how the wind farm controller
works, its development and the functioning logic of the automatic and manual
modes. In the automatic mode, the controller try to optimize the power
production of the complete wind farm through a ”Simulated Annealing”
algorithm.
As a conclusion, the results obtained through the test bench testing are
presented. The ability of controller to follow a trajectory partialized with the
ISO-TSR approach, as well as the ability to switch from a partilization to
another is demonstrated. Eventually, the ability of the controller to realize
a real-time control in the wind tunnel is shown.
Keywords:Wind farm, control, wind tunnel, simulated annealing, ISO-
TSR approach.
XVRiassunto
Il crescente costo di tutti i prodotti ricavati dai combustibili fossili, uni-
tamente alla cresciuta sensibilità da parte della società moderna volta alla
riduzione delle emissioni inquinanti, sta portando molto rapidamente allo
sviluppo di fonti di energia rinnovabili. In questo contesto l’energia eolica
sta ricomprendo un ruolo fondamentale e negli ultimi anni ha vissuto un pe-
riodo di grande sviluppo che secondo le previsioni è destinato a proseguire
positivamente.
L’aumento del numero di generatori eolici tuttavia ha portato necessari-
amente ad una loro organizzazione in contesti di wind farm, che consentono
una compattazione e una riduzione degli spazi occupati dalle macchine.
L’organizzazione di queste macchine in contesti di wind farm porta, tut-
tavia a fenomeni di interazione fra le stesse, in particolar modo, la scia delle
macchine poste a monte si riflette negativamente sulle macchine poste a valle
del vento, riducendo di molto la potenza prodotta dalle ultime e quindi com-
plessivamente la potenza prodotta da tutta la wind farm.
Solo negli ultimi anni, la ricerca ha iniziato ad investire energie nello
sviluppo di tecniche che consentano di ottimizzare la potenza prodotta, nella
prospettiva di ridurre il costo dell’energia, rendendo l’energia eolica ancor
più competitiva dal punto di vista economico.
Dal momento questo ambito della ricerca in campo eolico risulta essere
molto giovane, si stanno sviluppando molto velocemente numerose tecniche:
la disposizione ottima delle macchine all’interno della wind farm, lo sviluppo
di modelli matematici di scia sempre più complessi, che siano in grado di
rendere le simulazioni numeriche sempre più affidabili, i test su grande scala
e non da ultimo la ricerca in galleria del vento.
Le simulazioni numeriche rappresentano l’approccio più comune a questi
problemi, dal momento che consentono di studiare i fenomeni fisici con l’ausilio
di computer. Tuttavia, presentano un forte limite, ovvero la simulazione nu-
merica di wind farm prevede lo studio dell’interazione della scia, che è carat-
terizzata da una forte turbolenza, con le macchine poste a valle. L’analisi di
questo tipo di fenomeni fisici, tuttavia, per quanto possa essere accompag-
nato da una forte potenza di calcolo, richiede numerose ore, senza considerare
XVIIil fatto che i modelli matematici che caratterizzano i fenomeni di turbolenza
non sono completamente attendibili.
La ricerca in galleria del vento, da un lato, rappresenta un limite, perchè
sono necessarie delle strutture adatte ad ospitare queste macchine e perchè
è altresı̀ necessario studiare in maniera opportuna le leggi di scalatura della
macchine, in maniera tale da poter riprodurre in modo fedele il comporta-
mento della macchina sia dal punto di vista aerodinamico, sia dal punto di
vista dell’elasticità della struttura. Da un altro lato, invece, rappresenta uno
strumento di grande rilevanza, soprattutto nello studio di leggi di controllo
che riguardano l’interazione fra le macchine e la scia. Infatti, basti pensare
che all’interno della galleria del vento le macchine poste a valle possono es-
sere investite da una scia reale e non simulata o ricreata numericamente sulla
base di un modello matematico. La galleria del vento consente inoltre di la-
vorare in un contesto sicuro e controllato e di ridurre notevolmente il tempo
necessario alla simulazione.
Il progetto argomento di questo tesi è stato lo sviluppo di un controllore
real-time di wind farm in grado di ottimizzare la potenza prodotta da una
wind farm composta di due macchine per la sperimentazione in galleria del
vento.
Nel Capitolo 2, viene presentata la strumentazione che si è resa necessaria
durante il progetto, spiegando in maniera piuttosto dettagliata i modelli V2
sviluppati dal Politecnico di Milano nell’ambito di un progetto pluriennale
con la società Vestas.
L’obbiettivo di questa collaborazione è stata la realizzazione di un modello
in scala ridotta della Vestas V90 per la sperimentazione in galleria del vento di
leggi di controllo. A seguito di questo progetto è stato realizzato un secondo
modello, identico al primo, aprendo cosı̀ la strada alle prime sperimentazioni
in galleria del vento di leggi di controllo per le wind farm.
I modelli vengono descritti nei loro particolari, descrivendo i sensori in-
stallati sulla macchina, gli attuatori, la logica di funzionamento del sistema
di controllo e gli strumenti utilizzati per la calibrazione del controllore.
Nel Capitolo 3, viene invece descritto in modo dettagliato il modo in cui
è stato sviluppato il controllore e la sua logica di funzionamento. Il capitolo
inizia presentando la logica di controllo tradizionale della macchina isolata,
descrivendo come vengono calcolate le traiettorie di regolazione in Regione
II, II1/2 e III e la modalità con cui viene realizzato il controllo in coppia e in
passo pala.
Successivamente, il capitolo prosegue nella descrizione del modo in cui la
logica di controllo è stata modificata, al fine di poter richiedere alla macchina
l’erogazione solo di una percentuale della potenza disponibile, riducendo cosı̀
l’intensità della scia e quindi consentendo alla macchina posta a monte delvento di ricevere un beneficio in termini di potenza. Il metodo sviluppato è
stata rinominato ”parzializzazione ISO-TSR”. Il metodo viene sviluppato a
partire dall’equazione della potenza della macchina:
1
P = ρAV 3 CP
2
Dall’equazione si può facilmente notare che l’unico termine su cui il con-
trollo della macchina può intervenire è il termine CP , ad esempio, molti-
plicandolo per un coefficiente p ∈ [0, 1]. Analizzando i grafici CP − T SR
della macchina tuttavia ci si può rendere conto che la macchina può fornire
il valore richiesto in diverse condizioni (si guardi Fig. 1), che possono es-
sere riassunte in tre condizioni, le prime due richiedono la modifica del TSR
a cui la macchina opera quando viene sottoposta alle stesse condizioni di
vento(T SR > T SRnom T SR < T SRnom ) e, quindi, un cambio di velocità
di rotazione del rotore, con possibili conseguenze sullo spettro dei carichi; la
terza condizione è quella di mantenere lo stesso TSR (da cui il nome ISO-
TSR), mantenendo quindi invariata la velocità di rotazione del rotore, dalla
quale ci si attende un minore impatto dal punto di vista dello spettro dei
carichi.
Figure 1: Regulation trajectory
La parzializzazione avviene quindi a TSR costante, prendendo i punti op-
erativi che erano stati precedentemente calcolati per il controllo tradizionale
e moltiplicandoli per un coefficiente riduttivo che esprima la percentuale di
potenza che la macchina deve erogare. Il suddetto coefficiente moltiplica-
tivo diventa quindi anche il set-point di potenza che la il controllore di wind
farm invierà al controllore della macchina, la quale in maniera autonoma
provvederà a regolarsi secondo l’istruzione ricevuta.
Il controllo del generatore non viene modificato, ma viene cambiata solo
la traiettoria di regolazione della macchia in passo e coppia alla macchinaviene solo richiesto un valore diverso di coppia e di passo in funzione della
parzializzazione richiesta. Alla macchina vengono fornite delle tabelle di set
point per passo e coppia per un certo numero di parzializzazioni, fra le quali
essa interpolerà per fornire il valore richiesto dal controllore di wind farm.
Dopo aver definito come avviene il controllo al livello ”wind turbine”, si
passa poi alla spiegazione di come avviene la comunicazione fra il controllore
di wind farm e quello della macchina. La comunicazione avviene grazie ad
una libreria C che consente di codificare i protocolli di comuncazione fra un
codice C e i sistemi di controllo delle macchine. Pertanto, il Super-controller
è un codice scritto in linguaggio C, nella quale sono state realizzate delle
funzioni che consentono la lettura e la scrittura di dati sul controllore stesso.
Dal punto di vista fisico, il computer su cui viene eseguito il Super-controller è
un PC tradizionale con sistema operativo Windows, e connesso alle macchine
per mezzo di un hub Ethernet.
Successivamente, il capitolo si sofferma a descrivere in maniera dettagli-
ata la logica di funzionamento del controllore, spiegando che esso implementa
due modalità, una manuale, nella quale l’operatore può definire quale parzial-
izzazione richiedere alla macchina attraverso un’interfaccia grafica ed una
automatica nella quale è stato implementato un algoritmo di ottimizzazione
che successivamente verrà descritto. Quando nessuna delle due manualità
risulta attiva,il controllore di wind farm viene disattivato, lasciando che le
macchine si regolino in maniera autonoma.
Nella modalità automatica è stato implementato un algoritmo di ottimiz-
zazione di tipo ”Simulated Anneling”. Questo è un algoritmo metaeuris-
tico per l’ottimizzazione globale di problemi non lineari. La sua peculiarità
è quella di avere un parametro chiamato ”temperatura” che diminuendo,
riduce progressivamente la probabilità che vengano accettate delle soluzioni
che non migliorano la cifra di merito, condizione necessaria ad evitare che
l’algoritmo trovi un ottimo locale e non globale.
Il Capitolo 3 continua presentando il modo in cui è stato tarato l’algoritmo,
e particolarmente il parametro ”temperatura”, che risulta essere quello più
difficile da calibrare dal momento che la probabilità viene gestita da una
funzione esponenziale della temperatura e del ”salto” che la cifra di merito
compie da un’iterazione all’altra.
Dopo aver dimostrato la convergenza dell’algoritmo attraverso un modello
numerico, appositamente sviluppato basandosi sul modello di scia di Park,
vengono presentati i risultati numerici e successivamente quelli sperimentali
realizzati al banco prova.
I risultati sperimentali evidenziano che il controllore della macchina è in
grado di inseguire delle traiettorie parzializzate ed è in grado di passare da
una all’altra secondo un gradiente definito in fase di progettazione senzaXXI
nessun tipo di problema. Infine viene dimostrata la capacità del Super-
controller di raggiungere il valore di parzializzazione ottima in un tempo di
10 minuti. Confermando quindi con successo la capacità del Super-controller
e garantendo quindi la possibilità di effettuare dei test in galleria del vento
con un modello perfettamente funzionante.
Non è stato possibile tuttavia realizzare le prove in galleria del vento
in tempo utile a causa di un guasto avvenuto ad una delle due schede di
condizionamento del segnale degli estensimetri che permettonono di misurare
la coppia sul rotore. Senza il feedback degli estensimetri risulta impossibie
realizzare il controllo in coppia e quindi controllare la macchina in galleria
del vento. Tuttavia, i risultati ottenuti sul banco prova risultano essere di
ottima qualità e dimostrano il funzionamento del controllore e, non appena
verrà riparata la scheda, verrà programmata la prova in galleria del vento.
Nell’ultimo capitolo vengono riassunti i risultati ottenuti, vengono de-
scritti gli sviluppi futuri di questo progetto e le modalità con cui verranno
eseguite le prove in galleria, portando all’attenzione alcune considerazioni
che andranno considerate effettuando la prova in galleria.XXII
Chapter 1
Introduction
1.1 Wind energy
The increasing cost of all the energy products based on fossil fuels as well
as to the increasing sensitivity from modern societies and political world for
environmental issues, followed by ambitious objectives of gaseous pollutants
reduction in the atmosphere, has forced the major industrial countries to
diversify the sources for energy supply. In this overview, renewable energies
and particularly wind energy is experiencing a moment of great expansion as
one of the most competitive sources for energy supply, having every year a
great increase in energy production as it is possible to see from Fig. 1.1 and
Fig. 1.2.
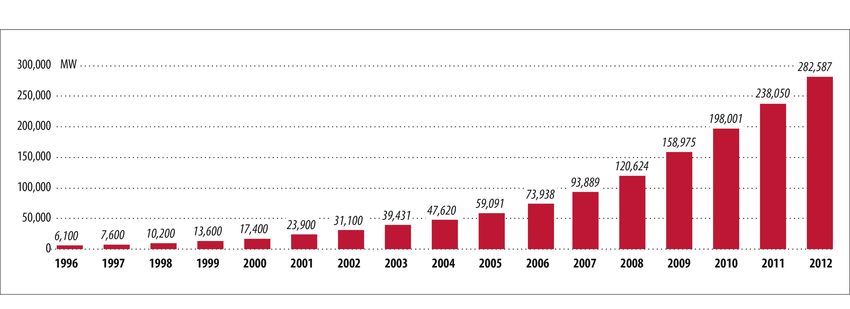
Figure 1.1: Global annual installed wind capacity 1996-2012 (source:
GWEC)
In the last ten years the wind energy production has increased from 31
GW (2012) to 282 GW (2012), with China at the first place with a production
of 75 GW. Italy is set at the fourth place in Europe and at the seventh in2 Chapter 1. Introduction
Figure 1.2: Global cumulative installed wind capacity 1996-2012 (source:
GWEC)
the world with about 8 GW.
In this regard, the European Union (EU) has set the goal to achieve 20 %
share of renewable energies in the overall energy consumption by 2020 and it
is expected that wind energy will have a major role in achieving this target.
Until now, a huge effort has been made by companies operating in the
wind sector and by national governments in terms of financial support to the
research, whose contribution to innovation has allowed the development of
even more efficient and high-tech wind turbines.
Furthermore, it is also quite clear as the final goal research and innova-
tion should focus on, is to lower the cost of wind energy, which has become
competitive when compared to the price of energy produced by traditional
sources, like fossil fuels. However, the latter has not been reached yet and
constant research and development is therefore needed.
1.2 Wind farms
At the present moment, wind energy production is principally organized in
wind farms, that allows to reduce the required areas and that can be located
onshore or offshore, with respective limits and advantages. Offshore wind
is steadier and stronger than the on-land one and having less visual impact,
but construction and maintenance costs are considerably higher. By contrast,
onshore farms present opposite features: they have more visual impact, while
construction and maintenance costs are lower.
As said, one of the most important target of research is the reduction of
the cost of energy (CoE). There are various ways to reduce the cost of wind
power production, for example: site selection, site layout(see [3] and [4]),
optimal design, predictive maintenance and optimal control system design1.2. Wind farms 3
(see [1]). In the past, most of the research has focused on stand-alone wind
turbines, having the main purpose of increasing power production and reduc-
ing the loads experienced by the wind turbines, principally in order to reduce
fatigue and extend the operative life of the machine (see ref [5], [6], [7], [8]).
Recent research has changed the target, working principally on wind
farms performance, maximizing the total power production (instead of each
individual one, which could be sub-optimal) and only a limited part includes
load aspects in their objective functions, as explained for example: in [1],
in [9], in [10], in [11], in [12], in [13], in [14], in [15] and in [16].
The development of a wind farm control can be justified by simple remarks
that will be explained in the following.
Considering an actuator disc model of a wind turbine with stream tube
boundaries shown in Fig. 1.3, given the far upwind wind velocity of V∞
and the far downwind wind velocity Vd , it is possible to define the axial
induction factor a as the parameter that describes the slowing of the wind
speed between the free stream and the rotor plane:
V∞ − Vrotor
a= (1.1)
V∞
The downwind wind speed is defined in Eq. 1.2:
Vd = V∞ (1 − 2a) (1.2)
So the power extracted by the actuator disc is given by eq 1.3
1
P = ρAV∞2 4a 1 − a2
(1.3)
2
where A is the ”swept area” of the rotor.
Figure 1.3: Actuator disc. The actuator disc describes the wind speed in
proximity of an ideal wind turbine using the Momentum Theory
Considering a simplified wind farm, made up only of two wind turbines,
in which one turbine is directly upwind to the other, it results immediately
evident that a coordinate control of the wind farm is necessary. This simple4 Chapter 1. Introduction
analysis assumes that wind turbines are far enough apart and that Vd is the
value of both downwind wind velocity for the upwind turbine, and the upwind
wind velocity for the downwind turbine. An isolated wind turbine maximize
the extracted power with a = 13 . However, considering this value of axial
induction factor in conjunction with Eq. 1.2 the downwind wind velocity for
the upwind turbine results Vd = 13 V∞ . By reducing a, Vd increases and the
results of this simple analysis are represented in Fig. 1.4. In this graph, the
power per unit of area is presented as a function of the axial induction factor.
From this graph it is possible to see that a = 13 doesn’t represent the best
condition, and that total power is maximized for a = 0.2
Figure 1.4: Power extracted from wind vs axial induction factor
These simple remarks hints that, through a wind farm control, decreasing
the upstream wind turbine power, it is possible to increase the power pro-
duction of the entire wind farm, and increasing wind farm power production,
the CoE can be reduced and consequently wind energy becomes still more
competitive.
At present, wind farm control is a relatively unexplored field and, as a
results, literature presents a large number of approaches. Principally, the
proposed methods change the control strategy, passing from individual and
”greedy” control of the turbine to centralized algorithms which modify a base
turbine algorithm to integrate it in an enhanced global performance.
Many studies focus the attention on realizing model based controllers,
including in the objective functions complex mathematical models for wind
turbines and for wake. However, the lack of models apt to describe the com-
plete interaction dynamic of a large number of wind turbines leads to the idea1.2. Wind farms 5
of realizing free-model controllers (see [11] [15]) or, as an alternative, con-
trollers based on very simple models that describe only the main behaviour
physical phenomenon.
In [16], a model based wind farm controller has been developed in order
to optimize the loads and the power distribution. An optimizer takes into
account the power produced by every single wind turbine and the loads oper-
ating on it, solves the optimization problem and sends back a new power set
point to each wind turbine. The set point is then received by each wind tur-
bine and its controller operates to maintain it. However, the author doesn’t
explain the control policy that the wind turbine controller follow to perform
the power set point received.
In [11] a model-free controller is developed in order to maximize the total
power output of a wind power plant by taking into account the wake effect. In
this solution each wind turbine adapts its control settings on the informations
that it receive from neighbouring turbines. The total power optimization is
performed using a gradient-based optimization. Then, a comparison is made
with the results obtained though the approach proposed in [15]. Even in this
case, the authors don’t explain how the wind turbine controller operates in
order to perform the set point received.
Figure 1.5: Example of wake generated in a wind farm
Reference [15] proposes a model-free approach using game theoretic meth-
ods. In these references, Marden, Ruben and Pao showed a wind farm con-
troller that aims to maximize the total power using a game theories, de-
centralizing the control from the wind turbines. Each turbine doesn’t have6 Chapter 1. Introduction
access to the functional form of the power generated by the wind farm and
can’t access the choices of other turbines.
Both [15] and [11] have based their studies basing on a largely diffused,
extremely simple model of wake largely diffused: the Park model that will be
fully presented and discussed in the following chapters. This mathematical
model describes the effect of the wake as a wind speed deficit through simple
geometrical considerations and thanks to its simplicity it is one of the most
prevalent and studied model of wakes (for example see ref [17]).
The Park model is not the unique model present in literature. Indeed,
a more complex example of mathematical wake model can be found in ref.
[18], where a wind model, developed for studies on the dynamic interaction
between wind farms and power system, is presented. As a conclusion, it
is possible to realize that also wake models represent a challenging field in
which constant research is required in order to obtain more reliable models,
improving the results on wind farm controllers.
Eventually, it is important to highlight that the main benefits are ob-
tained analysing the way turbines affect each other through their wakes
and trying to reduce their intensity, adjusting blade pitch and generator
torque (see [1] [15] [14] [16] [13] [3] [11] [12]), or, as an alternative, directing
these wakes using yaw actuators to deflect the wake downstream of the rotor
(see [10]).
1.3 The Approach
The great expansion that wind energy is experiencing offers the possibility to
experiment a large number of solutions of different nature. In the last years,
three principal kind of approach have been developed to test and study new
wind farm controllers that will be presented and discussed in the following
paragraphs.
The first one is realized on real wind turbines, using wind farms available
to research. This approach represents the ideal case, having the advantage
of using a real condition and inducing a real wake on other wind turbines.
Nevertheless, the disadvantage is represented by the lacking of concrete pos-
sibility of testing wind farm control laws for research, principally because
companies don’t make available their wind farms for safety and economic
reasons.
The second and most widespread approach is the use of numerical sim-
ulations, through advanced CFD codes or aeroelastic software (see [1], [6]).
This approach gives the opportunity to obtain results simply through a com-
puter, reducing the costs and the complexity of realizing a real or scaled1.3. The Approach 7
Figure 1.6: Hywind. The world’s first full-scale floating wind turbine
wind turbine. However, the accuracy of these results must be verified and
the ability of reproducing every feature of the physical phenomenon must be
demonstrated. Particularly, the most important limit is given by the diffi-
culty of reproducing in an accurate way wakes physical phenomena, because
they are characterized by strong turbulence. Moreover, another important
limit of this approach is the required time, a single test condition requires
many hours and a sufficient computing power.
Figure 1.7: Example of numerical simulations. [1]
The third approach is represented by tests in the wind tunnels. This
kind of approach is not as widespread as the numerical one, since an ade-
quate structure is required and also because the scaling laws impose different
limitations to the model: the mismatch between the Reynolds number of the8 Chapter 1. Introduction
full scale wind turbine and the one of the scaled model, the difficulty of re-
producing the elasticity of the structure of the wind turbine and the ability
of reproducing in the wind tunnel the true conditions of the wind.
On the other hand, the advantages consist in having: lower costs, a better
control, a major safety and, especially when the effects in a wind farm are
studied, the opportunity to operate with real wake conditions and not with
a wake based on a mathematical model.
Moreover, the wind tunnel tests also allow to modify wind farm con-
figurations in less time, to operate with faster timescales and to develop a
controller able to face problems similar to the ones affecting the full scale
wind turbines.
The presented overview, as well as the availability of two wind turbine
models developed by Politecnico di Milano in W T 2 project context has lead
to the opportunity of developing a real time wind farm controller in order to
start the study of wind farm control laws in the wind tunnel.
1.4 W T 2 Project
The W T 2 is a project developed by the Department of aerospace science
and technology of Politecnico di Milano, sponsored by Vestas, world leader
company in wind energy, with more than thirty years experience in wind
turbine projects. The purpose of this project is the development of a multi
Mega-watt wind turbine model in aero-elastic similitude, adequate for the
wind tunnel experimentation.
The model aims to be a complementary element in the project phase of
wind turbines, which, at the present moment, is based on several iterations
between numerical simulations and 1:1 scale experimentation.
The actual approach principally shows two problems:
1. Uncertainty of the results of aero-elastic code, particularly in a case of
extreme conditions, as defined by the norms.
2. Lack of experimental data in extreme conditions, caused by the excep-
tional nature of the phenomena.
Considering this overview, the development of models in aero-elastic simil-
itude, adequate for wind tunnel experimentation, in a controlled and safe
environment offers the opportunity to develop wind turbines control laws
research and to reproduce those infrequent extreme conditions, otherwise
difficult to be observed in a real contests.1.5. Innovative content of the thesis 9
The model realized is a scaled reproduction of Vestas V90, a 3MW wind
turbine with horizontal axis and 90m rotor diameter. At the present mo-
ment, the Department has realized a second identical model, opening the
opportunity to study and develop wind farm control laws.
1.5 Innovative content of the thesis
The innovative content of this work is the development of a controller able to
perform a wind farm real-time control in the wind tunnel adopting a power
set-point and simple to be integrated in a preexisting system.
The use of a simple power set-point allows to avoid the elaboration of
complex mathematical models that lead to the possibility of approximating
the physical phenomenon, by contrast, in this kind of approach the only error
is given by the torque and rotor speed measures.
The versatility of this wind farm controller allows, in every moment, to
change the optimization algorithm with another one and test it in the wind
tunnel, on a real wind farm and with a real wake interaction.
The wind tunnel experimentation represents, at the present moment, a
great opportunity for the wind energy research, but particularly for wind
farm control research, indeed, in this environment it is possible to study
the effects of a real wake generated by the upstream wind turbine on the
downstream one and, for this reason, to obtain results more close to the full
scale wind turbine, instead of mathematical models that are not able, at the
present moment, to describe the complete physical phenomenon.
The wind tunnel experimentation of wind farms requires more reliable
control solution, avoiding the study of such control solution that unattainable
on real wind farm applications and allowing to face those problem that a
theoretical study can’t present.
1.6 Thesis Outline
The aim of this thesis work is the realization of a wind-farm super-controller,
in order to maximize the total power produced by the two models V2 de-
veloped by Politecnico di Milano in the project W T 2 , and the test of the
controller in the wind tunnel environment.
The thesis is organized according to the following plan:
In chapter 2 the experimental set-up is presented. The wind tunnel envi-
ronment is described, the V2 models are presented by the description of the
onboard sensors, torque and pitch system, as well as the real-time control,10 Chapter 1. Introduction
the model management system and the support tools that were designed for
the testing, calibration and maintenance of the models.
In chapter 3, the author focuses more the attention on how the wind
farm controller has been realized, starting from the stand-alone wind turbine
control, describing how the stand-alone control has been integrated in the
wind farm one, through the use of the ”ISO-TSR” approach, developed to
partialize the wind turbine power trajectory. Moreover, the chapter continues
more practically, describing the wind farm controller, how the communication
between the wind farm controller and the wind turbine one is performed and
the control logic. Eventually, the chapter describes how this controller has
been tested through the use of a simulated annealing algorithm, tuning the
algorithm parameters through numerical simulations and finally testing it
with test-bench simulations.
In chapter 4, the conclusions of this thesis work are presented, together
with the limits and the strength points. Finally, the future developments of
this work will be presented.Chapter 2
The experimental set-up
In the chapter the tools and the experimental set-up that have been designed
and used for the work will be described. In the first part, all the instrumen-
tation required for the tests in the wind tunnel of Politecnico di Milano will
be described. Afterwards, a complete description of the V2 models together
with the support tools designed for test-bench and numerical tests are pre-
sented.
2.1 The wind tunnel
The GVPM [19] is the close circuit wind tunnel which has been used to
perform all the tests of this project. The wind tunnel has two test sections: a
low turbulence level test section, ideal for aerospace engineering applications,
and a boundary layer large dimensions test section, built in the return tube,
for civil engineering applications.
Figure 2.1: Plant configuration of the GVPM wind tunnel
The civil (boundary layer) test section (Fig. 2.2 ), is set on the second
floor of the building, in the return tube and has an overall dimension of 3.84
x 13.84 x 36 [m] - respectively the height, width and length - that allows to12 Chapter 2. The experimental set-up
perform tests on very large models with low blockage effects and to reproduce
atmospheric boundary conditions. In this section it is possible to achieve a
maximum velocity of 14 [m/s].
The aeronautical test section (Fig. 2.2) is placed at the ground height,
it has a section area of 4 x 3.84 [m], that allows to achieve a maximum flow
velocity of 55 [m/s].
Figure 2.2: Civil (left) and aeronautical (right) test section details.
2.2 Wind turbine models
The wind turbine models used in this work are the results of the project W T 2
(1.4). They have been realized and developed at Politecnico di Milano in a
three year-collaboration with VESTAS. The complex scaling criteria adopted
during the project of these models have been fully described in ref [2] and
lead to the scaling requirements reported in Tab. 2.1 .
Quantity Scaling factor
Length 1 : 45
Time 1 : 22.84
Speed 1 : 1.97
Power 1 : 15477
Rotor speed 22.84 : 1
Torque 1 : 353574
Reynolds 1 : 88.64
Froude 11.6 : 1
Mach 1 : 1.97
Table 2.1: Scaling factors used for mapping the V90 into the model charac-
teristics [2]
The scaling models, here named V2, will be briefly described in the fol-
lowing paragraphs.2.2. Wind turbine models 13
2.2.1 General design
In Tab.2.2 the final dimensions of the models have been reported, adopting
the scaling factors proposed in Tab.2.1
Quantity Requirement
Rotor diameter [mm] 2000
Rotor tilt [deg] 6
Rotor cone [deg] 4
Rotor over-hang [mm] ≈ 80
Nacelle height [mm] ≈ 90
Nacelle width [mm] ≈ 90
Nacelle length [mm] ≈ 215
Spinner diameter [mm] ≈ 90
Tower height [mm] ≈ 1800
Table 2.2: Main dimensions of the scaled model [2]
2.2.1.1 Nacelle design
In Fig. 2.3 it is possible to observe the nacelle of the model. The main
structural element of the nacelle is a rectangular carrying box, that provides
the right stiffness to the entire nacelle group. Three electronic control boards
(one for each actuator) are placed behind the box, welded on a flexible circuit
and fixed to a triangular prism that rotates with the shaft. The electronic
boards communicates with the control system thanks to a slip ring installed
in backside of the nacelle.
The main shaft is mounted on two bearings and it was accurately designed
to reproduce the 1st in-plane collective rotor mode of the full-scale turbine.
The rotor azimuthal position is measured thanks to an optical encoder
installed on the shaft. A three-axial accelerometer is fixed at the top of the
tower measuring its accelerations. A double gear, with ratio reduction factor
of two, allows the transmission of rotation between the shaft and the motor,
positioned inside the top of the tower(Fig. 2.4). The motor provides the
torque and it is connected to the gear through a flexible joint, balancing the
6 degrees of up-tilt. Finally a V90-similar nacelle cover is mechanically fixed
above the carrying box to ensure a satisfactory wind flow quality.
2.2.1.2 Rotor and blade design
In Fig. 2.4 the final configuration of the rotor and blades layout is repre-
sented. The model rotor has been designed to allow the fastening of each14 Chapter 2. The experimental set-up
Figure 2.3: Nacelle arrangement
Figure 2.4: Scheme of torque transmission components2.2. Wind turbine models 15
blade to the hub by means of a passing pin and, subsequently, the fixing of
the entire rotor to the main shaft. This constructive solution ensures a rapid
assembly of the rotor and permits to use both rigid or aero-elastic blades
without changing the nacelle configuration.
Each blade hosts a pitch actuator with its relative built-in encoder. The
gear head backlash (±1 [deg]) of the selected pitch motor is removed us-
ing a torsional spring, which joints the blade root and the fixed-to-the-hub
component. Another electronic board is placed in front of the rotor hub and
provides power supply, conditioning and A/D conversion of the strain gauges
bridges. Finally, a V90-similar spinner is mechanically fixed to the hub in
order to ensure a satisfactory wind flow quality central rotor area.
2.2.1.3 Aerodynamics
The aerodynamic rotor design represented one of the key argument in the
design process of the V2 model, in fact, in [2] an entire chapter was reserved
to the aerodynamic description and to the identification process required to
obtain reliable numerical results. The importance to the argument is due
to the need of having a realistic aerodynamic performance of the model if
compared to the multi-MW ones, principally in terms of power, thrust, and
optimal TSR.
The optimal TSR constraint implies that the model should have the same
solidity of the the reference rotor. For this reason it was decided to maintain
the same chord distribution of the V90, with marginal modifications in the
blade root region to take into account that the distance between the model
hub center and the blade root is slightly greater than the V90 scaled one.
The choice of the airfoil was driven by the great mismatch between the
Reynolds number, which in V90 is about 4 ÷ 5 · 106 while in V2 is 5 ÷ 6 ·
104 . In the past years a large number of research studies were conduced on
aerodynamics at Reynolds number lower than 105 , with great benefits in a
large number of applications.
Much literature search was then carried out to identify the profiles to
be used, and the choice cast on the profiles AH79-100C and WM006, whose
shape is reported in Fig 2.5.
Particularly, the airfoil AH79-100C was used in the inboard section for
η = r/R ∈ [0.137, 0.423], while WM006 in the outboard one for η ∈ [0.654, 1].
Interpolations of the cross sectional shapes were limited to a relatively small
transition region between the inboard and outboard sections, i.e. for η ∈
[0.423; 0.654], and at the root region to smoothly deform the inboard airfoil
into the blade root cylinder.
In [2], after having designed the model blade and identified the method to16 Chapter 2. The experimental set-up
AH79100C WM006
0.2 0.2
y/c [−]
y/c [−]
0.1 0.1
0 0
−0.1 −0.1
0 0.2 0.4 0.6 0.8 1 0 0.2 0.4 0.6 0.8 1
x/c [−] x/c [−]
Figure 2.5: Model airfoils shape.
correct the aerodynamic performance from the wall blockage effects, a tool
to identify the blade airfoils polar directly from experimental tests was devel-
oped. Indeed, not negligible deviations were expected between the estimated
and measured rotor performance. Particularly, real airfoils polar could be
different from the estimated ones due to:
Uncertainties on real blade shape: in the outer region of the blade,
chord is extremely small, for this reason, it is difficult to manufacture
a composite-made blade with the correct desired shape, due to molds
machining tolerances as well as to the unavoidable manual edging;
X–foil poor capability to predict, with good accuracy, the polar data at
low Re, specially with forced transition;
Effectiveness of the designed strips in inducing the transition, and their
effect on the aerodynamic characteristics.
Thanks to the identification tools explained in [2], it was possible to use
the identified airfoils polar data to improve the ability of the Cp-Lambda code
to predict the behaviour of the V2 model airfoil, obtaining numerical results
more close to the experimental ones.
2.2.1.4 Tower design
The tower was designed so that the first fore-aft and side-side natural fre-
quencies of the model match the scaled ones of the real wind turbine. This
result was obtained opportunely projecting the thickness distribution of the
tower, keeping in mind the constraint of having an external diameter as
closed as possible to the V90 scaled one. This constraint allows to capture
the principal aerodynamic interference between tower and rotor. The tower
is mounted on a balance capable of measuring the three force and three mo-
ment components acting at the tower base. Finally, compressed air is blown
in at the tower foot to cool the torque motor before escaping from a small
hole in the back part of the tower top.2.2. Wind turbine models 17
2.2.1.5 Sensors
The installed sensors are the ones necessary for the traditional control of
a multi-MW wind turbine. The data coming from the sensors available on
board are collected by the control system. They are used by closed loop
control algorithms which drive the actuators and by the supervisory system
that manages the possible machine states and handles emergencies. The
model is equipped with:
Sensors for measuring the pitch angle of every blade with ±0.2 [deg]
accuracy.
An optical encoder for azimuth angle measuring, in order to allow test-
ing of individual pitch control algorithms. The azimuth data are also
used to get the rotor speed through numerical derivation;
A three-axial accelerometer that measures the tower fore-aft and side-
side accelerations. These data are used for monitoring purposes and
can also be used as feed-back signals by control algorithms that actively
dampen the tower oscillations.
Strain gauges for measuring the stresses acting on the tower, the main
shaft and the blades; these are the most commonly used measures for
control purpose.
A balance, positioned at the tower base, to measure the three forces
and three moment components acting at the tower base.
Two Pt100 probes are used for monitoring the winding and gear head
temperature of the torque actuator, with the supervisory system pro-
grammed to change the model state from POWER PRODUCTION to
IDLING condition in case of generator overheating.
2.2.1.6 Actuators and control
The requirements on actuators characteristics were derived from the direct
application of the scaling laws on the V90 technical data related to the ac-
tuation subsystem. The model is equipped with:
A torque actuator positioned inside the tower
Three pitch actuator positioned inside the blade root.18 Chapter 2. The experimental set-up
Torque control
Torque actuation is realized through a Maxon brushless motor EC-4-Pole-
30BL-200W, selected for its characteristics, i.e. rotational speed up to 400[rpm],
dimension compatible with space available at the top of the tower and a max-
imum power similar to the scaled one of the full scale system. The motor
can also operate as a generator and the produced electrical power dissipated
by a 12-75V/5.0 [Ω] Shunt Regulator chopper, connected to an external
6.8 [Ω] resistance, which allows to dissipate a continuous power up to 300
[W].
The actuator can be controlled in speed or in torque mode. Speed control
is performed using the motor encoder measure as feed-back signal and send-
ing the desired reference speed to the electronic control using a Can-open
communication protocol at data transfer speed of 500[kb/s]. The gains of
the 4-Q-EC-DES-50/5 internal PI speed controller were appropriately tuned
to achieve a good speed reference tracking with low level of speed and current
oscillations.
Usually, in small size wind tunnel model, torque control is realized in
open-loop, taking advantage from the well-known relationship present be-
tween Torque and current T = KQ i. However, in V2 model, there are several
difficulties attending:
Rotor speed varies depending on the system operating region
Temperature is subject to considerable variations during operation, be-
ing the motor used at the limit of its capacity
Nacelle bearings and gear-head provide variable and difficult to predict
friction torques
Having considered all these complications, during the project it was devel-
oped a closed-loop on torque, implemented on Bachmann M1 real-time system
whose output is a current reference sent to the motor electronic control.
The need of a fast response of the system lead to oscillations of consid-
erable magnitude. The suppression of these oscillations was provided with a
feed-forward (Fig. 2.6), that allowed disturbance rejection without limiting
the controller speed.
Pitch control
Pitch actuation is performed with the Faulhaber brushed motor 1724T0
18SR, that provides accuracy and repeatability of pitch positioning, a di-
mension compatible with the housing space available in the blade root, a
maximum pitch rate high enough to allow emergency shut down operations2.2. Wind turbine models 19
Figure 2.6: Torque control loop.
and a bandwidth sufficiently wide to ensure individual pitch control capabil-
ity.
Each pitch actuator is driven by its own control board and all the three
control boards are nodes of the same Control Area Network (CAN) using a
Can-open communication protocol at data transfer speed of 500[kb/s].
2.2.2 Real-time supervisor
The model is equipped with a hard-real-time system, capable of acquiring the
readings of all the installed sensors on the model, as well as the data related
to the wind tunnel environment, it and uses them to apply sophisticated
control algorithms sending output set points to the actuators, reproducing a
supervisor as closed as possible to the real wind turbine one.
Every 4 [ms], the M1-CPU takes all the sensors reading inputs and sends
as outputs pitch and torque demands to to the actuators.
2.2.2.1 Model state machine
Every real wind turbine is managed by a supervisor that is able to switch
through different states of the machine basing on the operational conditions
or situations (start-up, energy production, emergency, etc.). The logic op-
erating on the scaled model, resumed in Fig. 2.7, represents an augmented
version of the one implemented in a real machine, since it is necessary to
handle additional operating conditions.
At the beginning of each test, the machine changes from IDLING, with
all actuators disabled, to the state of FUNCTIONALITY TESTING, where
the correct functioning of the model is verified and followed by the zero set-
ting of the sensors readings and pitch actuators encoders. If the model check
is successful, the state is changed to PARKING and the wind turbine oper-
ates in standing still condition. Successively, the user can decide to operatePuoi anche leggere