GROUNDWATER AND FLOOD EVENTS IN DIFFERENT HYDROGEOLOGICAL PERIODS: A CASE STUDY IN THE ASPIO RIVER (MARCHE REGION)
←
→
Trascrizione del contenuto della pagina
Se il tuo browser non visualizza correttamente la pagina, ti preghiamo di leggere il contenuto della pagina quaggiù
DOI: 10.4408/IJEGE.2019-01.O-01

        GROUNDWATER AND FLOOD EVENTS IN DIFFERENT HYDROGEOLOGICAL
           PERIODS: A CASE STUDY IN THE ASPIO RIVER (MARCHE REGION)

                                                       Davide FRONZI & Alberto TAZIOLI

                              (*)
                                    Università Politecnica delle Marche - Dep. SIMAU - via Brecce Bianche, 12 - 60131 Ancona, Italy
                                                            Corresponding author: a.tazioli@staff.univpm.it

EXTENDED ABSTRACT
     Ad oggi, la modellazione idrologica rappresenta un aspetto essenziale nella caratterizzazione e determinazione del comportamento di
un corso d’acqua. A partire dagli anni ’60, la comprensione e l’analisi dei fenomeni naturali è stata accompagnata da un crescente interesse
verso i software di modellazione e di calcolo, che ha portato ad un crescente sviluppo e divulgazione di procedimenti di calcolo automatizzati
mirati inizialmente a semplificare le procedure di valutazione dei singoli componenti. Nella maggior parte dei casi essi determinano in
maniera reale il comportamento dei fenomeni a partire da singoli dati puntuali raccolti in maniera discontinua, talvolta essi sottostimano
o si discostano dal comportamento reale, soprattutto per quanto riguarda singoli eventi estremi che interessano bacini fluviali di ridotte
dimensioni. Il lavoro ha come obiettivo principale quello di valutare i fattori che contribuiscono alla formazione della portata fluviale in un
piccolo bacino avente un’estensione di 29 km², situato in Italia centrale in prossimità del Monte Conero; in che modo tali fattori incidono
sull’aumento del rischio idraulico e come sono relazionati alla durata e all’intensità degli eventi meteorici. L’attenzione è focalizzata sul
contributo delle acque sotterranee ed in particolare su come la modellazione idrologica risponde agli input del livello piezometrico in eventi
di piena improvvisa che si verificano in periodi idrologici differenti, suggerendone delle strategie per migliorarne la capacità previsionale.
Il bacino di studio è caratterizzato da un elevato tasso di popolazione, attività commerciali e importanti vie di comunicazione. Dal punto di
vista geologico esso coinvolge i termini argillosi, argilloso-marnosi e sabbioso-ghiaiosi Plio-pleistocenici del dominio Umbro-marchigiano.
Il reticolo fluviale è caratterizzato da due rami secondari che confluiscono in un ramo principale, al termine del quale è posizionata una
stazione idrometrica con un sensore di registrazione in continuo per il quale è stata messa a punto la scala di deflusso. Il bacino è altresì
attrezzato con un sensore di misurazione in continuo del livello piezometrico e con alcune stazioni pluviometriche. Delle campagne
di analisi infiltrometriche con doppio anello sono state effettuate in diversi periodi idrologici per determinare i valori di conducibilità
idraulica dei depositi superficiali, intesi come coltri di alterazione delle diverse litologie sottostanti. A partire dall’intersezione tra categorie
di uso del suolo e le classi di permeabilità dei depositi superficiali è stato applicato il metodo del Soil Conservation Service basato sulla
determinazione del Curve Number. Tale parametro definisce la capacità che tale intersezione favorisca o meno il ruscellamento superficiale
a discapito dell’infiltrazione sub-superficiale e profonda. Operando in ambiente GIS sono stati ricavati i principali caratteri morfometrici
utili a determinare i tempi di corrivazione per i sottobacini in esame. Attraverso il software di modellazione idrologica HEC-HMS sono stati
analizzati tre eventi meteorologici intesi che hanno coinvolto il bacino di studio nei mesi di maggio 2015, febbraio e marzo 2018; essi sono
caratterizzati da diversi input di precipitazione (durata ed intensità) e da un diverso andamento del livello piezometrico. L’inserimento dei
dati di pioggia registrati da tre stazioni pluviometriche per ciascun evento, dei tempi di corrivazione e del valore di Curve Number medio
per ciascun sottobacino, ha permesso di determinare, mediante modello, la portata transitata alla sezione di chiusura considerata. Tale
portata è stata confrontata con quella misurata in continuo mediante il sensore in alveo. Gli eventi manifestano un trend molto diversificato
e non sempre di immediata interpretazione. Il comportamento della portata determinata tramite il modello si adatta bene all’ andamento
delle portate misurate, soprattutto in prossimità del picco; alcune discrepanze si osservano nelle fasi post picco dove le portate determinate
tramite il modello sottostimano quelle misurate durante gli eventi. Tale comportamento è attribuibile principalmente all’influenza delle
acque sotterranee che tendono a mantenere alta la portata che transita nel corso d’acqua. L’influenza delle acque sotterranee, e nello
specifico del livello piezometrico, si ripercuote anche nella risposta che il corso d’acqua ha ai diversi input di precipitazione. Si osserva
inoltre che i due rami secondari del corso d’acqua rispondono in maniera differente alla formazione della portata in funzione delle diverse
litologie sui quali si impostano. Con il presente studio si sottolinea l’importanza di accoppiare i software di modellazione idrologica alla
misurazione in continuo del livello piezometrico, non solo finalizzata al dimensionamento delle opere in funzione del valore della portata
al colmo, ma anche alla valutazione dell’esposizione delle stesse a condizioni critiche prolungate nel tempo. Tale metodologia andrebbe
implementata in bacini idrografici caratterizzati da differenti coperture litologiche, in modo da verificare in modo più esteso l’influenza
delle acque sotterranee sul rischio idrogeologico a scala di bacino.

Italian Journal of Engineering Geology and Environment, 1 (2019)            © Sapienza Università Editrice                            www.ijege.uniroma1.it   5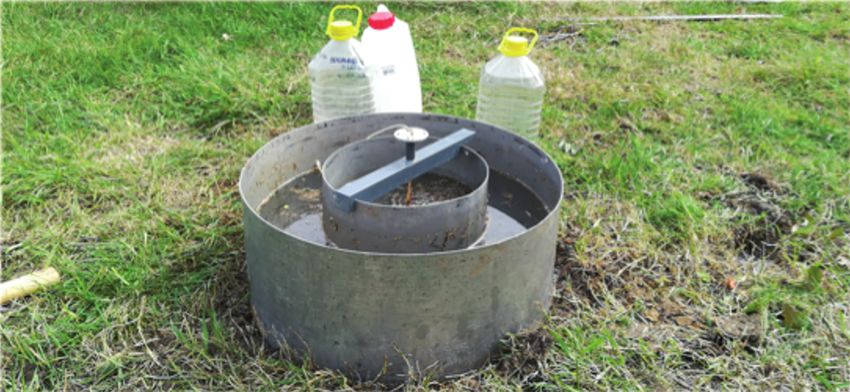
D. FRONZI & A. TAZIOLI

    ABSTRACT                                                                       modelling software and suggest some strategies to improve its
         When applying hydrological models at basin scale, it is                   forecasting efficiency.
    essential to take into account the contribution of groundwater and                  The novelty of this paper is its focus on the importance of
    its behaviour, together with the hydrological state before and after           taking into account, in hydraulic modelling, the continuous
    storm events. The main objectives of the present study were the                variation in piezometric level during a single storm event.
    evaluation and discussion of factors contributing to the formation of               For this purpose, a watershed located in central Italy and
    river discharge, how and to what extent these factors affect the risk          characterised by limited dimensions, very high population
    of flood and, finally, how they are related to the type, duration and          density, factories and commercial activities, together with a high
    intensity of rainfall events, especially associated with flash floods.         level of natural hazard (Tazioli et alii, 2015; 2010) was selected
         This was achieved by applying HEC-HMS models to a small                   for applying the hydrological model. The factors and properties
    watershed in central Italy, characterised by high hydrogeological              involved in the modelling processes were also investigated.
    risk. The watershed is equipped for total rainfall, river discharge                 These features are comparable with other watersheds of
    and groundwater level measurement. In addition, double ring                    limited dimensions, present in the Mediterranean area (Tazioli
    infiltrometric tests were performed during different hydrological              et alii, 2010).
    periods. The results highlighted a direct correlation between flood                 The most dangerous meteorological hazard in the
    risk and the hydrological period; the insertion of groundwater data            Mediterranean area, after droughts, is represented by floods,
    in the model allowed for a sensitivity analysis of the relationship            which are often related to human activities and their impact on the
    between the level of risk and the hydrogeological settings and                 environment are nowadays considered as a component of the local
    properties of the area. Moreover, the analysis of some “extreme”               climate. This is particularly true in European countries like eastern
    events occurring in the summer period highlighted river behaviour              Spain, southern France, Italy and Greece (Llasat et alii, 2010).
    in very different hydrological states.                                              The study methodology involved the use of a specific software
                                                                                   for hydrological modelling. Watershed modelling, before 1960,
    Keywords: equipped basin, flood, groundwater, hydrological models,             was limited by the inadequate capability of computers and by the
    natural hazard                                                                 availability of a restricted set of data. After 1960 hydrological
                                                                                   modelling started to become easier and more comprehensive,
    INTRODUCTION                                                                   thanks to the exponential growth of computer science. A short
         In the last decades, European political pressure has                      time later this modelling software was integrated into watershed
    increasingly focused on environmental problems, especially                     planning and management (Singh & Frevert, 2003).
    those produced by floods, with a specific emphasis on forecasting                   Despite a great improvement in the models over the years,
    and managing flood risk scenarios (Pappenberger et alii, 2005).                they still have some limitations, especially because they are based
         Although in the past extreme flood events mainly involved                 on a parametric implementation of known natural aspects, which
    big watersheds characterised by large dimensions and very long                 require necessary approximations of processes (Beven, 2001).
    water courses, nowadays flood risk is higher and more common                   According to Beven these limitations are associated to problems
    especially in small basins with a short runoff time (Pappenberger              of nonlinearity, scale, uniqueness, equifinality and the uncertainty
    et alii, 2005). These rainfall events are characterised by flash               of the models (Beven, 2001).
    floods linked to the change in meteorological events and this                       In general, hydrological models, despite their prominent value
    is particularly true in basins where human activities have had a               and worldwide utilisation, are not able to describe a changing
    strong impact (Tazioli et alii, 2015). In addition, natural hazard             system without the continuous use of field data. This is particularly
    assessment is needed for correct management of the basin,                      true when many models are developed from limited data sources,
    regardless of its dimensions, taking into consideration all the                and calibration testing on one or two catchments is an insufficient
    parameters and the phenomena occurring in the environment.                     test of a model’s universal applicability (Dunne, 1983).
    The importance and the benefits of studying both the risk of flood                  One of the key features of this study is its focus on these
    in small basins and the factors that contribute to creating the                limitations including the modelling of the groundwater level
    hazard, are based on the fact that the parameters and the variables            that also heavily influences the trend in hydrometric level and
    affecting the formation of flood can be evaluated more easily                  discharge flow in relation to the hydrological observation period.
    and show almost the same processes and properties that occur in                According to the latest hydrological models, the flow in saturated
    larger basins. This paper focuses on factors affecting flood events            zones is usually assumed to be two-dimensional horizontal.
    in different hydrogeological periods, paying particular attention              However, most comprehensive physically-based models solve
    to the correlation between flood behaviour and groundwater level               a three-dimensional ground water flow equation in order to
    trends, in order to identify some critical aspects of hydraulic                calculate the spatial and temporal variation in hydraulic heads

6   Italian Journal of Engineering Geology and Environment, 1 (2019)   © Sapienza Università Editrice                              www.ijege.uniroma1.it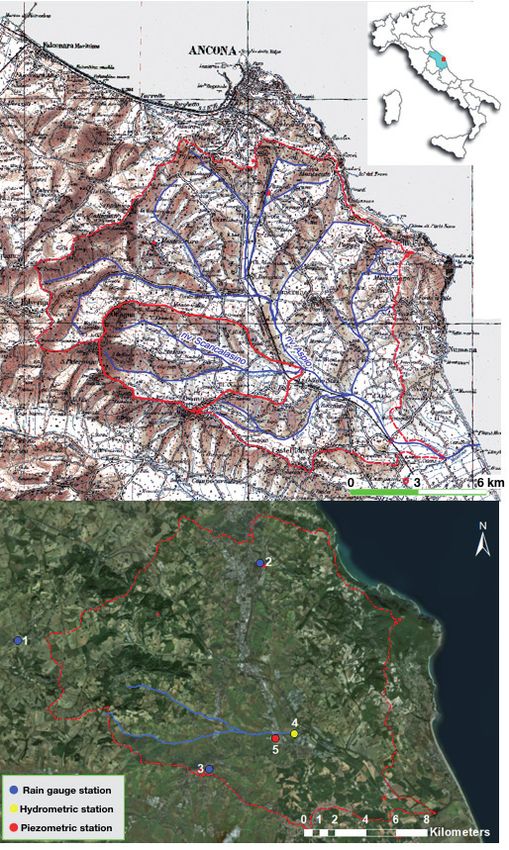
GROUNDWATER AND FLOOD EVENTS IN DIFFERENT HYDROGEOLOGICAL PERIODS: A CASE STUDY IN THE ASPIO RIVER (MARCHE REGION)

(Islam, 2011). According to Islam, modelling methods include:                        risk prediction especially when associated with the resilience
the gravity drainage scheme following a linear reservoir, the two                    of hydraulic works. In fact, it is not enough to model the peak
parallel linear reservoirs method, the storage discharge ratio; and                  instant when, on the contrary, most of the risk in some parts of the
the quasi three-dimensional cascade model.                                           basin is linked to the persistence of a certain hydrometric level or
    However, although all these models generally allow for a                         discharge flow over a long period of time.
good mathematical reproduction of groundwater behaviour, they                            Another key feature of this study consists in the fact that the
are based on only one or a few measured data at piezometric level.                   observations and remarks derived from the results can be exported
The behaviour of groundwater is simulated by the model in space                      to other basins with similar geological and hydrological settings.
and time and even if it gives a good response to the general trend                   The selected basin is the Aspio watershed, in the Marche region
of the flood event, it shows some discrepancy in certain parts                       (central Italy), located in the province of Ancona near the Adriatic
of the hydrograph. This discrepancy is not negligible for river                      coast and adjacent to Mt. Conero (Fig. 1). It is characterised by the

Fig. 1 - a) Location of the area studied b) Position of piezometric, pluviometric and hydrometric stations in the Scaricalasino sub-basin

Italian Journal of Engineering Geology and Environment, 1 (2019)         © Sapienza Università Editrice                                     www.ijege.uniroma1.it   7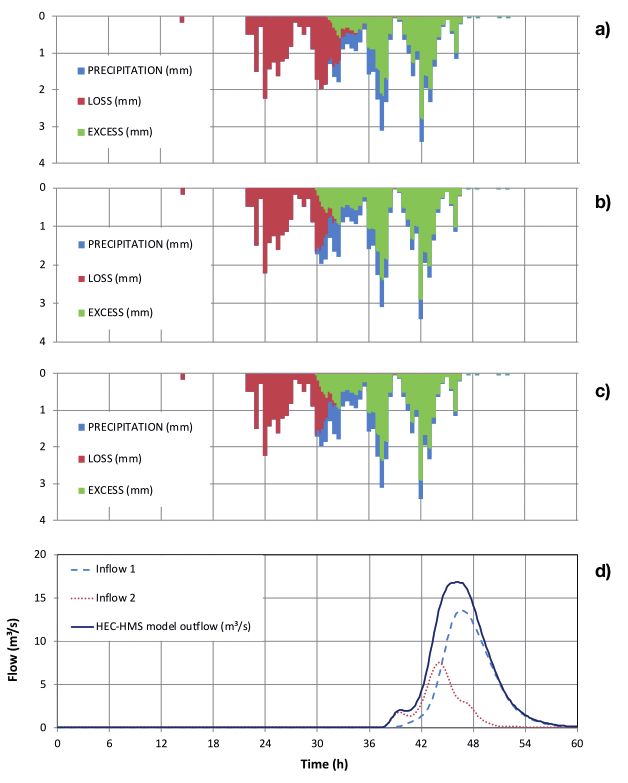
D. FRONZI & A. TAZIOLI
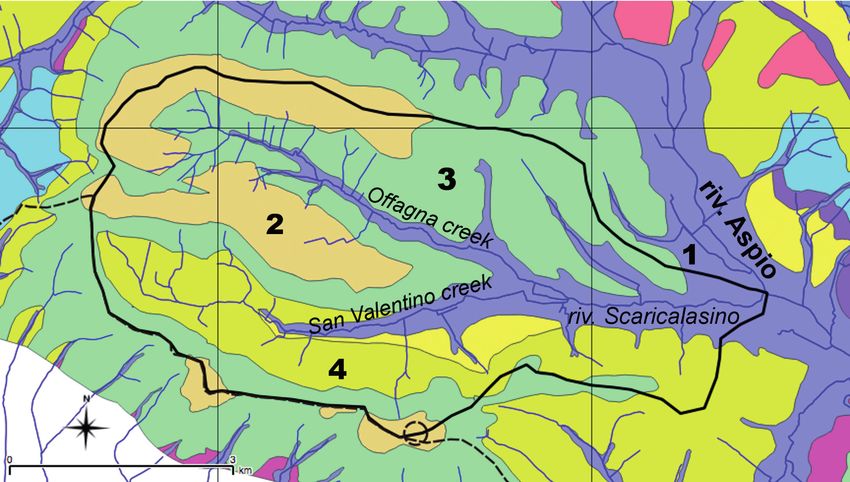
Fig. 2 - Geological map of the Scaricalasino sub-basin. The black line represents the watershed boundary. 1: alluvial deposits (Pleistocene); 2: alterna-
tion of sandstone, gravels and marly clay (upper Pleistocene); 3: alternation of sands (lenses) and blue marly clays (middle Pleistocene); 4: marly
clays (middle Pleistocene)
presence of low hill slopes with an undulating shape, and the main sandstone with clay layers) that covers the former sediments
water course is a tributary which merges with the River Musone giving rise to a particular morphology of ridges and depressions.
just 0.5 km from the coast line. In particular, the model was applied The Plio-Pleistocene basin developed along the tectonic lines and
to a 29 km² wide Aspio sub-basin called Scaricalasino (Fig. 1). underwent a compressive phase, which was responsible for the
In this paper the correlation between soil use, hydraulic final surfacing of the basin area (Bally et alii, 1986; Barchi et
conductivity of soil, alluvial plain groundwater level and river alii, 1998; Mirabella et alii, 2008). Quaternary continental covers
discharge flow during flood events was investigated in different (mainly consisting of silty clay and clayey sand, eluvial-colluvial
hydrological periods. deposits and a debris slope) are widespread in the watershed both
in the alluvial plains and on the slopes (AA.VV., 1991) (Fig. 2).
GEOLOGICAL SETTING Folds with gentle slopes and faults in the Apennine and anti-
The area studied is characterised by peculiar lithological and Apennine direction are present in the area. The NW-SE faults
geo-structural settings, deriving from geological events which show horizontal components and release the NE-SW structures
occurred from the Cretaceous to the Mio-Plio-Pleistocene period, (Nanni & Vivalda, 2009)
and affected the final arrangement of sediments and morphological
and tectonic forms (Nanni, 1980; Calamita & Deiana, 1986; MATERIALS AND METHODS
Scisciani, 2009). Meso-Cenozoic sequence outcrops (characterised The Aspio watershed is equipped with eight rain gauge
by limestone and marly limestone lithotypes and lifted by the stations, six hydrometric stations, three piezometric level
Miocene tectonics) are present in the higher zones of the watershed, stations, managed by the Università Politecnica delle Marche
by the sea, and are represented by the Mt Conero ridge (Mussi et alii, (UNIVPM) and the Regione Marche. One hydrometric station
2017; Coltorti et alii, 1987). Most of the slopes are represented and one piezometric station are located in the Scaricalasino sub-
by the Mio-Plio-Pleistocene sequence (consisting of marly clays, basin (Fig. 1).
marly clays with sandstone layers, clays and marly clays, sandy Infiltration tests, to determine the hydraulic conductivity
silty clays with sandstone layers, sands with gravel lenses and of soils (Tab. 1), were made at different points of each shallow
8 Italian Journal of Engineering Geology and Environment, 1 (2019) © Sapienza Università Editrice www.ijege.uniroma1.it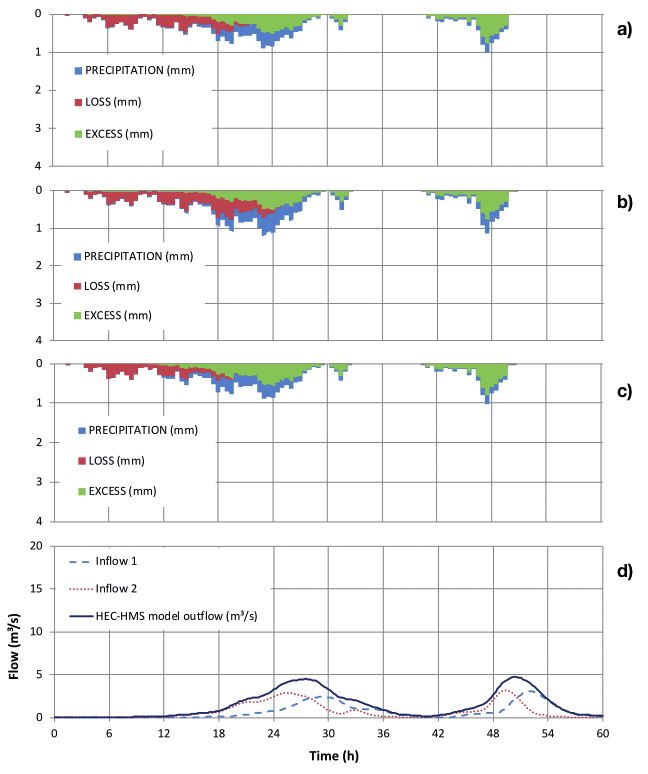
GROUNDWATER AND FLOOD EVENTS IN DIFFERENT HYDROGEOLOGICAL PERIODS: A CASE STUDY IN THE ASPIO RIVER (MARCHE REGION)

Tab. 1 - Hydraulic conductivity of soil (expressed in cm/s), determined
         for each type of shallow deposit (determined by the granulom-
         etric test)

deposit by means of a stainless steel double-ring infiltrometer (Fig.
3). Each shallow deposit is directly connected to the geological
substratum below it: the sand with gravel covers the alternation
of sandstone, gravels and marly clays, the silty sand and silty clay
deposits cover the alternation of sands and blue marly clays, while
the clay deposits are relative to the marly clay rocks (Fig. 2).
    The values in Table 1 were used, according to the Curve                     Fig. 3 - Stainless steel double-ring infiltrometer used in the field tests
Number- Soil Conservation Service (CN-SCS) method (National
Engineering Handbook of Soil Conservation Service, 1956), to
divide the shallow deposits into two classes. Alluvial deposits and
sand with gravel deposits are represented by soil class C of the CN-
SCS method. Silty-sand and silty-clay deposits and clay deposits
are represented by soil class D of the CN-SCS method (Tab. 2).
    Using QGIS ver. 2.18.4® (QGis Development Team, 2009),
the Scaricalasino sub-basin was divided into three other sub-                   Tab. 2 - Intersection table between soil use and soil category in the
basins which present uniform morphological characteristics. In                           study area. The values represent the Curve Number
order to determine the run-off time, a morphometric analysis was
carried out for each sub-basin.                                                     In order to apply the model, QGIS was used to determine
    According to the dimensions and the morphometric                            an average Curve Number for each sub-basin, starting from the
characteristics of the sub-basins, the run-off time was determined              intersection of the soil use shapefile (obtained from the Marche
using Puglisi’s formula (1) (Puglisi & Zanframundo, 1978):                      Region 2012 Corine Land Cover) with the shapefile of hydraulic
                       T = 6 L2/3 (hmax - h0)-1/3                 (1)           soil conductivity classes previously determined for each shallow
where T is the run-off time expressed in hours, L (expressed in                 deposit. For each polygon obtained by this intersection, a
km) is the length of the main water course, hmax (expressed in                  representative Curve Number was assigned, as shown in Table 2.
meters) the maximum altitude of the basin and h0 (meters) the                       Each CN value in table 2 is related to an average soil moisture
minimum elevation of the basin.                                                 condition, with an Antecedent soil Moisture Content (AMC),
    Three meteorological events, characterised by different                     taking into account the five days of precipitation prior to the
groundwater behaviour and different hydrological conditions                     analysed event. This CN is named CN (II) and it is different from
prior to the analysed event, were investigated using the Hydrologic             CN (I), which is related to dry conditions and CN (III) related to
Engineering Center- Hydrologic Modelling System (HEC-HMS)                       wet conditions before the analysed event as shown in Table 3.
®
  (Hydrologic-Engineering Center, 2000).                                            The average curve number for each sub-basin was calculated

Tab. 3 - Relationship between Antecedent soil Moisture Content and Curve Number

Italian Journal of Engineering Geology and Environment, 1 (2019)    © Sapienza Università Editrice                                   www.ijege.uniroma1.it   9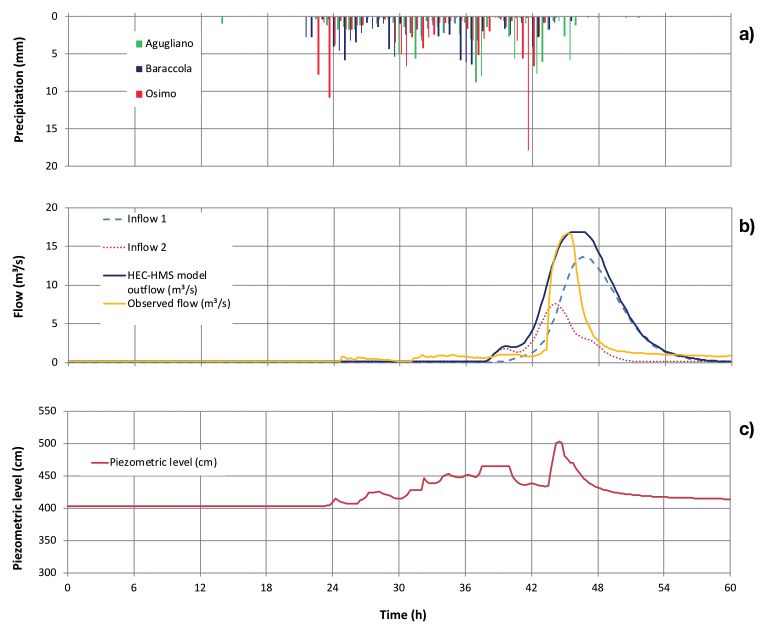
D. FRONZI & A. TAZIOLI

                                                                                         The basin model consists of three sub-basins (San Valentino
                                                                                    creek, Offagna creek and Alluvial plain). The San Valentino and
                                                                                    Offagna flow contribution reached downstream is named Inflow 1.
                                                                                    This contribution flows through the confluence between inflow 1
                                                                                    and the hydrometric station. The contribution of the alluvial plain
                                                                                    sub-basin (inflow 2) arrives at the hydrometric station (Fig. 4).
                                                                                         HEC-HMS also requires a meteorological model and control
                                                                                    specification. The control specification involves the insertion of
                                                                                    a start time and an end time, in addition to a computation time
                                                                                    step in order to calculate hydrographs relating precipitations to
                                                                                    discharge flow. The meteorological model is based on observed
                                                                                    precipitation and water discharge data (Oloche & Li, 2010).
                                                                                         The precipitation events of 21-23 May 2015, 21-22 February
                                                                                    2018 and 20-21 March 2018 represent the input of the HEC-HMS
                                                                                    model together with the run-off time for each sub-basin. Starting
                                                                                    from the precipitation data, recorded from three gauging stations
                                                                                    located in the Aspio basin, the Thiessen method was used to spatialise
                                                                                    rain data (Thiessen, 1911). Most of the precipitation in the basin is
                                                                                    captured by the Osimo rain gauge with a value of 90% coverage.
                                                                                         For each sub-basin a CN-SCS loss method was applied and the
                                                                                    run-off contribution for each precipitation input was determined
     Fig. 4 - HEC-HMS model of the Scaricalasino basin                              by the HEC-HMS model applying the formula below (3).
                                                                                                           Pn= (P - Ia)2/(P - Ia + S)                 (3)
                                                                                    where Pn is run-off (expressed in mm), P is the rainfall (expressed
                                                                                    in mm), S is the potential maximum soil moisture retention after
                                                                                    run-off begins (expressed in mm) and Ia is the initial abstraction
                                                                                    (expressed in mm) or the amount of water before run-off, such
                                                                                    as infiltration, or rainfall interception by vegetation. The relation
                                                                                    between the initial abstraction and the potential maximum soil
                                                                                    moisture retention after run-off begins is (4):
                                                                                                                   Ia = 0.2 S                         (4)
                                                                                         For the alluvial plain sub-basin, a constant monthly base
                                                                                    flow for the years 2015 and 2017-2018 was calculated from the
                                                                                    continuous registration of the discharge flow measured by the
                                                                                    hydrometric station located in the river (Tab. 4).
                                                                                         The base flow values were inserted in the HEC-HMS
                                                                                    model to take into account the contribution of the alluvial plain
                                                                                    groundwater to the water course. The computation of HEC-
                                                                                    HMS calculates the hydrograph for the selected events, relating
                                                                                    it to the real hydrograph recorded by the hydrometric station.
     Tab. 4 - Constant monthly base flow expressed in m³/s for the years            The discharge flow (expressed in m³/s) was compared to the
              2015 and 2017-2018*                                                   groundwater level measured by the piezometric level station
                                                                                    located in the alluvial plain in the same period.
     using the formula below (2):
                          CN (II)m =[CN (II)i ∙ Ai]/Atot            (2)             RESULTS
     where CN (II)i is the value of the Curve Number assigned by each                   The morphometric characteristics, useful for determining the
     intersection polygon using Table 2, Ai is the area of each polygon             run-off time using Puglisi’s formula and the total area for each
     and Atot is the total area of each sub-basin.                                  sub-basin, were obtained by QGIS analysis; the run-off time and
         The run of the HEC-HMS model is preceded by the creation                   the Curve Number (CN(II)m) determined for each sub-basin are
     of a basin model.                                                              reported in Table 5.

10   Italian Journal of Engineering Geology and Environment, 1 (2019)   © Sapienza Università Editrice                               www.ijege.uniroma1.it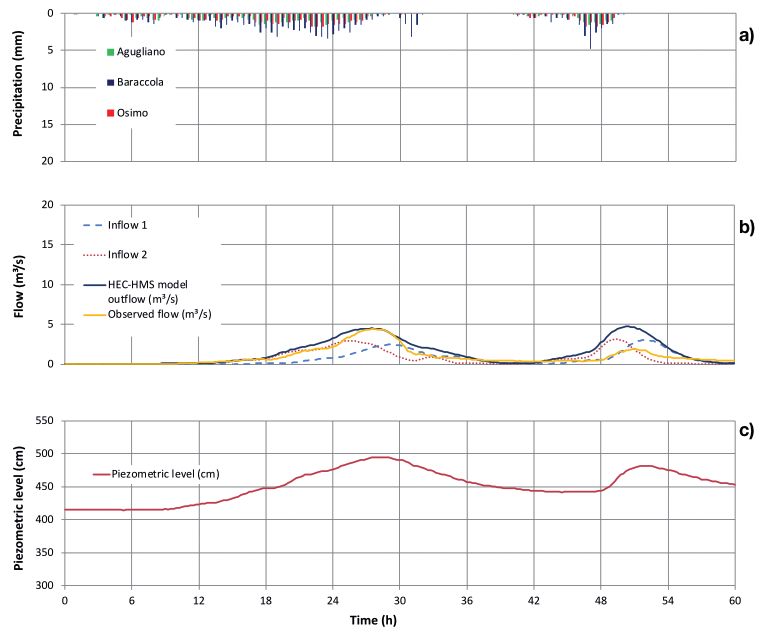
GROUNDWATER AND FLOOD EVENTS IN DIFFERENT HYDROGEOLOGICAL PERIODS: A CASE STUDY IN THE ASPIO RIVER (MARCHE REGION)

Fig. 5 - (a) Amount of precipitation for the event in May 2015. (b) Hydrographs obtained by the HEC-HMS model. (c) Piezometric level

     The hydrological results are presented according to the selected          shows different curves: the yellow curve represents the discharge
meteorological events. For each event two figures are shown.                   flow measured by the gauging station, the continuous blue line
     Figures 5, 6 and 7 report the results with the same graphical             shows the discharge flow calculated by the model and the dashed
setting described as follows. Graph (a) represents the amount                  and dotted lines represent the discharge flow generated by the
of precipitation for each event measured by the rain gauges                    contribution of the tributaries (Offagna creek and San Valentino
(Agugliano, Baraccola, Osimo) expressed in mm. Graph (b)                       creek) and the alluvial plain respectively. Graph (c) represents the
represents the hydrograph obtained by the HEC-HMS model, and                   piezometric level measured at the well located in the alluvial plain.

Tab. 5 - Morphometric characteristics of the watershed. hmax represents the maximum height of each sub-basin, h0 represents the minimum height of
         each sub-basin

Italian Journal of Engineering Geology and Environment, 1 (2019)   © Sapienza Università Editrice                              www.ijege.uniroma1.it   11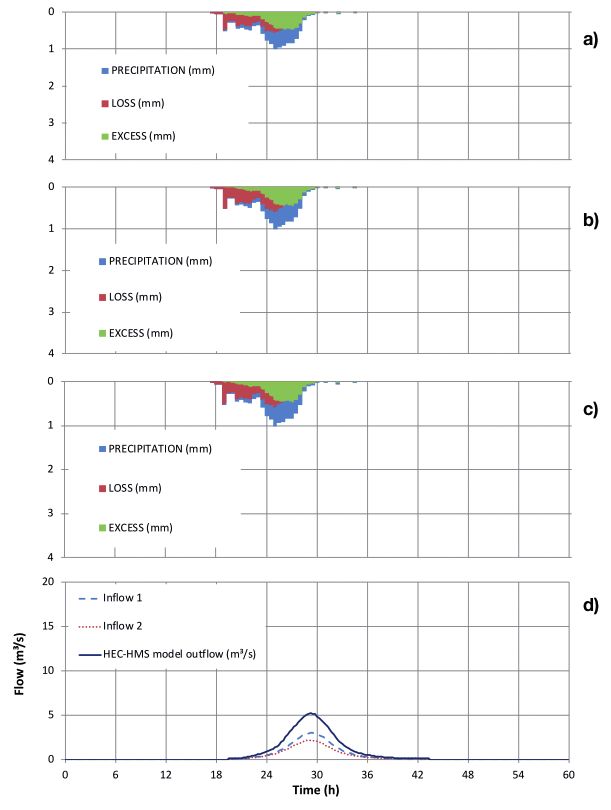
D. FRONZI & A. TAZIOLI

     Fig. 6 - (a) Amount of precipitation for the event in February 2018. (b) Hydrograph obtained by the HEC-HMS model. (c) Piezometric level.

     Fig. 7 - (a) Amount of precipitation for the event in March 2018. (b) Hydrograph obtained by the HEC-HMS model. (c) Piezometric level

12   Italian Journal of Engineering Geology and Environment, 1 (2019)   © Sapienza Università Editrice                              www.ijege.uniroma1.it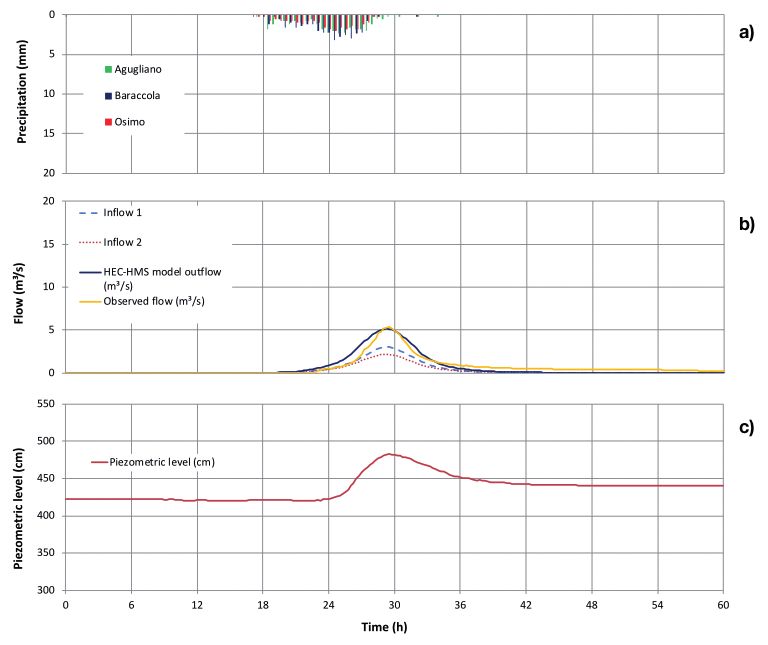
GROUNDWATER AND FLOOD EVENTS IN DIFFERENT HYDROGEOLOGICAL PERIODS: A CASE STUDY IN THE ASPIO RIVER (MARCHE REGION)

     Figures 8, 9 and 10 represent the results as follows. Graphs                   cm from the bottom of the well, a regular increase occurred until
(a) (b) and (c) represent the values of precipitation, initial                      about 500 cm, after which the piezometric level decreased to 410
abstraction (loss) and run-off (excess) for each sub-basin. Graph                   cm in about ten hours after the peak.
(a) is referred to the Offagna sub-basin, graph (b) is referred
to the San Valentino sub-basin and graph (c) is referred to the                     Rainfall 21-22 February 2018
precipitation which involved the alluvial plain sub-basin. Graph                         The meteorological event which occurred on 21-22 February
(d) represents the hydrographs obtained by the HEC-HMS model                        2018 was much less intense than the former. The maximum
without the line which represents the observed flow measured by                     intensity of precipitation was about 4.8 mm/h. The total duration
the gauging station.                                                                of the event was about 60 hours with different precipitation inputs
                                                                                    for a total rainfall of 56 mm (recorded by the Osimo rain gauge).
Rainfall 21-23 May 2015                                                             The discharge flow recorded by the gauging station shows two
    The precipitation event on 21-23 May 2015 lasted for 50                         different peaks. The first was recorded 27 hours after the start of
hours and was articulated in different sub-events with a maximum                    the precipitation, grew slowly and reached 4.4 m³/s; the second
intensity of 18 mm/h recorded by the Osimo station and a total                      peak was observed 51 hours after the start of the precipitation
rainfall of 117.6 mm for the same rain gauge.                                       and reached almost 2 m³/s. The groundwater level followed the
    The maximum discharge measured by the gauging station                           same behaviour with a slow increase from 415 cm to 495 cm in
was almost 17 m³/s, so it can be considered an extreme event                        18 hours, after which the level decreased slowly to 440 cm and
for this watershed. The discharge flow increased quickly but it                     increased again to about 480 cm during the second precipitation.
was preceded by some sub-increasing parts. The same behaviour                       After 60 hours the piezometric level decreased to 450 cm from the
was shown by the piezometric level: starting from a value of 400                    bottom of the well.

Fig. 8 - (a) Precipitation, initial abstraction (loss) and run-off (excess)              Fig. 9 - (a) Precipitation, initial abstraction (loss) and run-off (ex-
         for the Offagna sub-basin. (b) Precipitation, initial abstraction                        cess) for the Offagna sub-basin. (b) Precipitation, initial
         (loss) and run-off (excess) for the San Valentino sub-basin. (c)                         abstraction (loss) and run-off (excess) for the San Valen-
         Precipitation, initial abstraction (loss) and run-off (excess) for                       tino sub-basin. (c) Precipitation, initial abstraction (loss)
         the Alluvial plain sub-basin. (d) Hydrographs obtained by the                            and run-off (excess) for the Alluvial plain sub-basin. (d)
         HEC-HMS model                                                                            Hydrographs obtained by the HEC-HMS model

Italian Journal of Engineering Geology and Environment, 1 (2019)        © Sapienza Università Editrice                                    www.ijege.uniroma1.it    13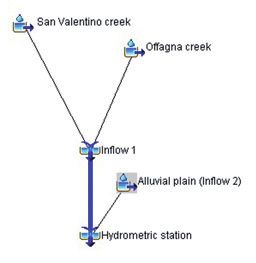
D. FRONZI & A. TAZIOLI

                                                                                               Firstly, a specific and detailed reconstruction and
                                                                                          interpretation of the geological settings, with particular focus
                                                                                          on shallow deposits and their properties, is needed in order
                                                                                          to achieve valid results. Using the SCS-CN method, in fact,
                                                                                          the hydraulic conductivity of each shallow deposit has to be
                                                                                          determined and then connected to each different lithology present
                                                                                          in the area, in order to assign each soil to one of the different
                                                                                          classes and calculate the value of the Curve Number. In addition,
                                                                                          the lithology, shows different behaviour depending on whether or
                                                                                          not it is capable of infiltrating water.
                                                                                               Soil use is another important aspect to take into account in
                                                                                          calibrating the curve number; in fact, this may have a significant
                                                                                          effect on the hydraulic characteristics of the study area (Koren et
                                                                                          alii, 2000). For example, the impermeable areas, represented by
                                                                                          buildings, car parks or industries, imply a run-off time reduction
                                                                                          (Bean et alii, 2007). On the contrary forests or uncultivated
                                                                                          natural areas delay or in some cases even cancel out the surface
                                                                                          run-off (Zhang et alii. 2012).
                                                                                               Even the amount of precipitation and the hyetograph
                                                                                          shape before the analysed event are important factors to take
                                                                                          into consideration as well as the hydrological conditions prior
                                                                                          to the event. As previously stated (Marchi et alii, 2010) the
                                                                                          hydrological conditions before the event are very important as
                                                                                          regards run-off coefficients even in the case of flash floods. The
                                                                                          three storm events described and analysed in this paper have a
                                                                                          different duration and intensity and present hyetographs with
     Fig. 10 - (a) Precipitation, initial abstraction (loss) and run-off (excess)         different shapes; this is mainly due to the hydrological period
               for the Offagna sub-basin. (b) Precipitation, initial abstraction          when the events occurred and also to the particular way in
               (loss) and run-off (excess) for the San Valentino sub-basin. (c)           which they happened. The first event occurred in the late spring,
               Precipitation, initial abstraction (loss) and run-off (excess) for
               the Alluvial plain sub-basin. (d) Hydrographs obtained by the              when the soil moisture was very low, and is characterised by
               HEC-HMS model.                                                             long duration and medium intensity, with a rainfall peak located
                                                                                          in the final part of the storm. The second and third events
     Rainfall 20-21 March 2018                                                            occurred in the late winter, and show a more regular trend, with
         The last event analysed, 20-21 March 2018, was characterised                     lower rain intensity. The hyetograph trend and the features of
     by a short duration with a maximum intensity almost equal to the                     the rainfall affect the shape of the hydrograph, together with
     previous precipitation 3.2 mm) and total rainfall of about 24 mm                     another important parameter, namely the variation in the
     recorded by the Osimo rain gauge. The maximum discharge was                          piezometric level and its value before, during and after the
     about 5.4 m³/s. The piezometric level before the precipitation was                   precipitation. As presented in the results chapter, the behaviour
     about 425 cm which rose by about 60 cm, before decreasing very                       of the hydrometric level before and after the peak is heavily
     slowly in the hours following the storm.                                             influenced by the piezometric level, and this is particularly
                                                                                          apparent when relating the graphs obtained by the HEC-HMS
     DISCUSSION AND CONCLUSIONS                                                           model to the measured one. In the first event (Fig. 4) a flash
          Hydraulic modelling is an important method for understanding                    flood takes place after a long period of precipitation of medium
     the behaviour of rivers and for preventing risks related to intense                  intensity, necessary to increase the water content in the soil
     meteorological events (Knight & Shamseldin, 2005). This study, in                    cover and to raise the groundwater level thereby recharging
     fact, stresses how hydraulic modelling can give a good response to                   the aquifers feeding the water course. A single rainfall event
     real situations occurring in the field, especially as regards the analysis           of short duration (recorded in a single area of the basin, Figure
     of the hydrograph area near the peak. Nevertheless, the study also                   4a) can raise the level by about 4 meters. Without the first part
     brings to light some critical aspects and suggests that other factors                of the rainfall (leading the watershed to critical conditions) it is
     and parameters should be taken into consideration in the analysis.                   likely that the effect of the single storm would not have been so

14   Italian Journal of Engineering Geology and Environment, 1 (2019)         © Sapienza Università Editrice                              www.ijege.uniroma1.it
GROUNDWATER AND FLOOD EVENTS IN DIFFERENT HYDROGEOLOGICAL PERIODS: A CASE STUDY IN THE ASPIO RIVER (MARCHE REGION)
significant. The second and third events (Figs 5 and 8) originate for a longer period, and this possibility should be considered in
a comparable increase in the water stage (about 130 cm), but the the design and management of a watershed (Vitvar et alii, 2002).
shape of the hydrograph is very different, exhibiting a steeper In conclusion, this study shows that mathematical models,
curve in the latter case; in addition, the hyetograph shows the based on precipitation data, could provide a good representation
longer duration of the second storm compared with the third of the flood when the hydrometric stage is at its maximum level,
one, with double the amount of total rainfall. but the other parts of the hydrograph are often underestimates as
The influence of the hydrological period and, therefore, of the model does not represent the real soil and aquifer conditions
the groundwater level before and during the event, is apparent before and after the flood event.
both in the first part of the late spring event (Fig. 4) when the For this reason, the mathematical models should be improved
groundwater (recharged during the first part of the precipitation) by implementing some other parameters, for example: soil
contributes to keeping the river stage high, and in the second part moisture before and after the event and/or the continuous record
of the hydrograph (second and, above all, third event, late winter) of the piezometric level during the entire hydrological year.
where groundwater sustains the water stage after the peak. These factors could significantly improve flood events
These data and observations support the analysis of the HEC- forecasts, making them more reliable and precise and extending
HMS model output; in general, in fact, it is possible to notice a good the potential of the mathematical models. Furthermore, the
correlation around the maximum level of the hydrograph, but there suggested improvements could also be very important for the
is scarce correspondence for lower levels which are represented future development of scientific results involving the long-term
by the base flow, strictly connected to groundwater behaviour and behaviour of aquifers in the modelling process. Starting from these
therefore to the variability of the piezometric level. In particular, core concepts, public stakeholders (national and local authorities)
the discrepancy visible in the hydrograph tails is more apparent and professionals should certainly be interested in accessing results
during the recharge period (Fig. 8), when the groundwater mainly that can be used to improve environmental management.
influences the hydrological behaviour of the water course.
The divergence between the results obtained by the ACKNOWLEDGEMENTS
hydrological model and the measured data, suggests taking Alberto Tazioli developed the research idea, decided the
into account the entire flood hydrograph, including the lower research strategy and wrote the discussion chapter. Davide Fronzi
portion. Although this could seem negligible for risk prediction, conducted the experimental tests, applied the hydrological model
this is not always the case. Most hydraulic works, in fact, are and wrote most of the paper. Thanks go to Mirco Marcellini and
designed only on the basis of the maximum water stage expected Vittorio Polenta for their support in the field tests.
in the watershed for a given time, and often underestimate The authors wish to thank the editors and the anonymous
any resilience strategies due to their cost (Vis et alii, 2003). In reviewer for their interesting suggestions.
particular conditions the water stage may sometimes remain high
REFERENCES
AA.VV. (1991) - L’ambiente fisico delle Marche: geologia, geomorfologia ed idrogeologia, 255, 1 carta f.t., scala 1:100.000. Ed. SELCA, Firenze.
Bally A.W., Burbi L., Cooper C. & Ghelardoni R. (1986) - Balanced cross section and seismic reflection profiles across the central Apennines. Mem. Soc.
Geol. It., 35: 257-310.
Barchi M., De Feyter A.J., Magnani M.B., Minelli G., Pialli G. & Sotera B.M. (1998) - The structural style of the Umbria-Marche fold and thrust belt.
Mem. Soc. Geol. It., 52: 552-57.
Calamita F. & Deiana G. (1986) - Evoluzione strutturale Neogenico-Quaternaria dell’Appennino Umbro-Marchigiano. Studi Geol. Camerti, Vol. spec., 91-98.
Coltorti M., Nanni T. & Rainone M.L. (1987) - Il contributo delle scienze della terra nell’elaborazione di un piano paesaggistico: l’esempio del monte
Conero (Marche). Mem. Soc. Geol. It., 37: 629-647, 6 ff., tav.
Dunne T. (1983) - Relation of field studies and modeling in the prediction of storm runoff. Journal of Hydrology, 65 (1-3): 25-48.
Hydrologic.Engineering Center (2000) - US Army Corps of Engineers.
Beven K. (2001) - Dalton Lecture: How far can we go in distributed hydrological modelling? Hydrology and Earth System Sciences, 5 (1): 1-12.
Islam Z. (2011) - A review on physically based hydrologic modeling. Technical report. University of Alberta, Canada.
Knight D. & Shamseldin A. (Eds. - 2005) - River basin modelling for flood risk mitigation. CRC Press.
Koren V., Smith M., Wang D. & Zhang Z. (2000) - Use of soil property data in the derivation of conceptual rainfall-runoff model parameters. In Proceedings
of the 15th Conference on Hydrology, American Meteorological Society, Long Beach, California, 103-106.
Llasat M.C., Llasat-Botija M., Prat M. A., Porcù F., Price C., Mugnai A., Lagouvardos K., Kotroni V., Katsanos D., Michaelides S.,Yair Y., Savvidou K. &
Nicolaides K. (2010) - High-impact floods and flash floods in Mediterranean countries: the FLASH preliminary database. Advances in Geosciences, 23: 47-55.
Italian Journal of Engineering Geology and Environment, 1 (2019) © Sapienza Università Editrice www.ijege.uniroma1.it 15D. FRONZI & A. TAZIOLI
Marchi L., Borga M., Preciso E. & Gaume E. (2010) - Characterisation of selected extreme flash floods in Europe and implications for flood risk
management. Journal of Hydrology, 394 (1-2): 118-133.
Mirabella F., Barchi M.R. & Lupattelli A. (2008) - Seismic reflection data in the Umbria Marche Region: limits and capabilities to unravel the subsurface
structure in a seismically active area. Ann Geophys-Italy, 51: 383-396.
Mussi M., Nanni T., Tazioli A. & Vivalda P.M. (2017) - The Mt Conero limestone Ridge: the contribution of stable isotopes in the identification of the
recharge area of aquifers. Italian Journal of Geosciences, 136 (2): 186-197.
Nanni T. (1980) - Note illustrative sulla geologia dell’Anconetano. Ed. Reg. Marche-Comune di Ancona, 55, 13 carte geologiche f.t., Ancona.
Nanni T. & Vivalda P. (2009) - Idrogeologia degli acquiferi carbonatici, terrigeni ed alluvionali tra i fiumi Cesano e Potenza (Marche centrali). Sintesi dei
risultati. La Nuova Lito, Pubbl. GNDCI/CNR Unità Operativa 10N. Firenze ISBN 9788890455414.
National Engineering Handbook of Soil Conservation Service (1956) - SCS National Engineering Handbook. U.S. Department of Agriculture, Washington,
1956; Section-4.
Oloche Oleyiblo J. & Li Z. (2010) - Application of HEC-HMS for flood forecasting in Misai and Wan’an catchments in China. Water Science and
Engineering, 3 (1): 14-22.
Pappenberger F., Beven K.J., Hunter N.M., Bates P.D., Gouweleeuw B.T., Thielen J. & De Roo A.P.J. (2005) - Cascading model uncertainty from medium
range weather forecasts (10 days) through a rainfall-runoff model to flood inundation predictions within the European Flood Forecasting System
(EFFS). Hydrology and Earth System Sciences Discussions. European Geosciences Union, 9: 381-393.
Puglisi S. & Zanframundo P. (1978) - Osservazioni idrologiche in piccoli bacini del subappennino dauno. Giornale del Genio Civile.
QGis Development Team (2009) - QGIS Geographic Information System. Open Source Geospatial Foundation Project. http://qgis.osgeo.org
Scisciani V. (2009) - Styles of positive inversion tectonics in the Central Apennines and in the Adriatic foreland: implications for the evolution of the
Apennine chain (Italy). J. Struct. Geol., 31 (11): 1276-1294.
Tazioli A., Nanni T., Vivalda P.M., Folchi Vici D’Arcevia C., Palpacelli S., Cantori P.M., Loffredo M., Marcellini M. & Polenta V. (2010) - Il Fiume
Aspio: un esempio di bacino sperimentale per la didattica e la ricerca in Geologia applicata e per lo studio del rischio idrogeologico. VIII Conv.
Giovani Ricercatori Geologia Applicata, Perugia.
Tazioli A., Mattioli A., Nanni T. & Vivalda P.M. (2015) - Natural hazard analysis in the Aspio equipped basin. In Engineering Geology for Society and
Territory, 3, 431-435. Springer, Cham.
Thiessen A.H. (1911) - Precipitation averages for large areas. Monthly Weather Review, 39 (7): 1082-1084.
Singh V.P. & Frevert D.K. (2003) - World water and environmental resources congress. June 23-26,. Philadelphia, Pennsylvania, United States.
Vis M., Klijn F., De Bruijn K.M. & Van Buuren M. (2003) - Resilience strategies for flood risk management in the Netherlands. International Journal of
River Basin Management, 1 (1): 33-40.
Vitvar T., Burns D.A., Lawrence G.B., McDonnell J.J. & Wolock D.M. (2002) - Estimation of baseflow residence times in watersheds from the runoff
hydrograph recession: method and application in the Neversink watershed, Catskill Mountains, New York. Hydrological Processes, 16 (9): 1871-1877.
Bean E.Z., Hunt W.F. & Bidelspach D.A. (2007) - Evaluation of four permeable pavement sites in eastern North Carolina for runoff reduction and water
quality impacts. Journal of Irrigation and Drainage Engineering, 583-592.
Zhang B., XIE, G., Zhang C. & Zhang J. (2012) - The economic benefits of rainwater-runoff reduction by urban green spaces: a case study in Beijing, China.
Journal of environmental management, 100: 65-71.
Received October 2018 - Accepted February 2019
16 Italian Journal of Engineering Geology and Environment, 1 (2019) © Sapienza Università Editrice www.ijege.uniroma1.itPuoi anche leggere