3D SURVEY MODELLING FOR DAMAGE ASSESSMENT IN RUBBLE-MOUND BREAKWATERS UNDER OBLIQUE WAVE INCIDENCE
←
→
Trascrizione del contenuto della pagina
Se il tuo browser non visualizza correttamente la pagina, ti preghiamo di leggere il contenuto della pagina quaggiù
DOI: 10.4408/IJEGE.2020-01.S-09

                   3D SURVEY MODELLING FOR DAMAGE ASSESSMENT
           IN RUBBLE-MOUND BREAKWATERS UNDER OBLIQUE WAVE INCIDENCE

       Rute LEMOS(*), Enrique PEÑA(**), João SANTOS(***), Jose SANDE(**), Andreas FIGUERO(**)
     Alberto ALVARELLOS(**), Emilio LAIÑO(**), Maria Teresa REIS(*), Conceição Juana FORTES(*),
                           Nils B. KERPEN(****) & Ricardo COELHO(*****)

                                                           (*)
                                                                 National Laboratory for Civil Engineering, Lisbon, Portugal.
                                   Water and Environmental Engineering Research Group, University of A Coruña, A Coruña, Spain.
                                (**)

                (***)
                        Instituto Superior de Engenharia de Lisboa and Centre for Marine Technology and Ocean Engineering, Lisbon, Portugal.
                                             (****)
                                                      Leibniz University Hannover, Ludwig-Franzius-Institute, Hannover, Germany.
                                       (*****)
                                                 Faculdade de Ciências e Tecnologia, Universidade Nova de Lisboa, Lisbon, Portugal.
                                                                          Corresponding author: rlemos@lnec.pt

EXTENDED ABSTRACT
     La misura dell’evoluzione del danno sui modelli fisici in scala di una diga frangiflutti può essere ottenuta mediante i metodi tradizionali,
attraverso il confronto tra i profili erosi, rappresentativi della sezione di testata, determinando l’area erosa come differenza tra rilievi
consecutivi. Tuttavia, questo tipo di stima del danno è adatto solo per modelli 2D o per modelli 3D rappresentativi di un tratto della struttura.
     Attualmente, le nuove tecniche di rilievo, mediante laser scanner o metodo del Time of Fly (ToF), consentono di effettuare rilievi
tridimensionali, con l’obiettivo di ottenere modelli digitali del terreno, a partire dall’acquisizione di nuvole di punti. Le nuovole di punti
possono essere elaborate attraverso un elevato numero di software, offrendo la possibilità di estrarre profili trasversali e, quindi, stimare
l’erosione della struttura. Nonostante i grandi progressi, il rilievo di modelli digitali tridimensionali di tali tipi di strutture risulta essere
ancora difficile, in quanto l’erosione è fortemente influenzata dagli spazi tra gli elementi artificiali costituenti la mantellata che potrebbero
essere erroneamente considerati segno di una potenziale erosione della struttura. Pertanto, è necessario condurre ulteriori indagini al fine di
ottimizzare i parametri di post - elaborazione delle informazioni raccolte durante i rilievi sui modelli in scala.
     Una ulteriore difficoltà che si riscontra nella progettazione di tali tipi di strutture è rappresentata dalla necessità di dover considerare gli
effetti indotti sulla stabilità degli elementi di mantellata dagli attacchi ondosi non perpendicolari, specialmente per onde incidenti inclinate
rispetto la struttura di un angolo superiore a 45°, per i quali vi è un incremento di stabilità e sono disponibili pochi dati.
     Al fine di superare i suddetti limiti, è stata condotta una campagna sperimentale su modello fisico in scala nell’ambito del progetto TA
HYDRALAB+ “RODBreak”. L’obiettivo principale del progetto è di approfindire lo studio del fenomeno, al fine di mitigare nel lungo
periodo l’impatto dell’innalzamento del livello medio del mare sulle strutture di difesa costiera europee.
     La campagna sperimentale è stata condotta su un modello fisico 3D presso il laboratorio di Marienwerder dell’Università di Leibnitz di
Hannover (LUH). Durante i test sono state misurate le condizioni ondose, la risalita delle onde, la portata di tracimazione e il danno sugli
elementi costituenti la mantellata di una diga frangiflutti soggetta ad attacco ondoso obliquo.
     Il presente lavoro riporta l’evoluzione del danno subito dalla struttura nella sezione di testata indotta da onde estreme non perpendicolari
alla struttura e le nuove metodologie non intrusive utilizzate per il rilievo degli elementi di mantellata, mediante l’utilizzo del sensore del
movimento Kinect ©, utilizzando come riferimento per le misure un rilievo eseguito mediante laser scan (Faro Focus 3D). Gli obiettivi
principali del presente lavoro sono: i) valutare l’evoluzione del danno dello strato di mantellata del modello fisico; nel presente lavoro si
riportano i risultati di 4 set di test (su 11 test totali condotti durante la campagna sperimentale) al fine di confrontare l’evoluzione del danno
della struttura in differenti condizioni d’onda, direzioni e directional spreading (onde lunghe e corte); ii) testare la metodologia ToF con
il sensore Kinect ©, al fine di valutare l’evoluzione dei volumi erosi globali e locali, utilizzando rilievi intermedi condotti in presenza di
acqua e iii) stimare il numero di elementi della mantellata spostati, usando un parametro di danno adimensionale basato sul volume eroso.
     Il programma sperimentale è consistito in quattro serie di test rappresentative di quattro differenti combinazioni di direzione delle onde
incidenti, β, e directional spreading. Per ciascuna direzione di onda incidente, sono state testate 4 diverse condizioni d’onda (caratterizzate
da altezze d’onda significative Hm0 = 0.100 m, 0.150 m, 0.175 m e 0.200 m con periodi di picco corrispondenti Tp = 1.19 s, 1.45 s, 1.57 s e
1.68 s). Prima e dopo ogni serie di test, è stato effettuato il rilievo della struttura mediante Kinect © in presenza e in assenza di acqua nella
vasca. Al termine di ciascun test, è stato condotto il rilievo della struttura senza vuotare la vasca. Le nuvole di punti acquisite sono state
elaborate mediante il software CloudCompare. Al fine di calcolare l’evoluzione del danno al termine delle prove intermedie (in presenza di
acqua), le nuvole di punti acquisite sono state corrette, utilizzando la nuvola di punti di riferimento iniziale, ottenuta senza acqua.

Italian Journal of Engineering Geology and Environment, 1 (2020)                       © Sapienza Università Editrice                 www.ijege.uniroma1.it   73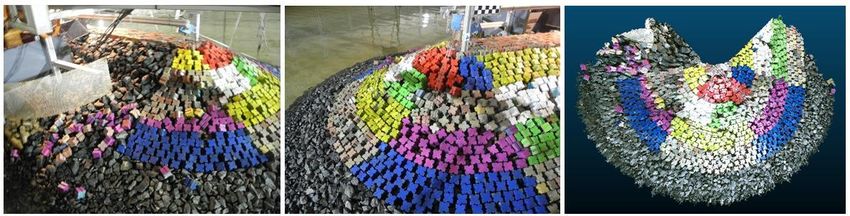
DOI: 10.4408/IJEGE.2020-01.S-09

    I principali risultati dello studio sono i seguenti: i) per quanto riguarda l’evoluzione del danno, per i test condotti con β = 90 °,
directional spreading e in presenza di onde lunghe e con β = 40 ° e onde corte si è osservato il danno localizzato più elevato sulla testata
della struttura; ii) le potenzialità del sensore Kinect © nel rilevare le diverse fasi di danno sono promettenti, nonostante una sovrastima del
danno durante la fase iniziale ed intermedia; iii) i lavori futuri dovrebbero comprendere più test con il sensore Kinect © per poter ricercare
il numero più adatto delle scansioni, della densità delle nuvole di punti acquisite e il passo ottimale della griglia per il rilievo degli strati
di mantellata caratterizzati da elevata porosità, soprattutto per la parte di struttura sommersa; iv) l’uso di tecniche innovative per il rilievo
degli elementi di mantellata dei modelli fisici in scala può costituire una tecnica promettente e affidabile per la valutazione dell’evoluzione
del danno su strutture di questo tipo.

Italian Journal of Engineering Geology and Environment, 1 (2020)   © Sapienza Università Editrice                            www.ijege.uniroma1.it   74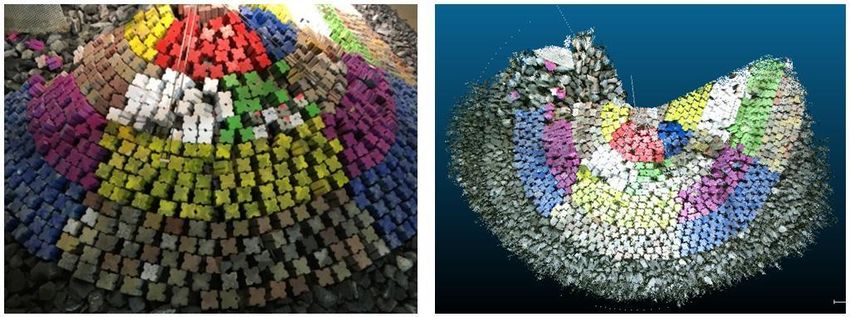
AN 3D SURVEY MODELLING FOR DAMAGE ASSESSMENT IN RUBBLE-MOUND BREAKWATERS UNDER OBLIQUE WAVE INCIDENCE
ABSTRACT the existence of guidelines proposed by several authors (e.g., Yu
Several authors have proposed guidelines on how to consider et alii, 2002; Van gent, 2014; MaciÑeira & Burcharth, 2016).
the effects of oblique waves on the stability of armour layers of Especially for very oblique waves, for which the increase in
rubble-mound breakwaters. Especially for very oblique waves, stability is the largest, limited data are available.
for which the increase in stability is the largest, limited data are The assessment of the evolution of damage shown by scale-
available. Under the scope of the HYDRALAB+ transnational model tests can be achieved by comparing the damage in profiles
access project “RODBreak”, experiments were conducted in that are representative of the tested section and by determining
a tank at the Marienwerder facilities of the Leibnitz University the eroded area of the tested section between consecutive
Hannover (LUH), comprising measurements of sea waves, run- surveys. Damage to the armour layer is then characterized
up, overtopping and armour layer damage of a rubble-mound either by parameters based on the number of displaced armour
breakwater under oblique extreme wave conditions. This paper units, such as the Nod parameter (Van Der Meer, 1988), or
focuses on the analysis of damage evolution of the breakwater by dimensionless parameters based on the eroded area of a
roundhead subject to these conditions, on the novelty of the non- profile of the armour layer, such as S (Broderick & Ahrens,
intrusive survey methodologies and on the advance in knowledge 1982; Van Der Meer, 1988) or the dimensionless eroded depth,
on roundhead stability. E2D (Melby & Kobayashi, 1998). Nevertheless, this damage
evaluation is only applicable in (2D) tests or in 3D tests of a
Keywords: coastal structure, stability, surveying, measuring techniques. breakwater trunk.
large scale experiments Recently, Hofland et alii (2014) developed the local
damage depth E3D,m that includes the circular moving average
INTRODUCTION of the erosion pattern in rock armour layers, being applicable to
Breakwaters are structures built to create sufficiently calm a variety of non-standard 2D and 3D rubble-mound structures.
waters for safe mooring and loading operations, handling ships, Nowadays, 3D surveys of physical scale models are
and protecting harbour facilities. They usually also help to control performed by using new measurement techniques, such as
sedimentation by guiding currents or protecting coastlines laser scanning (Rigden & Steward, 2012; Molines et alii,
against the action of abnormal wave activity, such as tsunamis. 2012; Puente et alii, 2014), photogrammetric methods with
Rubble-mound breakwaters with an armour layer composed of photographic cameras (Hofland et alii, 2011; Lemos et alii,
rock or artificial armour units are the most common of these 2017) or with the Time of Fly (ToF) method (Castaneda &
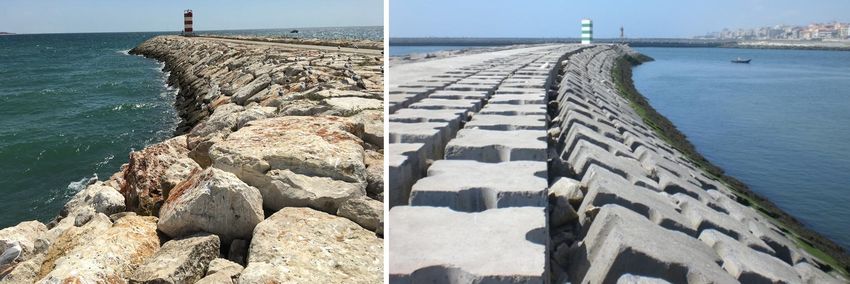
structures (Figure 1). Prior to their construction, the design of Navab, 2011).
most of these structures requires a series of scale model tests in The goal of those surveys is to obtain surface models of
order to evaluate their hydraulic and structural behaviour and rubble-mound breakwaters, based on point clouds, which can
thereby characterize the structure’s response to incident waves be edited by a wide range of software, enabling the extraction
in terms of overtopping and damage in the armour layers. of profiles and the calculation of eroded depths and eroded
A challenge for breakwater design is how to consider the volumes.
effect of oblique waves on the stability of armour layers, despite Despite the great progress achieved lately in this research
Fig. 1 - Typical rubble-mound breakwaters with armour layers composed of: Left: rock units; Right: artificial units.
Italian Journal of Engineering Geology and Environment, 1 (2020) © Sapienza Università Editrice www.ijege.uniroma1.it 75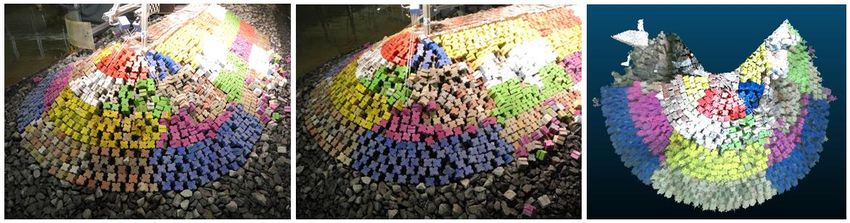
R. LEMOS, E. PEÑA, J. SANTOS, J. SANDE, A. FIGUERO, A. ALVARELLOS, E. LAIÑO, M. T. REIS, C. J. FORTES, N. B. KERPEN & R. COELHO

     area, the survey of large 3D models, composed of artificial                    project and it focuses on damage evolution of the breakwater
     armour layer units, remains a challenge, as eroded depth is                    roundhead subject to oblique extreme wave conditions, on the
     strongly affected by gaps between armour units, which can                      novelty of the non-intrusive survey methodologies and on the
     be wrongly computed as erosion. Hence, further investigation                   advance in knowledge on roundhead stability. More details on
     should be made to optimize the post-processing parameters                      the project results from all the types of measurements may be
     of the information collected during scale model surveys (as                    found in Santos et alii (2019).
     the grid step to use while computing volumes and distances).                       The main objectives of the present paper are:
     The Kinect© motion sensor is a helpful tool, since it enables                  • To evaluate the damage evolution of the armour layer of a scale
     real-time 3D modelling of the surveyed scenes without time                     model of a rubble-mound breakwater. Results of four test series
     consuming post-processing reconstruction.                                      are presented (out of 11 test series of the entire test program) in
          The use of the Kinect© motion sensor for 3D surveys of                    order to compare damage evolution between tests conducted with
     breakwater scale models has been tested by different authors, in               different wave conditions, including different directions and di-
     order to facilitate the surveys for damage evolution assessment.               rectional spreading (long and short-crested waves);
     Soares et alii (2017) tested the use of this device to detect                  • To test the ToF methodology with the Kinect© sensor, in or-
     displacements of cubes and tetrapods in two different scale                    der to evaluate the evolution of global and local eroded volumes,
     models, based on data acquired by a Kinect©V2. Sande et                        using intermediate surveys conducted with water;
     alii (2018) conducted a set of tests at the National Laboratory                • To estimate the number of displaced armour units, using a non-
     for Civil Engineering (LNEC), Portugal, and at University of                   dimensional damage parameter based on the eroded volume.
     La Coruña, Spain, in order to optimize the best distance of                        The paper includes a brief description of the model
     the Kinect© sensor to the surveyed scene. This investigation                   characteristics, the equipment used in the experiments, the test
     comprised scans of a 2D scale model of a breakwater with an                    plan, the results on damage evolution assessment using the
     armour layer composed of Antifer cubes. The distances from                     Kinect© sensor and the conclusions from the developed work.
     the sensor to the model, which ranged from 1 m to 5 m, enabled
     the conclusion that the best combination of practical distance                 MATERIALS AND METHODS
     and point density was obtained at 1.5 m with 6.2 points/cm2                    The physical scale model
     resolution.                                                                        A stretch of a rubble-mound breakwater (head and part of
          Musumeci et alii (2018) conducted investigations on                       the adjoining trunk, with a slope of 1(V) : 2(H) was built in the
     surveys of the submerged part of a breakwater model using                      wave-current basin of the LUH to assess, under extreme wave
     a Kinect© sensor, during 2D scale model tests of accropode                     conditions (wave steepness s = 0.055) with different incident
     armour units, showing a promising progress on surveys without                  wave angles (from 40º to 90º), the structure behaviour in what
     the time-consuming task of emptying the flume or basin to                      concerns wave run-up, wave overtopping and damage progression
     conduct a survey. The correction of the deformation caused                     of the armour layer. The armour layer consisted on Antifer cubes
     by light refraction in the interface air-water was carried out by              of 0.350 kg with a nominal diameter (Dn) of 0.051 m and of rock
     considering a rotation angle, α, and a scaling factor, f, of the               units of 0.315 kg with a nominal diameter of 0.03 m. The trunk of
     submerged part of the section. In Musumeci’s experiments, it                   the breakwater was 7.5 m long and the head had the same cross-
     was possible to reach measurement errors smaller than 0.003 m                  section as the exposed part of the breakwater. The model was 9.0
     at a distance from the breakwater of about 1.0 m.                              m long, 0.82 m high and 3.0 m wide. Figure 2 shows the physical
          Within the scope of the HYDRALAB+ transnational                           scale model ready to be operated.
     access project “RODBreak”, Santos et alii (2019) conducted
     3D experiments at the Marienwerder facilities of the Leibnitz                  Equipment
     University Hannover (LUH), comprising measurements of                               Two different techniques were used to measure armour layer
     sea waves, run-up, overtopping and armour layer damage                         damage in the tests, in addition to the visual identification of
     of a rubble-mound breakwater under oblique extreme wave                        rocking and displaced armour units. The first technique is based
     conditions. Those experiments lasted for six weeks and                         on the use of the Kinect© motion sensor, which was moved on a
     involved seventeen people from seven different institutions                    rail, above and around the breakwater head, enabling overlapping
     from four European countries. The existing data gaps triggered                 scans to produce a 3D model of the above-water part of the
     the experimental work, whose main goal was to contribute to a                  armour layer. The Kinect© scans were made at a vertical distance
     new whole understanding of the phenomena to mitigate future                    of 1.2 m of the breakwater.
     sea-level-rise impact in European coastal structures.                               The Kinect© is equipped with a depth sensor composed of
          This paper is based on data analysis from the “RODBreak”                  an infrared projector and a monochrome CMOS (complementary

76   Italian Journal of Engineering Geology and Environment, 1 (2020)   © Sapienza Università Editrice                             www.ijege.uniroma1.it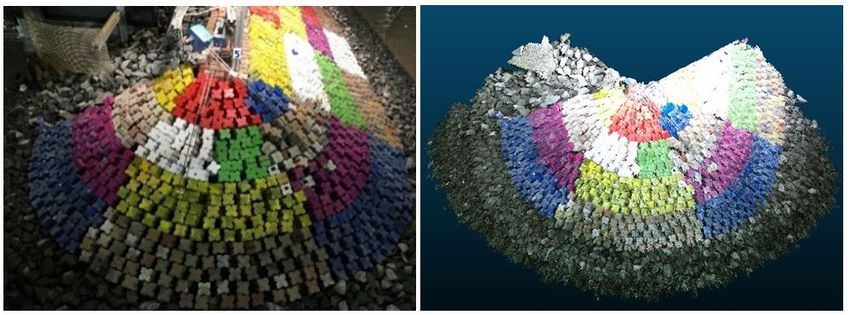
AN 3D SURVEY MODELLING FOR DAMAGE ASSESSMENT IN RUBBLE-MOUND BREAKWATERS UNDER OBLIQUE WAVE INCIDENCE

Fig. 2 - Different views of the physical scale model.

metal-oxide semiconductor) sensor, which work together to “see”                 2018), the angle of wave attack, β, is defined at the toe of the
in 3D, regardless of the lighting. It is also equipped with a RGB               structure, as the angle between the direction of the waves and the
camera, which acquires 3-color components: red, green and blue.                 perpendicular to the long axis of the breakwater. The directional
     The acquisition of depth values by the Kinect© is determined               spreading is characterized by the directional spreading width (σ).
by the ToF method, where the distance between the points of a                        For each incident wave angle, at least 4 different wave
surface and the sensor is measured by the time of flight of the                 conditions acted on the model: Hm0 = 0.100 m, 0.150 m, 0.175 m
light signal reflected by the surface. In other words, ToF imaging              and 0.200 m and the corresponding peak periods Tp = 1.19 s, 1.45
refers to the process of measuring the depth of a scene by                      s, 1.57 s and 1.68 s.
quantifying the changes that an emitted light signal encounters
when it bounces back from objects in a scene.                                    Damage evaluation methodology
     As the Kinect© sensor is equipped with a RGB camera, it is                       Before and after each test series, a Kinect© survey was
possible to “see” below the water level and a first estimate of the             conducted with and without water in the wave tank. After each
armour layer’s submerged region can also be made. Such rough                    test in the series, a survey was conducted with water, avoiding
estimate can be corrected with the information gathered with the                emptying the tank (Figure 4). All the obtained point clouds were
Kinect© sensor after the water is drained from the wave tank.                   post-processed using the tools and algorithms of the open source
     The second technique is a laser scan survey (Faro Focus 3D)                software CloudCompare (Girardeau - Montaut, 2006).
of the armour layer envelope, which established the reference                        In order to compute damage evolution at the end of
for the measurements made with the Kinect© sensor. Figure 3                     intermediate tests (with water), point clouds obtained from
illustrates the equipment used to evaluate armour layer damage.                 scans with water were aligned, using the initial (reference) cloud
                                                                                obtained without water.
Test plan                                                                            For test series without localized damage (if only movements
    Regarding the test conditions, tests were conducted with                    occur or if there are only isolated armour unit displacements) the
irregular waves, reproduced accordingly to a Jonswap spectrum                   proposed damage evaluation took into account the armour layer
with classical shape. Table 1 summarizes the test parameters of                 depth differences resulting from rearrangements of the armour
the four-test series analyzed in the present paper, where d is the              units, where the erosion ratio was evaluated using CloudCompare
water depth, Hm0 is the spectral significant wave height, Tp is the             by computing the ratio of elementary cells (resulting from the
spectral peak period, measured in front of the wave generator.                  gridding process) corresponding to erosion over the total number
According to the EurOtop manual (Van Der Meer et alii,                          of cells. Those depth differences were obtained using the

Fig. 3 - Left: Rail to support the Kinect© motion sensor; Center: Laser scanning; Right: Laser scan survey.

Italian Journal of Engineering Geology and Environment, 1 (2020)    © Sapienza Università Editrice                            www.ijege.uniroma1.it   77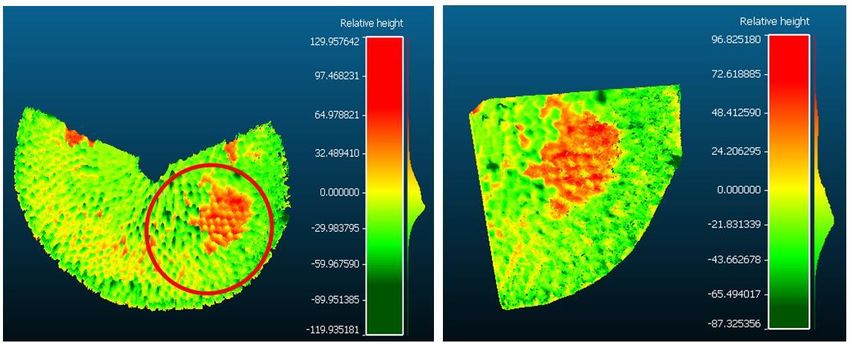
R. LEMOS, E. PEÑA, J. SANTOS, J. SANDE, A. FIGUERO, A. ALVARELLOS, E. LAIÑO, M. T. REIS, C. J. FORTES, N. B. KERPEN & R. COELHO

         Test         d (m)       Hm0 (m)        Tp (s)        β (o)    σ (o)
         T13           0.60         0.100         1.19          40       0
         T14                        0.150         1.45
         T15                        0.175         1.57
                                                                                            Fig. 4 - Methodology for scale model survey.
         T16                        0.200         1.68
         T17           0.60         0.100         1.19          65       0                  density and depth estimation was obtained with a step of 1 mm.
         T18                        0.150         1.45                                      Smaller steps conducted to an overestimated depth, while grid
         T19                        0.175         1.57                                      steps higher than 1 mm led to an important loss of point density.
         T20                        0.200         1.68
                                                                                                The number of estimated displaced units was compared with
                                                                                            the number of displaced units, obtained after each test, with the
         T21           0.60         0.100         1.19          90
                                                                                            traditional counting method.
         T22                        0.150         1.45
                                                                                                All the surveys consisted on 40 scans around the roundhead
         T23                        0.175         1.57
                                                                                            with an overlap higher than 90%. The point clouds resulting
         T24                        0.200         1.68
                                                                                            from the merge of those sub-clouds had a density of around 0.50
         T25                        0.250         1.88
                                                                                            points/mm2. Figure 5 illustrates the methodology for a point
         T35           0.60         0.100         1.19          40       50                 cloud construction.
         T36                        0.150         1.45                                          The edition of the final cloud with the CloudCompare
         T37                        0.175         1.57                                      software enabled to remove duplicate points, to discard points
         T38                        0.200         1.68                                      (segment) that are not part of the model area subject of study
         T39                        0.250         1.88                                      (e.g. instrumentation and stone at the toe of the structure), as well
     Tab. 1 - Test conditions.                                                              as to isolate the local erosion areas. In addition, to fasten data
                                                                                            processing, clouds were subsampled with a minimum space of 1
     Multiscale Model to Model Cloud Comparison (M3C2) algorithm                            mm between points. The density of the final cloud of points was
     (Lague et alii, 2013) provided by the CloudCompare software.                           around 0.25 points/mm2.
         For test series with localized damage, the evaluation was
     based upon the local eroded volume computation. In this last                           Comparison between surveys performed with a Kinect© and a
     case, the ratio between the computed eroded volume of the                              laser scan
     most damaged area (local damage) and the volume of a single                                 As said in section 2.2, a laser scan survey (Faro Focus 3D)
     armour unit enabled the determination of a non-dimensional 3D                          of the armour layer envelope established the reference for the
     parameter, which reflects an approximate number of displaced                           measurements carried out with the Kinect© sensor. In order to
     units: Estimated no. displaced units = (Eroded volume x                                compare the differences between both survey methodologies,
     (1-Porosity)) / Armour Unit Volume.                                                    a comparison was carried out between laser scan and Kinect©
         The eroded volume computation was based upon the use                               sensor surveys obtained without water before test T17 (Figure 6).
     of CloudCompare and relied on the gridding process of the                                  The average distance between both clouds of points was
     cloud(s), by choosing a grid step. This step defines the size of the                   0.008 m. The maximum distance was 0.081 m, corresponding
     elementary cells used in the volume computation.                                       to some anomalies occurred, for both methodologies, due to the
         In the present work, after several experiences with grid steps                     placement of a run-up gauge along the armour layer slope.
     ranging from 0.25 mm to 10 mm, the best combination of point                               Profiles extracted for the leeward, front and seaward sections

     Fig. 5 - Construction of a cloud of points by fusion of 40 overlapping sub-clouds.

78   Italian Journal of Engineering Geology and Environment, 1 (2020)           © Sapienza Università Editrice                              www.ijege.uniroma1.it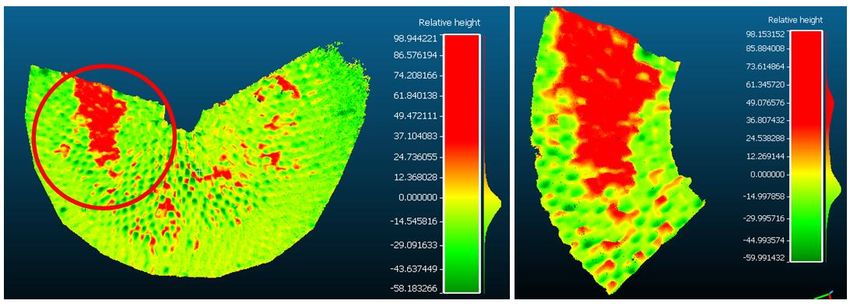
AN 3D SURVEY MODELLING FOR DAMAGE ASSESSMENT IN RUBBLE-MOUND BREAKWATERS UNDER OBLIQUE WAVE INCIDENCE

Fig. 6 - Survey before test T17. Left: Laser scan survey; Center: Kinect© sensor survey; Right: Map of distances between both surveys.

showed that both methodologies revealed a good agreement in                      whose position did not change during tests, followed by a fine
the leeward and the seaward sections. The average error was of                   registration using the Iterative Closest Point (ICP) algorithm
0.015 m and the maximum error was of 0.053 m. On the other                       (Chen & Medioni, 1991) provided by CloudCompare.
hand, the profile corresponding to the front section confirmed                       The left panel of Figure 8 depicts a profile comparison
the interference of the run-up gauge in the armour layer surveys                 between dry and wet surveys conducted before test T17, while
(Figure 7). In this last case, the average error was 0.028 m and the             the right panel depicts the same comparison after a fine alignment
maximum error was 0.13 m.                                                        of the wet survey with the reference (dry) survey. The average
    Alignment of clouds of points obtained with water                            of the absolute differences obtained without alignment and with
    As mentioned before, to compute damage evolution for                         alignment are 0.033 m and 0.009 m, respectively.
intermediate tests (with water), point clouds obtained from scans
conducted with the Kinect© sensor with water were aligned                        RESULTS
with the initial (reference) cloud obtained without water. This                      For test series without localized damage (only with
procedure required an initial rough alignment using points                       rearrangements of the Antifer cubes), the proposed analysis of

 Fig. 7 - Roundhead scanned with a laser scan before test T17 and profiles extracted for the leeward, front and seaward sections.

Italian Journal of Engineering Geology and Environment, 1 (2020)     © Sapienza Università Editrice                                 www.ijege.uniroma1.it   79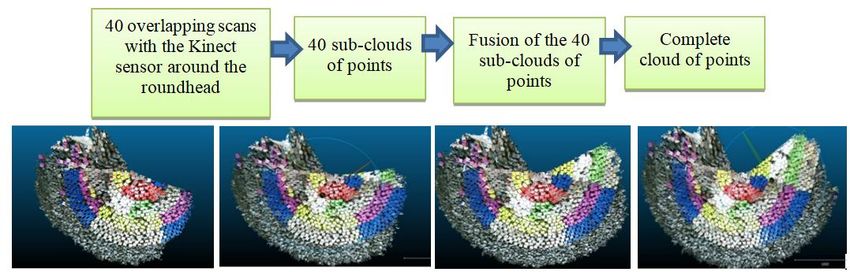
R. LEMOS, E. PEÑA, J. SANTOS, J. SANDE, A. FIGUERO, A. ALVARELLOS, E. LAIÑO, M. T. REIS, C. J. FORTES, N. B. KERPEN & R. COELHO

     Fig. 8 - Profile comparison for surveys conducted before test T17. Left: Between dry and wet surveys; Right: Between dry and aligned wet surveys.

     depth differences maps (in mm) considers positive and negative                        During test series T17-T20, an important number of
     depth differences as erosion and deposition, respectively.                        movements were also detected, as well as a small number of
          Regarding test series T13-T16, the most affected parts                       armour units removed from the inner section of the roundhead.
     of the roundhead were the central and outer sectors, where an                     Figure 11 illustrates an overview of the model at the end of test
     important number of movements were detected, without armour                       T20, as well as the scan of the model at the end of the test series.
     unit extraction (Figure 9). Figure 10 illustrates the depth changes               Figure 12 shows the depth maps at the end of tests T13 and T20.
     map, caused by movements of the armour layer units during the                         In the test series presented above, the erosion ratio resulting
     test series.                                                                      from armour unit rearrangements was evaluated, using the depth

     Fig. 9 - Left: Model after test T16; Right: Roundhead scanned with Kinect© after test T16.

     Fig. 10 - Depth changes map, in mm (Red - erosion; Blue - deposition). Left: After test T13; Right: After test T16.

80   Italian Journal of Engineering Geology and Environment, 1 (2020)      © Sapienza Università Editrice                              www.ijege.uniroma1.it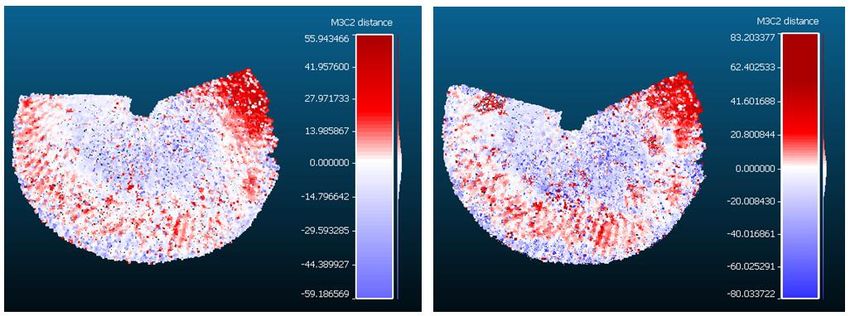
AN 3D SURVEY MODELLING FOR DAMAGE ASSESSMENT IN RUBBLE-MOUND BREAKWATERS UNDER OBLIQUE WAVE INCIDENCE

Fig. 11 - Left: Model after test T20; Right: Roundhead scanned with Kinect© after test T20.

Fig. 12 - Tests T17-T20. Armour layer eroded depth, in mm (Red - erosion; Blue - deposition). Left: After test T17; Right: After test T20.

map histogram¸ by computing the ratio of points corresponding to                            and local erosion maps (in mm) for damage occurred between
erosion (red areas) over the total number of points.                                        tests T21 and T25 are presented in Figure 15.
    For both test series, after an initial increase in erosion, it was                          Surveys during test series T35-T39 also revealed important
possible to identify a decrease in erosion during the intermediate                          damage at the leeward section of the roundhead, around the still
tests, probably due to rearrangements of the armour units. During                           water level, with exposure of the Antifer cubes of the inner layer.
the last test, with Hm0 = 0.20 m, the erosion ratio was 0.24 for test                       The armour layer of the outer sector of the roundhead presented
series T13-T16 and of 0.09 for series T17-T20. Table 2 and Figure                           several movements and rearrangements of the Antifer cubes
13 present the erosion ratio evolution for test series T13-T16 and                          (Figure 16). These tests, conducted with the same wave conditions
T17-T20.                                                                                    (d = 0.60 m and β = 40°) as tests T13-T16, but with a directional
    Test series T21-T25 and T35-T39 presented more severe
damage levels than the other series. At the end of series T21-T25,
an important eroded volume was observed, mainly at the center
and outer sectors of the roundhead, around the still water level,
exposing the inner layer of Antifer cubes (Figure 14). The global

    Test                 T13-T16                           T17-T20
   series
    Test       T13     T14      T15     T16      T17     T18       T19    T20

  Erosion     0.22     0.18    0.15     0.24    0.08     0.07      0.06   0.09
   ratio
                                                                                            Fig. 13 - Erosion ratio evolution during test series T13-T16 and
 Tab. 2 - Erosion ratio evolution for test series T13-T16 and T17-T20                                 T17-T20.

Italian Journal of Engineering Geology and Environment, 1 (2020)                © Sapienza Università Editrice                             www.ijege.uniroma1.it   81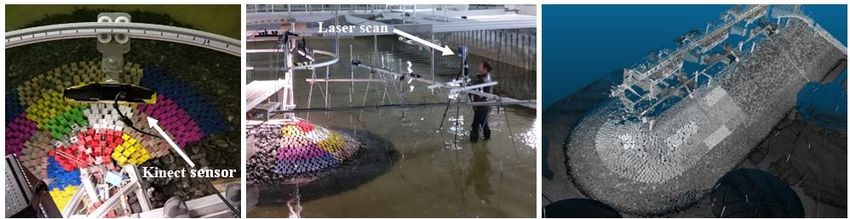
R. LEMOS, E. PEÑA, J. SANTOS, J. SANDE, A. FIGUERO, A. ALVARELLOS, E. LAIÑO, M. T. REIS, C. J. FORTES, N. B. KERPEN & R. COELHO

                    Test         Global eroded                     Displaced units                     Local eroded               Displaced units
                                 volume (dm3)                                                          volume (dm3)
                                                          Estimated              Counted                                  Estimated             Counted
                    T21               13.03                   58                      1                     3.32             15                     1
                    T22               14.02                   63                      4                     3.49             16                     4
                    T23               14.29                   64                      10                    3.73             17                     6
                    T24               15.33                   69                      16                    3.85             17                     10
                    T25               21.43                   96                      60                    8.88             40                     40
                    T35               13.29                   60                      0                     1.44              6                     0
                    T36               13.07                   59                      2                     1.59              7                     0
                    T37               13.14                   59                      6                     1.61              7                     0
                    T38               13.84                   62                      10                    1.64              7                     0
                    T39               14.72                   66                      42                    7.91             35                     37
     Tab. 3 - Global and local eroded volumes for test series T21-T25 and T35-T39

     spreading of 50° (for short-crested wave reproduction), presented                               Figure 18 illustrates the counted and estimated number of
     a higher localized damage (Figure 17).                                                      armour units based upon the localized erosion volume. Volumes
         Table 3 presents the global and localized erosion volumes                               are presented in cubic decimeters to have a better understanding
     from the roundhead, obtained from a 1 mm grid. The estimated                                of the damage, according to the model dimensions. For both test
     values of removed/displaced units, based on the ratio between the                           series, the number of displaced units based on the global eroded
     eroded volume and the volume of a single armour unit (around                                volume is largely overestimated, with percentage errors higher
     0.13 dm3), are also summarized.                                                             than 58.3%. In fact, movements that lead to the display of the gaps

     Fig. 14 - Left and center: Model after test T25; Right: Roundhead scanned with Kinect© after test T25.

     Fig. 15 - Tests T21-T25. Armour layer eroded depth, in mm (Red - erosion; Green - deposition). Left: Global estimate; Right: Local estimate

82   Italian Journal of Engineering Geology and Environment, 1 (2020)                © Sapienza Università Editrice                                 www.ijege.uniroma1.it
AN 3D SURVEY MODELLING FOR DAMAGE ASSESSMENT IN RUBBLE-MOUND BREAKWATERS UNDER OBLIQUE WAVE INCIDENCE
Fig. 16 - Left and center: Model after test T39. Right: Roundhead scanned with Kinect© after test T39.
Fig. 17 - Tests T35-T39. Armour layer eroded depth (in mm) (Red - erosion; Green - deposition). Left: Global estimate; Right: Local estimate.
between the armour units of the inner layer may have contributed series T21-T25 and T35-T39, respectively. This fact points out to
to an overestimation of the eroded depth, as well as slight the need of further investigation on more suitable grid spacing for
differences on the cloud alignment between clouds to compare. estimation of intermediate damage levels.
Since matching cells percentage between compared clouds was
around 98%, it may be concluded that the overestimation is CONCLUSIONS
mainly caused by the gaps between the armour units. A stretch of a rubble-mound breakwater (head and part of
For the same reason, for both test series, the number the adjoining trunk, with a slope of 1(V) : 2(H) was built in a
of displaced units based on the local eroded volume is also wave basin at the Leibnitz University Hannover to assess, under
overestimated for initial and intermediate damage stages, with extreme wave conditions (wave steepness of 0.055) with different
percentage errors higher than 42%. Nevertheless, for the highest incident wave angles (from 40º to 90º), the structure behavior in
damage stages, both counted and estimated numbers of displaced what concerns wave run-up, overtopping and damage progression
units converge, with percentage errors of 0.5% and 4.3% for test of the armour layers, composed by rock and Antifer cubes.
Fig. 18 - Test series T21-T25 and T35-T39. Counted and estimated displaced armour units based on the local eroded volume.
Italian Journal of Engineering Geology and Environment, 1 (2020) © Sapienza Università Editrice www.ijege.uniroma1.it 83R. LEMOS, E. PEÑA, J. SANTOS, J. SANDE, A. FIGUERO, A. ALVARELLOS, E. LAIÑO, M. T. REIS, C. J. FORTES, N. B. KERPEN & R. COELHO
Non-intrusive methodologies were used for the assessment of suitable number of overlapping scans, density of point clouds and
the armour layer damage evolution, including a laser scanning grid step for high porosity armour layers, especially for surveys
technique and a Kinect© motion sensor. of submerged sceneries.
The aim of the present work was to characterize damage Once this goal is achieved, the presented innovative survey
evolution, based upon surveys carried out with the Kinect© techniques of the armour layer of a scale model breakwater seem
motion sensor, for 4 of the 11-test series conducted during the to be powerful tools for damage evolution assessment.
test programme. Results suggest that the sensor can be used by laboratories
Regarding damage evolution during the test series, tests and research groups to identify different damage stages. Such
conducted with an angle of attack of 90°, directional spreading results are relevant to understand first stages of damage.
of 0° (long-crested waves), and with an angle of attack of 40°, The use of a non-dimensional damage parameter based on the
directional spreading of 50° (short-crested waves), presented the eroded volume to estimate the number of armour layer displaced
highest localized damage at the roundhead. units seems to be easily applicable. Future works will comprise
Tests conducted with similar wave conditions (depth of 0.60 the application of this non-dimensional damage parameter to
m and an angle of attack of 40°) presented a higher localized consecutive photogrammetric aerial surveys of breakwaters.
damage when conducted with a directional spreading of 50° than
with a spreading of 0°. ACKNOWLEDGEMENTS
In what concerns the use of the Kinect© sensor, damage This project has received funding from the European Union’s
estimation using the global eroded volume overestimated the Horizon 2020 research and innovation programme under grant
number of displaced units. On the other hand, damage estimation agreement No. 654110, HYDRALAB+.
using the local eroded volume converged with the counted The authors would like to acknowledge all the other
displaced armour units, when applied to high damage stages. participants on the “RODBreak” project: Francisco Pedro, Mário
Nevertheless, it also overestimated initial and intermediate Coimbra, Moritz Koerner, Julius Weimper, Antje Bornschein,
damage stages, as increasing gaps between armour units were Bastien Dost, Bas Hofland, Jeroen Van den Bos, Rita Carvalho
wrongly computed as removed units. Small errors on the alignment and Reinhard Pohl.
between clouds to be compared, may also have contributed to The authors also acknowledge the support from LUFI, namely
this overestimation. This fact points out to the need of performing from Sven Liebish and the people at the Laboratory “Hannover
more experiments with the Kinect© sensor to achieve the most Marienwerder”: Björn, Mareike, Mario, Raoul and Tom.
REFERENCES
Booij N., Ris R.C. & Holthuijsen L. H. (1999) - A third-generation wave model for coastal regions. 1. Model Description and validation - J. Geophys. Res,
104: 7649 - 7666.
Broderick L. & Ahrens J.P. (1982) - Rip-rap stability scale effects. Technical Paper 82-3, U.S. Army Engineer Waterways Experiment Station, Coastal
Engineering Research Center, Vicksburg, MS.
Castaneda V. & Navab N. (2011) - Time-of-flight and Kinect imaging. Lecture online, Munich Technical University. http://campar.in.tum.de/twiki/pub/Chair/
TeachingSs11Kinect/2011-DSensors_LabCourse_Kinect.pdf.
Chen Y. & Medioni G. (1991) - Object modelling by registration of multiple range images. International Conference on Robotics and Automation, Sacramento,
California.
Girardeau-Montaut D. (2006) - Détection de changement sur des données géométriques tridimensionnelles. PhD thesis (French).
Van der Meer, J.W., Allsop, N.W.H., Bruce, T., De Rouck, J., Kortenhaus, A., Pullen, T., Schüttrumpf, H., Troch, P. and Zanuttigh, B (2018) –
EurOtop. Manual on Wave Overtopping of Sea Defences and Related Structures. An Overtopping Manual Largely Based on European Research, but for
Worldwide Application.
Hofland B., Disco M. & Van Gent M.R.A. (2014) - Damage characterization of rubble mound roundheads. Proc. of CoastLab 2014, Varna, Bulgaria.
Hofland B., Van Gent M.R.A., Raaijmakers T. & Liefhebber F. (2011) - Damage evaluation using the damage depth. Proc. of Coastal Structures 2011,
Yokohama, Japan.
Lague D., Brodu N. & Leroux J. (2013) - Accurate 3D comparison of complex topography with terrestrial laser scanner: application to the Rangitikei canyon
(N - Z). ISPRS J. of Photogrammetry and Remote Sensing, 82: 10-26. https://doi.org/10.1016/j.isprsjprs.2013.04.009.
Lemos R., Santos J.A. & Fortes C.J. (2017) - Rubble mound breakwater damage assessment through stereo photogrammetry in physical scale laboratory tests.
RIBAGUA - Revista Iberoamericana del Agua, Taylor and Francis, http://www.tandfonline.com/doi/full/10.1080/23863781.2017.1381455.
Maciñeira E. & Burcharth H.F. (2016) - Stability of cube armoured roundheads exposed to long crested and short crested waves. Coastal Engineering, 112:
99 - 112. http://dx.doi.org/10.1016/j.coastaleng.2016. 03.002.
84 Italian Journal of Engineering Geology and Environment, 1 (2020) © Sapienza Università Editrice www.ijege.uniroma1.itAN 3D SURVEY MODELLING FOR DAMAGE ASSESSMENT IN RUBBLE-MOUND BREAKWATERS UNDER OBLIQUE WAVE INCIDENCE
Melby J.A. & Kobayashi N. (1998) - Progression and variability of damage on rubble mound breakwaters. Journal of Waterway, Port, Coastal, and Ocean
Engineering, 124 (6): 286 - 294.
Molines J., Herrera M.P., Perez T.J., Pardo V. & Medina J.R. (2012) - Laser scanning technique to quantify randomness in cube and cubipod armour layers.
Proc. of CoastLab 2012, Ghent, Belgium.
Musumeci R., Moltisanti D, Foti E. & Battiato S. (2018) - 3-D monitoring of rubble-mound breakwater damages. Measurement, 117: 347 - 364. https://doi.
org/10.1016/j.measurement.2017. 12.020.
Puente I., Sande J., González-Jorge H., Peña E., Maciñeira E., Martínez-Sánchez J. & Arias P. (2014) - Novel image analysis approach to the terrestrial
LiDAR monitoring of damage in rubble mound breakwaters. Ocean Engineering, 91: 273 - 280.
Rigden T. & Steward T. (2012) - Use of 3D laser scanning in determining breakwater damage parameters. Proc. of CoastLab 2012, Ghent, Belgium.
Sande J., Peña E., Neves M.G., Lemos R., Figuero A., Reis M.T., Alvarellos A. & Rabuñal J. (2018) - Application of scanning techniques for damage
analysis in rubble mound breakwaters. Proc. of CoastLab 2018, Santander, Spain.
Santos J.A., Lemos R., Weimper J., Gronz O., Hofland B., Sande J., Peña E., Reis M.T., Fortes C.J., Figuero A., Bornschein A., Kerpen N., Pedro F., Coimbra
M., Körner M., Van den Bos J., Dost B., Carvalho R., Alvarellos A. & Pohl R. (2019) - RODBreak - Wave run-up, overtopping and damage in rubble-
mound breakwaters under oblique extreme wave conditions due to climate change scenarios. Data Storage Report. https://doi.org/10.5281/zenodo.3355657.
Soares F., Henriques M. & Rocha C. (2017) - Concrete block tracking in breakwater models. Proc. of FIG Working Week 2017, June, Helsinki, Finland.
Van der Meer J.W. (1988) - Rock slopes and gravel beaches under wave attack. Ph.D. thesis, Delft University of Technology, The Netherlands; also Delft
Hydraulics Publ. 396.
Van Gent M.R.A. (2014) - Oblique wave attack on rubble mound breakwaters. Coastal Engineering, 88: 43 - 54.
Yu Y.-X., Liu S.-X. & Zhu C.-H. (2002) - Stability of armour units on rubble mound breakwater under multi-directional waves. Coastal Engineering Journal,
44 (2): 179 - 201.
Received September 2019 - Accepted January 2020
Italian Journal of Engineering Geology and Environment, 1 (2020) © Sapienza Università Editrice www.ijege.uniroma1.it 85Puoi anche leggere