THE IMPACT OF NEW TECHNOLOGIES IN THE ENGINEERING CLASSIFICATION OF ROCK MASSES
←
→
Trascrizione del contenuto della pagina
Se il tuo browser non visualizza correttamente la pagina, ti preghiamo di leggere il contenuto della pagina quaggiù
DOI: 10.4408/IJEGE.2019-01.S-06

  THE IMPACT OF NEW TECHNOLOGIES IN THE ENGINEERING CLASSIFICATION
                          OF ROCK MASSES

            MIRKO FRANCIONI(*), NICOLA SCIARRA(*), MONICA GHIROTTI(**), LISA BORGATTI(***),
                         RICCARDO SALVINI(****) & FERNANDO CALAMITA(*)
                            (*)
                              University “G. d'Annunzio” Chieti-Pescara - Department of Engineering and Geology - Chieti, Italy
                                    (**)
                                         University of Ferrara - Department of Physics and Earth Sciences - Ferrara, Italy
     (***)
           Alma Mater Studiorum Università di Bologna – Dep. of Civil, Chemical, Environmental and Materials Engineering DICAM - Bologna, Italy
     (****)
            University of Siena Department of Environment – Siena, Italy & Earth and Physical Sciences and Centre of Geotechnologies, San Giovanni
                                                                      Valdarno, AR, Italy
                                                        Corresponding author: Mirko.francioni@unich.it

EXTENDED ABSTRACT
     La caratterizzazione degli ammassi rocciosi rappresenta il primo step nell’analisi ingegneristica dei versanti rocciosi e dei tagli stradali.
Le classificazioni RMR (Rock Mass Rating), SMR (Slope Mass Rating), Q-System e la più recente Q-Slope, sono le più utilizzate nella
geologia applicata e nell’ingegneria. Tra queste, SMR e Q-Slope rappresentano in generale la scelta più idonea nell’analisi dei versanti
naturali e nei tagli stradali. I dati necessari all’utilizzo di tali metodologie di classificazione vengono solitamente ricavati tramite rilievi
geomeccanici in sito. I rilievi convenzionali sono però condizionati dall’assetto del versante in studio. Infatti, nel caso in cui il versante sia
di elevata altezza o nel caso non sia raggiungibile in condizioni di sicurezza, l’utilizzo di tali tecniche di rilievo risulta difficile e spesso i
dati ottenuti non sono rappresentativi dell’intero affioramento.
     Negli ultimi anni, l’avvento di nuove tecnologie per il rilievo e l’analisi dei versanti ha notevolmente cambiato l’approccio allo studio
della qualità e stabilità degli ammassi rocciosi. In particolare, tecniche di rilievo da remoto, come la fotogrammetria terrestre ed il laser
scanning, rappresentano oggigiorno metodologie comunemente usate in questo tipo di analisi. Se da un lato l’utilizzo del laser scanner è,
nel mondo professionale, meno utilizzato a causa dei costi elevati, la fotogrammetria rappresenta una tecnica di rilievo affidabile ed
economica. In particolare, la tecnica “Structure from Motion” ha reso la creazione dei modelli fotogrammetrici tridimensionali più semplice
e speditiva. Nonostante ciò, anche nel caso della fotogrammetria, per creare modelli georeferenziati e scalati è necessario avvalersi di punti
di appoggio a terra, generalmente acquisiti tramite stazione totale o GPS. L’utilizzo di tali strumenti incrementa i costi associati a questa
tecnica.
     In questo studio, gli autori evidenziano il ruolo delle nuove tecnologie nelle classificazioni geomeccaniche. Saranno proposti due tipi
di approccio, applicati nei versanti sovrastanti la strada provinciale SP52, nell’area della Montagna dei Fiori (Appennino Centrale), la quale
attraversa diverse formazioni della successione Umbro-Marchigiana. Il primo approccio, speditivo ed economico, è basato sull’utilizzo di
rilievi convenzionali e permette, tramite l’impiego di applicazioni per smartphones, di calcolare il Q-Slope e l’angolo di sicurezza limite
del versante direttamente sul campo. Nel secondo approccio, di dettaglio e approfondito, si combinano in maniera integrata rilievi
convenzionali, fotogrammetrici e Sistemi Informativi Geografici (GIS). In particolare, viene presentato un nuovo metodo per l’utilizzo
della fotogrammetria che permette di ottenere modelli 3D georeferenziati senza l’ausilio della stazione totale e del GPS, abbassando
notevolmente i costi associati a tale tecnica. I dati raccolti tramite fotogrammetria sono integrati con i dati provenienti da rilievi
geomeccanici classici allo scopo di creare un database di informazioni completo e rappresentativo dell’area di studio. Tale database verrà
organizzato tramite GIS con lo scopo di incrementare l’interpretazione dei dati e, tramite l’utilizzo di carte tematiche, facilitare il calcolo
di parametri geomeccanici anche in aree dove non sono stati effettuati rilievi diretti. Utilizzando tale approccio sarà possibile calcolare il
Q-Slope, l’angolo di sicurezza limite e lo SMR. In ambito di valutazione delle condizioni di stabilità di versanti stradali, l’utilizzo combinato
delle classificazioni Q-Slope e SMR risulta essere di notevole importanza in quanto grazie al Q-Slope è possibile ottenere l’angolo di
sicurezza limite del versante sovrastante la strada, mentre con lo SMR si può definire la qualità dell’ammasso roccioso e, in relazione a
ciò, suggerire le più idonee opere di messa in sicurezza o contenimento. Ne consegue che queste informazioni permettono di effettuare una
indagine geologica-tecnica in grado di definire, in base ai costi ed alle esigenze, la possibilità di adottare nella progettazione l’angolo di
sicurezza ottenuto dal Q-Slope o, se questo non fosse possibile o economicamente non vantaggioso, di suggerire le opere di sostegno da
attuare nel caso di tagli stradali con angoli più elevati rispetto a quello di sicurezza.

Italian Journal of Engineering Geology and Environment, Special Issue 1 (2019)© Sapienza Università Editrice                   www.ijege.uniroma1.it   33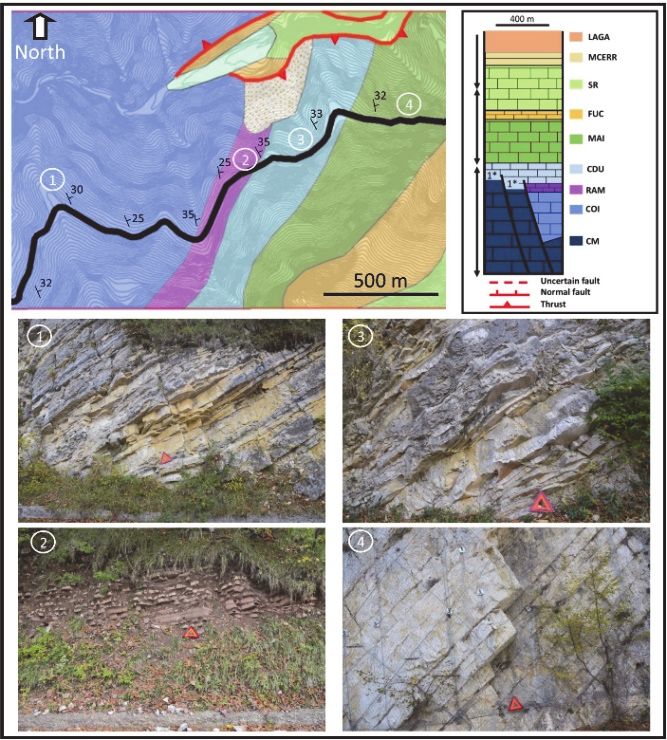
THE IMPACT OF NEW TECNOLOGIES IN THE ENGINEERING CHARACTERIZATION OF ROCK MASSES

      ABSTRACT                                                                                    homogeneous and heterogeneous rock masses (HOEK & BROWN,
           The engineering classification of rock masses represents the                           1997). This method is simple and useful, especially when
      first stage in the analysis and characterization of rock slopes and                         numerical simulations are needed, but it was not developed to
      road cuts. Among the existing classification methods, four                                  provide preliminary information for engineered slope, open pit
      systems are mainly used for mining, tunneling and slope design:                             mines and road cut design. In this context, the more suitable
      the RMR, the Q-system/Q-Slope, the GSI and the SMR.                                         classification systems are the SMR and the Q-Slope. In this
      Software has been recently developed for using these                                        research, we present the combined use of these classification
      classification systems and some, such as Q-system/Q-slope, are                              methods in the Montagna dei Fiori area, Italian Central
      also available as smartphone applications, to be directly used on                           Apennines (Figure 1).
      the field. Rock mass parameters necessary for such classification
      systems are usually obtained through engineering geological
      analyses along scanlines. Nowadays, the advent of new
      technologies has led to step-change increase in the quality of
      data available for the study of rock slopes. These include new
      remote sensing sensors, platforms, new techniques and software
      for engineering rock mass analyses. Data obtained from these
      techniques, integrated with field geomechanical measurements,
      can improve the quality of engineering rock mass classifications.
      Furthermore, Geographic Information Systems provide a useful
      tool for managing such data and performing regional rock mass
      analyses, suitable in the study of rock slopes and road cut design.
      In this context, this research aims to analyze: i) the importance
      of using remote sensing and GIS techniques in engineering rock
      mass classifications; ii) the advantages of combining different
      engineering classification systems and iii) the possible use of
      low-cost technique for engineering design.

      KEYWORDS: rock mass classification, new technologies, smartphone
      applications, photogrammetry, GIS

      INTRODUCTION
          Engineering rock mass classifications represent an important
      aspect of engineering geological analyses, especially during the
      feasibility study for roads and/or tunnels and for understanding                            Fig. 1- Montagna dei Fiori area and SP52 road
      the rock mass quality of natural and engineered rock slopes
      (GHIROTTI et alii, 2011; SALVINI et alii, 2013; SCIARRA et alii,                                The Montagna dei Fiori is an overturned anticline with an
      2015; SPREAFICO et alii, 2017). The Rock Mass Rating, RMR                                   NNW-SSE axial trend, which developed during the Lower
      (BIENIAWSKI, 1989), the Q-system (BARTON et alii, 1974) and                                 Pliocene and involves the Umbria Marche carbonate succession
      Q-Slope (BAR & BARTON, 2017), the Geological Strength Index,                                (Jurassic–Miocene) and the Messinian foredeep siliciclastic
      GSI (HOEK & BROWN, 1997) and the Slope Mass Rating, SMR                                     deposits (MATTEI 1987; SCISCIANI et alii, 2002).
      (ROMANA, 1993; ROMANA et alii, 2015) are the most commonly                                      The SP52 road crosses the study area, running in an E-W
      used rock mass classification systems. The RMR and the Q                                    direction. Along the road, from west to east, the following
      systems were initially developed for tunnel engineering. The                                formations of the Umbria Marche succession outcrop: Marne
      RMR was subsequently adapted for slopes and foundations                                     con Cerrogna (MCERR, Miocene), Corniola (COI, Early
      (BIENIAWSKI, 1989) but its use in this type of studies is still                             Jurassic, overlaying the older Early Jurassic Calcare Massiccio,
      challenging. For this reason, when dealing with natural slopes or                           CM), Rosso Ammonitico (RAM, Early Jurassic), Formazione
      road cuts, the RMR is integrated by the SMR. The recent Q-                                  del Salinello and Calcari Diasprigni (CDU, Late/Middle
      Slope represents a modification of the Q-system and has been                                Jurassic), Maiolica (MAI, Early Cretaceous), Marne a Fucoidi
      intended for the study of reinforcement-free road or railway cuts                           (FUC, Early Cretaceous), and the Scaglia Rosata and Scaglia
      or open pit mines. GSI is based on the geological description of                            Cinerea (SR, Late Cretaceous–Oligocene). Figure 2 shows the
                                                                                                  geological map, the stratigraphic column (after MATTEI, 1987;

34    Italian Journal of Engineering Geology and Environment, Special Issue 1 (2019)© Sapienza Università Editrice                                www.ijege.uniroma1.it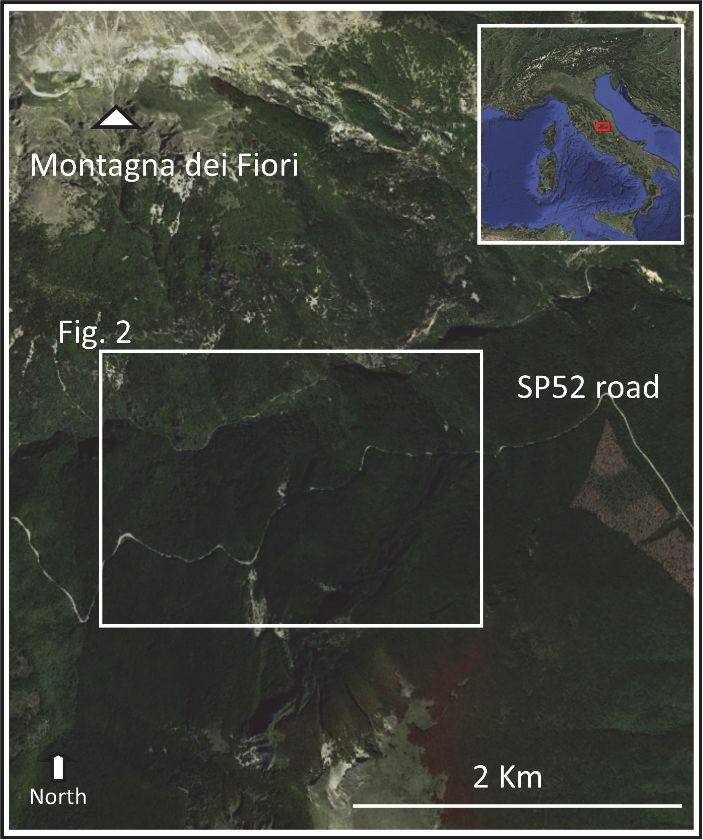
M. FRANCIONI, N. SCIARRA, M. GHIROTTI, L. BORGATTI, R. SALVINI & F. CALAMITA

FRANCIONI et alii, 2018a) and the photographs of the four                                       Approach 1 - rapid rock mass classification of rock slopes,
geological formations, COI, RAM, CDU and MAI,                                               performed directly in the field using conventional
characterizing the section of the SP52 road studied in this                                 geomechanical surveys and a smartphone application;
research.                                                                                       Approach 2 - in depth analysis of the outcrops integrating
                                                                                            conventional geomechanical surveys, DP and GIS.
                                                                                                Approach 1 has been adopted for rock mass characterization
                                                                                            through the Q-Slope smartphone application (Gecko
                                                                                            Geotechnics, http://www.geckogeotech.com/q-slope/). Data
                                                                                            necessary for the use of the smartphone application is: slope
                                                                                            height, slope angle, slope stability, RQD-Rock Quality
                                                                                            Designation, joint set number, joint roughness and alteration,
                                                                                            orientation factor, Jwice (environmental and geological
                                                                                            conditions) and Strength Reduction Factor. The smartphone
                                                                                            application allows to select these parameters among a list of pre-
                                                                                            definite values, making the use of the Q-slope classification easy
                                                                                            and quick. With regard to the Approach 2, an easy method for
                                                                                            creating georeferenced DP 3D model of slopes without the need
                                                                                            for total station and GPS is presented. This is based on the use
                                                                                            of an object of known geometry that is located on the slope under
                                                                                            study and that provides references during the creation of the 3D
                                                                                            model. In this case, we have used an emergency warning car
                                                                                            triangle. The dip and dip direction of the surface of the triangle
                                                                                            and the angle between its base and the horizontal have been
                                                                                            measured through a geological compass. These measurements
                                                                                            are used in 3D CAD software for reconstructing the 3D
Fig. 2 - Geological map of the area highlighted in Figure 1 by the white                    geometry of the object (3D roto-translation) and to extract the
       rectangle with the stratigraphic column (after Mattei, 1987) and                     coordinates of its vertices, which will be used as ground control
       photographs of the four geological formations characterizing the                     points during the creation of the 3D photogrammetric model by
       section of the SP52 road studied in this research. Photographs
       are taken looking toward South. Red triangle with 0.425 cm length
                                                                                            the “Structure from Motion” technique (RONCELLA et alii, 2005;
       side as scale                                                                        ASSALI et alii, 2004; VASUKI et alii, 2004).
                                                                                                The CAD 3D roto-translation, carried out using the
     The study of natural and engineered rock slopes can often be                           geological compass measurements, allow to obtain North-
challenging due to the inaccessibility of the slopes and the risk                           oriented ground control points and, consequently, North-
for the surveyors. In this context, remote sensing techniques can                           oriented 3D DP models. These can therefore be used for
be useful in both improving the amount and quality of data and                              measuring the geometry and orientation of geological features
decreasing the time and risk of the survey (FRANCIONI et alii,                              (FRANCIONI et alii, 2019). The DP survey has been performed
2018b). In this research, a low-cost Digital Photogrammetry                                 using a reflex digital camera and commercial smartphones. This
(DP) method for creating georeferenced 3D model of slopes                                   methodology has been validated comparing the 3D DP model of
without the need for total station/GPS is presented. Furthermore,                           a travertine slope outcropping in Civitella del Tronto (Central
the use of commercial smartphone for DP is introduced. Data                                 Italy) with a Laser Scanning (LS) model. The 3D models of the
obtained from DP surveys and conventional geomechanical                                     slopes obtained using this approach has a centimetric accuracy
scanlines are integrated and analyzed through GIS to improve                                suitable to extract data useful for the characterization of the slope
the understanding about slope failures and rock mass quality                                under study such as discontinuity sets, discontinuity spacing and
(FRANCIONI et alii, 2018c). The Q-Slope and SMR                                             trace length. This information, manually extracted from the 3D
classifications have been used/combined for the engineering                                 models using CloudCompare software and integrated with field
study of the rock outcrops along the SP52 road.                                             data such as aperture, infilling material, etc., was then utilized to
                                                                                            classify the rock mass through the SMR and Q-slope systems.
METHODS                                                                                     These classifications are strongly affected by the geometrical
    Conventional geomechanical and DP surveys have been                                     relationship between slope and discontinuity attitudes. Due to
carried out along the SP52 road, in the Montagna dei Fiori area                             this, the results of such classification can vary within the same
(Figure 1). Two types of approach have been used:

Italian Journal of Engineering Geology and Environment, Special Issue 1 (2019)© Sapienza Università Editrice                             www.ijege.uniroma1.it      35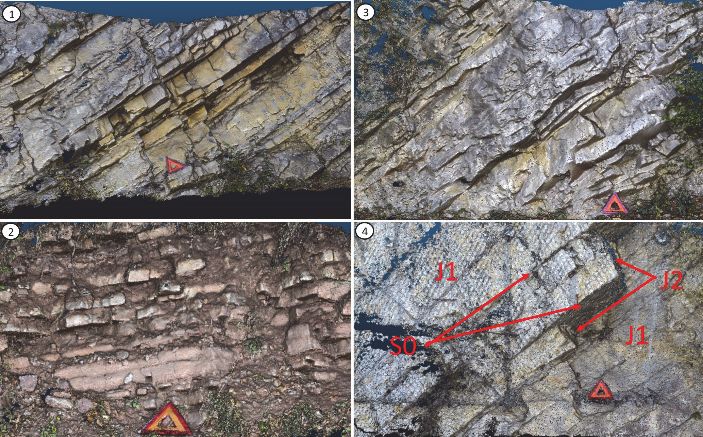
THE IMPACT OF NEW TECNOLOGIES IN THE ENGINEERING CHARACTERIZATION OF ROCK MASSES

      geological formation in case of slope attitude variations. In this                              The calculation of Q-slope value and steepest slope angle
      context, we have used GIS to create the slope and aspect                                    can be performed directly in the field through the smartphone
      thematic maps, representing the slope angle and the slope                                   application developed at this purpose (Approach 1). An example
      attitude, respectively. Combining the geomechanical/geological                              of results obtained using this approach is showed in Table 3,
      data with the information contained in these maps, it was                                   which highlights the Q-slope and β values for the four geological
      possible to extrapolate the SMR also in inaccessible areas.                                 formations surveyed.

      RESULTS                                                                                         Geological formation and
                                                                                                                                        Q Slope              β
          Conventional geomechanical surveys have been integrated                                       slope dip /dip direction
      with DP analyses. The data obtained are listed on Table 1 and 2.                                       MAI (75/162)                0.61                61
      These data have been used in the Q-Slope and SMR
                                                                                                             CDU (84/319                 0.69                62
      classification systems for the calculation of the Q-slope value,
      the steepest slope angle (β) and the SMR value.                                                       RAM (75/340)                 0.27                53
                                                                                                             COI (83/318)                 0.8                63
        Formation        Joint set          Dip°/Dip Dir°     n. poles                            Tab. 3 - Q-slope and β values calculated using the Approach 1
                            S0                 39/077                45
                                                                     67                               When using DP, we can create a 3D model of outcrops,
           MAI               J1                86/163
                                                                                                  which can be studied/analyzed in post-processing. DP allows to
                             J2                59/243                44
                                                                                                  extract a lot of geomechanical information representative of the
                            S0                 36/066                45                           entire slope. In this research, we were able to extract from the
                                                                     59                           DP models the slope attitude, the discontinuity dip and dip
           CDU               J1                54/264
                                                                                                  directions, spacing and persistence. These information have
                             J2                74/336                48
                                                                                                  been integrated with field geomechanical data. Figure 3 shows
                            S0                 22/088                48                           an example of the 3D models of the outcrops obtained using DP.
           RAM               J1                78/324                42

                             J2                66/249                40

                            S0                 31/077                58

            COI              J1                77/339                47

                             J2                69/256                59

      Tab. 1. Discontinuity sets

                                     MAI            CDU            RAM            COI
           UCS (MPa)                 75              74             59             85
              RQD%                   75              57             29             81
                                                                                                  Fig. 3 - 3D models of: 1) COI; 2) RAM; 3) CDU; 4) MAI. In the MAI
           Spacing (m)               0.23           0.11            0.1           0.3                      formation, the discontinuity sets are highlighted in red. Red
                                                                                                           triangle with 0.425 cm length side as scale
            Length (m)               15              20             15             10
         Aperture (mm)               2-30          1-100            1-7          1-100                The proposed DP method has been validated comparing the
            Roughness             Smooth           Rough          Rough         Rough             3D DP model in a travertine slope outcropping in Civitella del
                                                                                                  Tronto, Central Italy (Figure 4A) against a LS model. The
             Infilling               Soft           Soft           Soft           Soft
                                                                                                  comparison showed the good agreement between DP and LS
           Weathering             Moderate        Moderate         High          High
                                                                                                  data. The differences between DP and LS increase with the
                  Jv                 8.9            17.9           23.5           6.7             distance from the object of known geometry, up to 5 cm at 15 m
      Tab. 2. - Geomechanical characteristics of the formations (discontinuity                    of distance (red areas in Figure 4B). The DP methodology has
               properties refer to the most critical joint sets in each geological                been also tested using smartphone cameras. In this case, the
               formation)                                                                         errors increase up to 8-10 cm at 15 meters of distance from the
                                                                                                  ground control points, but in general the DP model is still in good
                                                                                                  agreement with LS model (Figure 4C).

36    Italian Journal of Engineering Geology and Environment, Special Issue 1 (2019)© Sapienza Università Editrice                                  www.ijege.uniroma1.it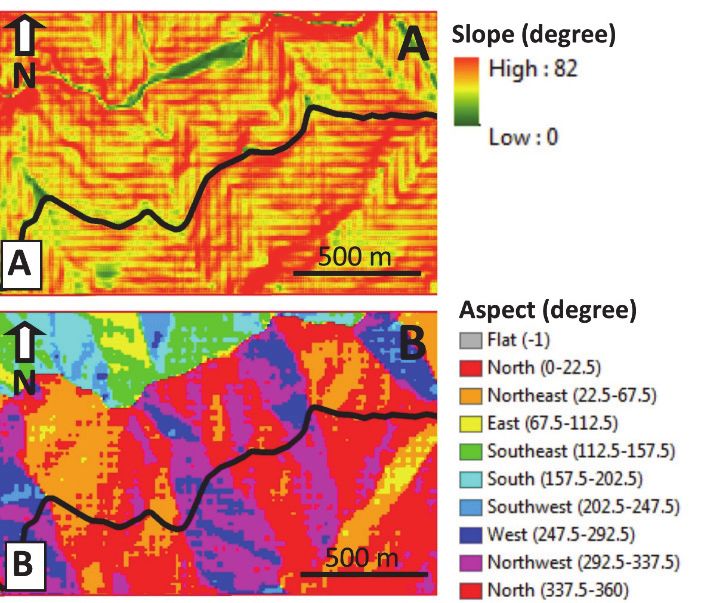
M. FRANCIONI, N. SCIARRA, M. GHIROTTI, L. BORGATTI, R. SALVINI & F. CALAMITA
and Aspect GIS thematic maps (Figure 5 A-B) are used to
identify the variation of slope dip and dip direction.
This information, integrated with the geological map (Figure
2) and data collected for each geological formation using
geomechanical survey and DP (Table 2 and 3), allows the semi-
automatic calculation of Q-slope values, steepest slope angles
and SMR in each section of the study area, included inaccessible
ones. Figure 6A-D shows the results of this process highlighting
the Q-slope (Figure 6B), steepest slope angle (Figure 6C) and
SMR values (Figure 6D) for every section of the SP52 road.
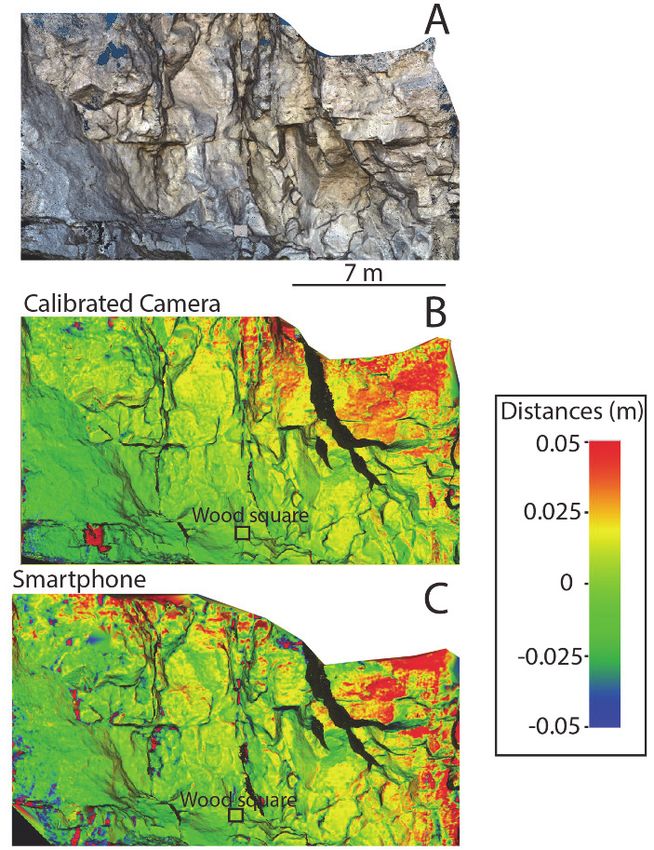
Fig. 4. 3D validation of the proposed DP methodology in a travertine
slope at Civitella del Tronto, Central Italy. A) Photogrammetric
3D model obtained using reflex digital camera. B) Comparison
between DP model obtained through reflex digital camera and Fig. 5 - Thematic Slope (A) and Aspect (B) maps
LS. C) Comparison between DP model obtained through reflex
digital camera and LS. View of models toward East
To further verify the quality of the DP models, we have
compared measurements of the same discontinuity surfaces
taken with the compass and the DP and LS models. Table 4
shows the results of such comparison in relation to the four
surfaces shown in Figure 4A, highlighting the good agreement
between the manual and DP/LS measurements.
Method Surface 1 Surface 2 Surface 3 Surface 4
Compass 86/247 72/114 82/298 74/276
Reflex 87/248 71/113 88/295 77/271
Smartphone 89/248 72/114 88/297 79/277
Fig. 6 - A) White line indicates the SP52 road in the orthophoto of the
LS 89/250 67/112 87/297 79/275
study area. B) Semi-automatic calculation of Q-slope values: C)
Tab. 4 - Dip and Dip direction of the 4 surface highlighted in Figure 4A Steepest slope angles: C) SMR (after Francioni et alii, 2018a)
acquired with compass, DP and LS
DISCUSSION AND CONCLUSIONS
As aforementioned, the Q-slope and steepest slope angle
Geological engineering characterization of rock masses
values, as well as the SMR, change in relation to the slope
represents the first step in road cuts engineering design. When
attitude, even within the same geological formation. For this
dealing with such interventions it is important to consider both
reason, GIS can be very useful for managing the information
the costs and the risks associated with the engineering solution
obtained from geological, geomechanical and DP surveys. Slope
to be adopted.
Italian Journal of Engineering Geology and Environment, Special Issue 1 (2019)© Sapienza Università Editrice www.ijege.uniroma1.it 37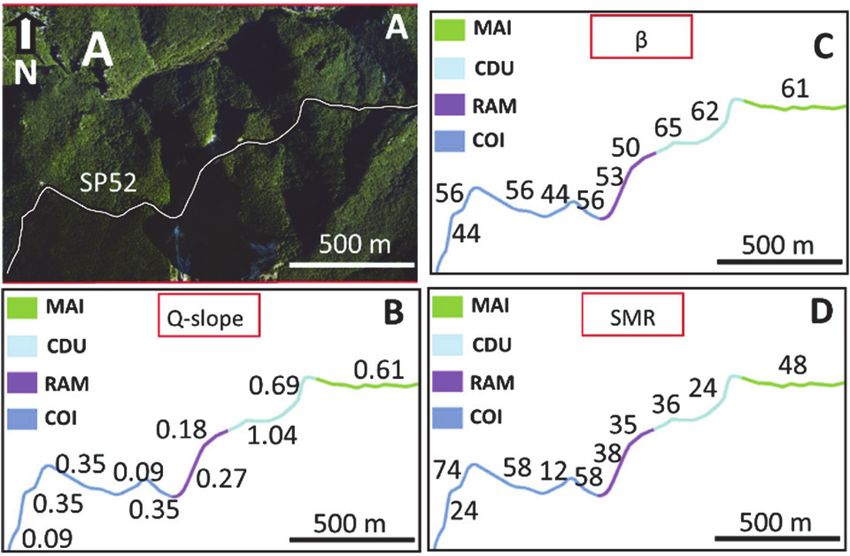
THE IMPACT OF NEW TECNOLOGIES IN THE ENGINEERING CHARACTERIZATION OF ROCK MASSES

           The cost of engineering classification of rock masses                                      Finally, it is important to note how the use of remote sensing
      depends on the approach decided to be use. A rapid approach,                                techniques allows to decrease the time of the field survey and the
      such as the described Approach 1, has very low-cost mainly                                  risk for the surveyor. The combined use of Q-slope and SMR is
      associated with the time necessary for the geomechanical                                    important because the SMR defines the possible kinematic
      analyses. The advent of dedicated smartphone applications, such                             problems and, in relation to the SMR class, ROMANA (1993)
      as the Q-slope one, makes this approach easier and even more                                suggests engineering solutions for stabilizing the slopes. Q-slope
      attractive. However, the results of this classification is connected                        allows the definition of the steepest slope angles. Therefore, the
      to the amount of measurements taken in the field and, often,                                proposed methodology permits to estimate the slope angle to be
      representative of the section of the outcrop that has been                                  adopted without reinforcements and, at the same time, the
      surveyed. When using DP, costs can increase, especially if total                            possible solutions in case the slope could not be designed with
      station or GPS are necessary. Using the DP method proposed in                               such angle. Figure 7 shows an example of geomechanical map,
      Approach 2, it is possible to avoid the use of GPS/total station                            highlighting SMR and β, achievable using the proposed
      and therefore decrease the cost of DP. The use of smartphone, as                            approach. The best cost-effective solution during engineering
      tested in this research, furtherly decreases the costs (which                               road design can be decided accordingly, decreasing the cost and
      becomes comparable with the costs associated with Approach 1)                               the risk during the design of road cuts.
      but the precision of the model slightly decreases. In this case, it
      is suggested to validate the model in respect of field
      measurements. DP allows to improve the quality and the amount
      of data, making the analysis more consistent. Data become
      representative of the entire slope and it will be possible to
      perform more reliable kinematic slope analyses. The use of GIS
      permits to furtherly improve the data managing and to define the
      slope dip and dip direction also in inaccessible areas. This
      information can be combined with the geomechanical
      characteristics of the geological formation to understand the
                                                                                                  Fig. 7 - SMR classes and steepest slope angle (β).
      geometrical relationship between slope and discontinuity sets.
      Through this approach, engineering rock classification values
      can be extrapolated also to inaccessible areas (if the geology is
      known).

      REFERENCES
      ASSALI, P., GRUSSENMEYER, P., VILLEMIN, T., POLLET, N., & VIGUIER, F. (2014). Surveying and modeling of rock discontinuities by terrestrial laser
          scanning and photogrammetry: Semi-automatic approaches for linear outcrop inspection. Journal of Structural Geology, 66, 102-114.
      BAR N. & BARTON N. (2017) - The Q-Slope method for rock slope engineering. Rock Mechanics and Rock Engineering 50 (12): 3307-3322.
      BARTON N. & GRIMSTAD E. (2014) - Tunnel and cavern support selection in Norway, based on rock mass classification with the Q-system. Norwegian
          Tunnelling Society 23: 45-77.
      BARTON N.R., LIEN R. & LUNDE J. (1974) Engineering classification of rock masses for the design of tunnel support. Rock Mech 6(4): 189-239.
      BIENIAWSKI Z.T. (1989) - Engineering Rock Mass Classifications. Wiley. New York.
      FRANCIONI, M., STEAD, D., SCIARRA, N. & CALAMITA, F. (2018a) - A new approach for defining Slope Mass Rating in heterogeneous sedimentary rocks
          using a combined remote sensing GIS approach. B Eng Geol Environ, https://doi.org/10.1007/s10064-018-1396-1.
      FRANCIONI M. COGGAN J. EYRE M. & STEAD D (2018b) - A combined field/remote sensing approach for characterizing landslide risk in coastal areas.
          International Journal of Applied Earth Observations and Geoinformation 67: 79-95.
      FRANCIONI M. SALVINI R. STEAD D. & COGGAN J.J. (2018c) - Improvements in the integration of remote sensing and rock slope modelling. Natural Hazards
          90: 975-1004.
      FRANCIONI, M., STEAD, D., SCIARRA, N., MATALONI, G. & CALAMITA, F. (2019) - A New Fast and Low-Cost Photogrammetry Method for the Engineering
          Characterization of Rock Slopes. Remote Sens. 11(11): 1267.
      GHIROTTI, M., MARTIN, S. & GENEVOIS, R. (2011) - The Celentino deep-seated gravitational slope deformation (DSGSD): Structural and geomechanical
          analyses (Peio Valley, NE Italy). Geological Society Special Publication 351: 235-251.
      HOEK E. & BROWN E.T. (1997) - Practical estimates of rock mass strength. Int J Rock Mech Min Sci 34 (8): 1165-86.
      MATTEI M, (1987) - Analisi geologico-strutturale della Montagna dei Fiori (Ascoli Piceno, Italia centrale). Geologica Romana 26: 327-347.
      ROMANA MR (1993) - A Geomechanical Classification for Slopes: Slope Mass Rating. Comprehensive Rock Engineering: Principles, Practice & Projects.
          Editor-in-Chief J. Hudson, Imperial College of Science, Technology & Medicine, London, UK, Volume 3: Rock Testing and Site Characterization.

38    Italian Journal of Engineering Geology and Environment, Special Issue 1 (2019)© Sapienza Università Editrice                                     www.ijege.uniroma1.it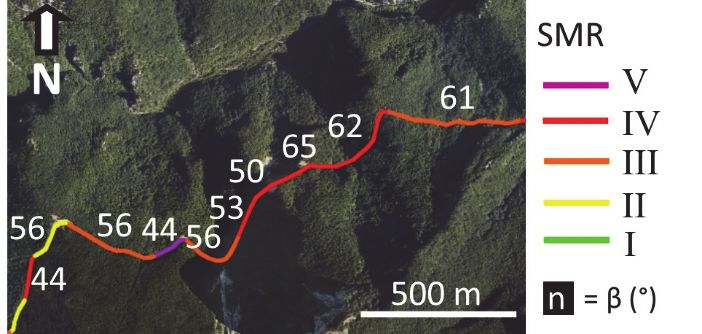
M. FRANCIONI, N. SCIARRA, M. GHIROTTI, L. BORGATTI, R. SALVINI & F. CALAMITA

ROMANA MR., TOMAS R. & SERON J.B. (2015) - Slope Mass Rating (SMR) geomechanics classification: thirty years review. 13th ISRM Congress
    Proceedings – International Symposium on Rock Mechanics, Quebec, Canada, May 10 to 13, 2015, 10 p.
RONCELLA, R., FORLANI, G., & REMONDINO, F. (2005). Photogrammetry for geological applications: automatic retrieval of discontinuity orientation in
    rock slopes. In Videometrics VIII (Vol. 5665). International Society for Optics and Photonics.
SALVINI R., FRANCIONI M., RICCUCCI S., BONCIANI F. & CALLEGARI I. (2013) - Photogrammetry and laser scanning for analyzing slope stability and rock
    fall runout along the Domodossola–Iselle Railway, the Italian Alps. Geomorphology 185: 110-122.
SCISCIANI V., TAVARNELLI E. & CALAMITA F, (2002) - The interaction of extensional and contractional deformations in the outer zones of the Central
    Apennines, Italy. Journal of Structural Geology 24: 1647-1658.
SCIARRA N., MARCHETTI D., D'AMATO AVANZI G. & CALISTA M. (2015) - Rock slope analysis on the complex Livorno coastal cliff (Tuscany, Italy).
    Geografia Fisica e Dinamica Quaternaria 37 (2): 113-130.
SPREAFICO M. C., CERVI F., FRANCIONI M., STEAD D. & BORGATTI L. (2017) - An investigation into the development of toppling at the edge of fractured
    rock plateaux using a numerical modelling approach. Geomorphology, 288: 83-98.
VASUKI, Y., HOLDEN, E. J., KOVESI, P., & MICKLETHWAITE, S. (2014). Semi-automatic mapping of geological Structures using UAV-based photogrammetric
    data: An image analysis approach. Computers & Geosciences, 69: 22-32.

Italian Journal of Engineering Geology and Environment, Special Issue 1 (2019)© Sapienza Università Editrice                  www.ijege.uniroma1.it   39
Puoi anche leggere