SIPOTRA - UNIVERSITÀ DI ROMA TOR VERGATA
←
→
Trascrizione del contenuto della pagina
Se il tuo browser non visualizza correttamente la pagina, ti preghiamo di leggere il contenuto della pagina quaggiù
RAPPORTO SIPOTRA 2017
          LE POLITICHE DEI TRASPORTI IN ITALIA
         Mobilità e logistica: strategie ed analisi di impatto
SCENARI PER LA MOBILITÀ E LA LOGISTICA: SFIDE ED OPPORTUNITÀ PER LE IMPRESE

                                      .
                                  29.11.2017

                 INNOVAZIONI TECNOLOGICHE
             E SERVIZI PER LA MOBILITA’ URBANA

                 AGOSTINO NUZZOLO
       SIPoTra – Università di Roma Tor Vergata
               nuzzolo@ing.uniroma2.it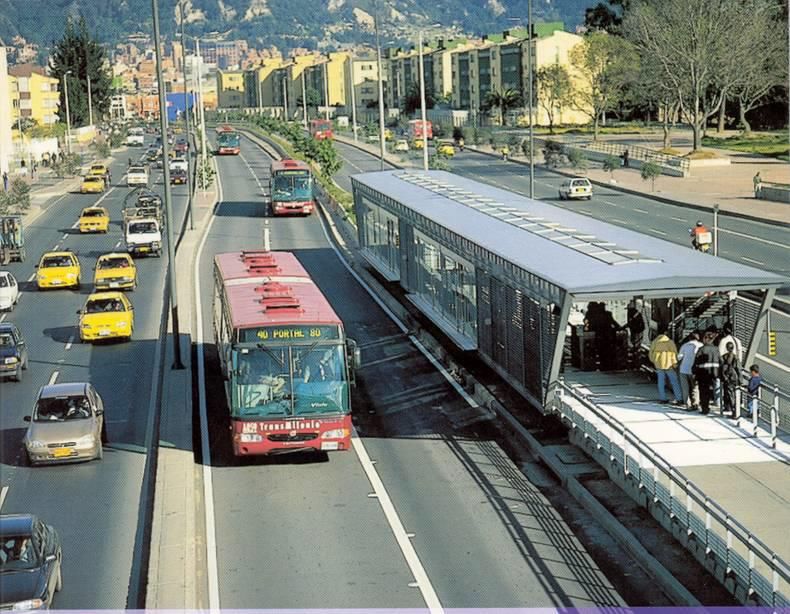
Sommario
1. Evoluzione del modello di
   mobilità metropolitana e la smart
   mobility
2. Alcuni fattori determinanti degli
   scenari di mobilità
3. I veicoli elettrici ed i veicoli
   automatici
4. La sharing mobility e la city
   logistics del futuro
EVOLUZIONE DEL MODELLO GENERALE DI MOBILITA’ URBANA
Dal modello mobilità sostenibile integrata con strategie portanti: sviluppo del
trasporto rapido di massa, integrazione modale e limitazioni e/o pricing
accesso aree centrali, incentivazione uso veicoli ecocompatibili, …
– all’attuale modello della smart mobility, con modalità condivise (shared),
  come car-share, ride-share, bike-share, crescita modalità attive (piedi e
  bici), ampio utilizzo ICT e ITS, diffusione veicoli elettrici+connessi +guida
  assistita (2010 – 2025).
– al futuro modello della sharing autonomous mobility con forte crescita
  car-share e uso intensivo veicoli self-driving e driverless (> 2025)

                                                                             3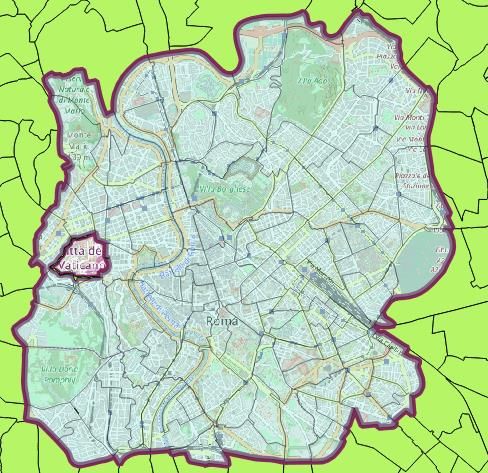
Mobility operation platforms
Piattaforme ICT di integrazione dell’intero processo del servizio di
trasporto

 Integrated platform for smart mobility to enable
 demand-adaptive transportation systems

                                                                       4
Example of travel
in mobility as a service context

                                   5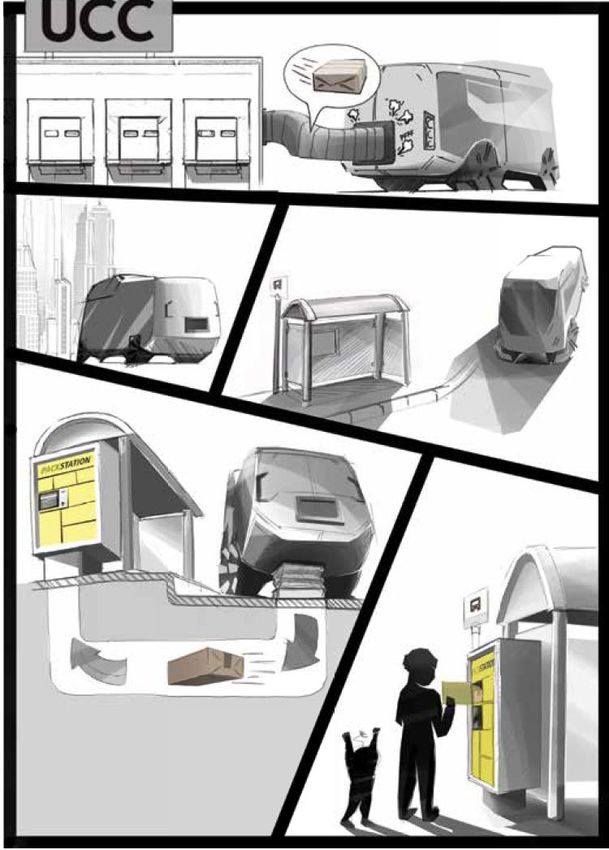
MaaS – Mobility as a Service
• Mobility solutions are consumed as a service, combining
  transportation services from public and private
  transportation providers through a unified gateway that
  creates and manages the trip, which users can pay for with a
  single account.
• Users can pay per trip or a monthly fee for a limited distance.
• The key concept behind MaaS is to offer both the travelers and
  goods seamless mobility solutions based on the travel needs.

Example
of services
                                                                6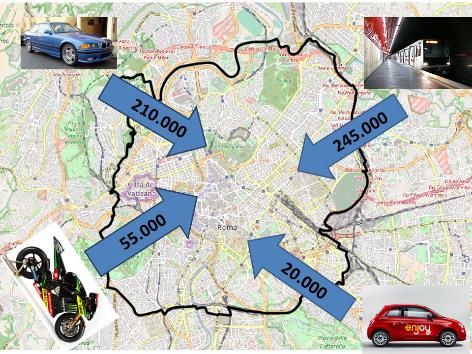
Smart parking and goods delivering

• Piattaforme
  informatiche per
  gestione prenotazioni
  e monitoraggio uso
  piazzole carico e
  scarico

                                       7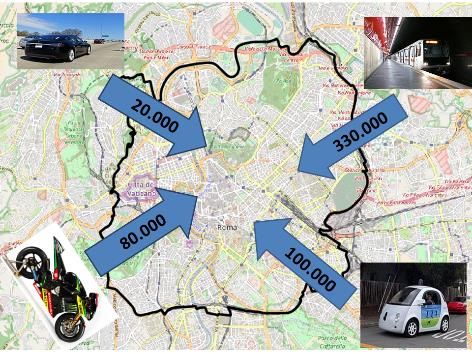
Alcuni determinanti
          degli scenari di mobilità futura
                                    Imprese settore mobilità e trasporti

                   Innovazione
                   tecnologica:
                       ICT+
                     Trazione              SCENARI di OFFERTA
                    elettrica +    Smart road
                      IA con       Intelligent P. T. Systems (scheduled,
                                   on             demand)                  Politiche europee,
                      veicolo
                                   Sharing modes                           nazionali e locali
                    automatico
                                   MaaS                                     di governance
                                                                                mobilità
Style of life                                                                 e territorio
(Millennials)
Sharing attitude
Economic level
Total Cost                                                                    Sostenibilità:
Ownership                                SCENARI di DOMANDA                • Emissioni CO2
                                                                           (accordo Parigi)
                                   Modal share:                            • Consumi
                     Possesso       • auto e moto individuali per tipo        energia
                    auto-moto       • trasporto pubblico ad orario         • Incidentalità
                   Tipo veicolo:    • trasporto pubblico a domanda            stradale
                      EV-AV         • sharing modes                        • Finanze
                                    • bici                                    pubbliche
                                    • piedi
                                                                                         8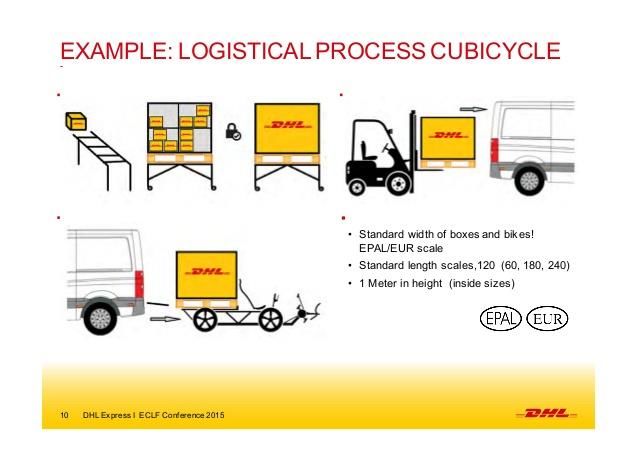
Vehicle electrification
• Current issues: driving range for fully
  electric vehicle, purchase cost, charging
  time, charging point density
• Current issues fully overcome by 2025
• Forecasted car sales shares:
              Electric Vehicle Sales Shares-United States and India
  100%

   75%
   50%
   25%

   0%

           2030                   2050               2030             2050
                                                                             9
                  United States                              India
                                  Private LDV   Shared LDV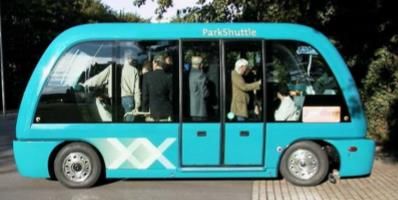
Vehicle automation levels:
driver role and driving type classification

  • Driving types:
    – AD - Assisted driving (level1)
    – SD- Self-driving (level 2/3)
    – DL - Driver-less (level 4/5)            10
Driving type for road lane type
Self-driving (SD) Driver-less (DF)
Lane Level 2 -3 Level 4-5
type
4-
GLHD
3-
GLLD
2-
RL
S
1-
PEL
2017 2020 2023 2026 2029
1: PEL - protected exclusive lane (only SD + DL)
2: RL - reserved lane (only SD + DF), but possible illegal access of other road users
3: GLLD - general-use lane, low and reliable traffic density
4: GLHD general-use lane, high and unreliable traffic density
11Self-driving/assisted driving per: taxi, car-share,
transit, on-demand bus, goods delivering, …..
On-demand bus for
Exclusive bus lanes railway station access
12Self-driving vehicle and city logistics
Emerging aspects of city logistics: Advantages from
self-driving
• E-commerce and speedy delivering • +
• Omni-channel logistics • =
• Horizontal and vertical cooperation • =
• Sustanaibility • +
• Multi-echelon • =
• Consumer-to-package C2P • =
• Containerisation • =
• Bike-delivering • =
13Driverless vehicles
and city logistics
• Conceptual solutions:
– Autonomous grocery
shopping
– Home delivery logistic
networks
– Autonomous parcels
– Pack station based
solution
– Support vehicles for
parcel deliveries 14Alcuni determinanti
degli scenari di mobilità futura
Imprese settore mobilità e trasporti
Innovazione
tecnologica: SCENARI di OFFERTA
ICT+ Smart road
Trazione Intelligent P. T. Systems (scheduled,
elettrica + on demand) Politiche europee,
IA Sharing modes nazionali e locali
MaaS di governance
…….. mobilità
Style of life
e territorio
(Millennials)
Sharing attitude
Economic level
Total Cost
Sostenibilità:
Ownership
SCENARI di DOMANDA • Emissioni CO2
Possesso (accordo Parigi)
auto-moto Modal share: • Consumi
Tipo veicolo: • auto e moto individuali per tipo energia
EV-AV • trasporto pubblico ad orario • Incidentalità
• trasporto pubblico a domanda stradale
• sharing modes • Finanze
• bici pubbliche
• piedi
15EV+AV Scenario
• Diffusione tendenziale di EV + AV
• Politiche di governance del territorio e della mobilità
come attuali
• Evoluzione tendenziale della quota di car sharing
Trend of car-sharing partecipation
16
•EV+AV scenario:
global external costs
• 2050 urban area scenario:
– population from 4 Md 2015 to 6.5Md 2050
– Cars: from 750M 2015 to 2.1 Md 2050
– Vkm: from 8.000 Md 2015 to 25.000 Md 2050
• Global external effects.
– Vehicle crash deads from 1.2 Ml 2015 to 1.0 Ml
– Energy: from 36 exajoules 2015 to 32 exajoules 2050
– CO2 emission: from 3 gigatonnes to 1,8 gigatonnes
2050 (required reduction for 2°C scenario, Paris
Agreement)
• Congestion: to be assesed, but very relevant
17EV+AV and car-share development:
sharing autonomous mobility
Base components of Private car Private car
mobility and land-use Taxi
governance:
- Smart road deployment Car sharing
SAEV
- .Transit Oriented Car-share
Ride sharing
Development in land-
use governance Public Transport Public Transport
- Travel Demand
Motorcycle, Motorcycle,
Management with area Bike, Walking Bike, Walking
pricing
- ……….
18Sharing Mobility Scenario
Global Results
Compared to the BAU case in 2050, the sharing mobility scenario
produces impressive global results. It would:
• Cut global energy use from urban passenger transportation by over
70%
• Cut CO2 emission by over 80%
• Cut the measured costs of vehicles, infrastructure, and
transportation system operation by over 40%
• Achieve savings approaching $5 trillion per year
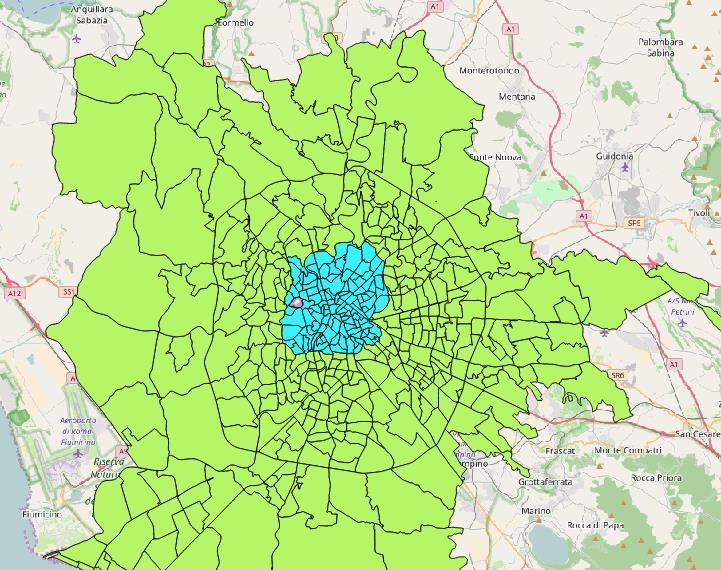
19Emission-free sharing-mobility in Rome 2035
AREA DI INTERVENTO
• Area interna all’anello
ferroviario, circa 30 kmq
• Residenti:
– attuali 460.000,
– futuri 400.000
• Posti lavoro:
– attuali 450.000,
– futuri 400.000
• + 25 km metro, 50 tra
esistenti e nuove
stazioni
• .
20SCENARIO SHARING MOBILITY AL 2035
LIMITAZIONI DI TRAFFICO AREA INTERVENTO 1
• .
• solo veicoli elettrici e self-driving +
bici + piedi
– bus su gomma interzonali
– 1000 Navette per accesso/egresso
rete su ferro e parcheggi, su 200
linee circolari con frequenza di 5’
– car share ( 35.000 veicoli da
providers privati)
– Auto e moto private
• obbligo di sosta fuori strada,
eccetto car share
• Area pricing
21SPOSTAMENTI AREA INTERVENTO ore 7-
10
CONFRONTO SCENARI 2035
TENDENZIALE SHARING MOBILITY
.
.200.000 Auto privata 40% 20.000 Autoprivata 4%
245.000 Trasp. Pubblico 46% 330.000 Trasp. Pubblico 62%
.
20.000 Car sharing 4% 100.000Car Sharing 19%
55.000 Moto, bici e piedi 10% 80.000 Moto, bici e piedi 15%
530.000 TOTALE 530.000 TOTALE 22Transition issues
• Rilevanti problemi per traffico
promiscuo veicoli tradizionali e veicoli
automated:
– Interventi sulle infrastrutture (smart
road)
– Regolazione, con specializzazione
strade e sede stradale con nuova
classificazione e norme uso (velocità e
tipo guida)
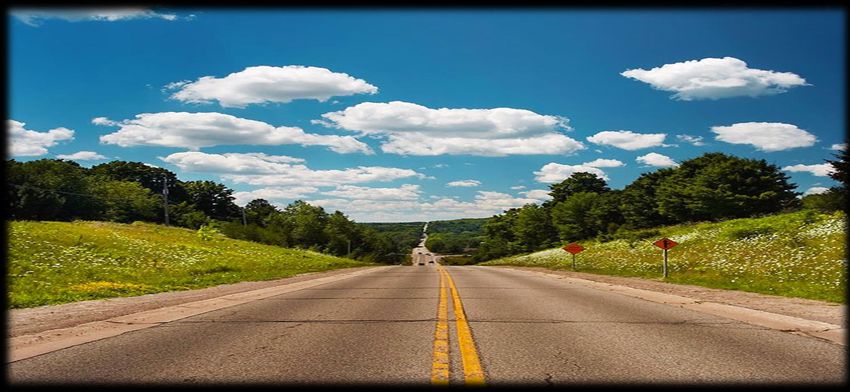
23« Dobbiamo andare e non fermarci finché non siamo arrivati»
«Dove andiamo?»
«Non lo so, ma dobbiamo andare »
(Jack Kerouac - On the road)
G
Grazie per l’attenzione
24
nuzzolo@ing.uniroma2.itPuoi anche leggere