Port Infographics - Assoporti
←
→
Trascrizione del contenuto della pagina
Se il tuo browser non visualizza correttamente la pagina, ti preghiamo di leggere il contenuto della pagina quaggiù
Port Infographics

                    1 2019
"Port Infographics" è un prodotto di ricerca online
pubblicato nell’ambito dell'Osservatorio Permanente di
SRM sull’Economia dei Trasporti Marittimi e della Logistica,
realizzato grazie al partenariato tra SRM e Assoporti.
È disponibile su:
www.srm-maritimeconomy.com
www.assoporti.it
Presidente Assoporti:
Daniele ROSSI
Direttore Generale SRM:
Massimo DEANDREIS
Coordinatore tecnico ed editoriale della Newsletter
Alessandro PANARO
(Responsabile Maritime & Energy, SRM)
Team dei ricercatori
Anna Arianna BUONFANTI
(Ricercatrice Senior Ufficio Maritime, SRM)
Olimpia FERRARA
(Responsabile dell’Ufficio Maritime, SRM)
Tiziana MURGIA
(Comunicazione, Assoporti)
Marina RIPOLI
(Comunicazione, SRM)
I dati della pubblicazione hanno vari livelli di aggiornamento.
La consultazione delle fonti è aggiornata a febbraio 2019.
Le analisi contenute nella ricerca non impegnano né
rappresentano in alcun modo il pensiero e l’opinione
dei Soci fondatori ed ordinari di SRM. Lo studio ha finalità
esclusivamente conoscitiva ed informativa, e non costituisce,
ad alcun effetto, un parere, un suggerimento di investimento,
un giudizio su aziende o persone citate.
Le illustrazioni e le infografiche presenti nello studio
sono da intendersi come immagini e non come mappe,
per cui l’equivalenza delle aree e dei confini potrebbe
non essere rispettata.
Sono consentiti l’uso e la riproduzione della
pubblicazione ai fini scientifici e di analisi,
solo citando espressamente la fonte:
SRM & Assoporti - Port Infographics
2Un nuovo mondo marittimo...
La nuova newsletter attraverso uso di
realizzata da Assoporti grafici di tipo “classico”.
e SRM inizia da questo
È questo un segnale di
numero con un nuovo
crescita del prodotto di
concept. È stata, infatti,
ricerca, sempre apprezzato
interamente realizzata
dagli operatori che da
attraverso l’uso di
questo numero vuole
infografiche.
affermarsi attraverso
L’obiettivo è quello un formato che è rivolto
di offrire al lettore sempre più a dare valore
visione immediata aggiunto alle informazioni.
del fenomeno
SRM e Assoporti
oggetto di analisi e
intendono, infatti, proporre
delle principali statistiche
uno stile sempre più fruibile
ad esso collegate.
e al servizio degli operatori
Si entra così in della portualità e della
un nuovo mondo logistica che così possono
marittimo composto da disporre di dati e statistiche
dati e informazioni aggiornate, ma anche
che vengono visualizzati di chiavi interpretative
in modo innovativo e dell’economia del mare
originale e non solo in che resta la protagonista
formato numerico e/o assoluta delle analisi.
31
2018
l'anno dei record
per i grandi porti
e per Suez p. 5
2
I grandi
fenomeni
marittimi p. 9
3
Il ritratto
marittimo
dell'Italia p. 13
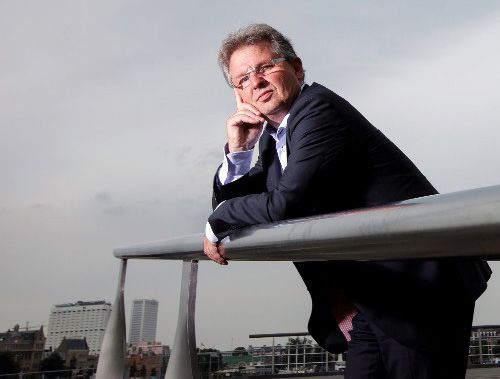
4
Intervista a
Henk de Bruijn,
Rotterdam
Port Authority p. 18
41
2018
l'anno dei record
per i grandi porti
e per Suez
348 milioni di teu
movimentati
dai Top20 del mondo:
+12% negli ultimi 5 anni
L'Asia
leader nel settore
del trasporto container
I 150 anni del Canale di Suez:
si conferma la grande via di transito
del trasporto marittimo
52018 l'anno dei record per i grandi porti e per Suez
1
I principali porti container mondiali
continuano a crescere
17° 13° 20° 9°
LOS ANGELES ANVERSA LAEM CHABANG TIANJIN
9.458.748 teu 11.020.000 teu 8.110.000 teu 16.020.000 teu
+1,2% +5,4% +4,2% +6,3%
11° 5° 16°
ROTTERDAM GUANGZHOU DALIAN
14.480.000 teu 21.890.000 teu 9.770.000 teu
+5,4% +7,5% +0,7%
19° 4° 8°
AMBURGO SHENZHEN QINGDAO
8.730.000 teu 25.740.000 teu 19.300.000 teu
-1,0% +2,1% +5,5%
6°
BUSAN
21.670.000 teu
+5,8%
1°
SHANGHAI
7°
HONG KONG 42.010.000 teu
19.640.000 teu +4,4%
-5,4%
I Top20 sono cresciuti 3°
2° NINGBO-
SINGAPORE ZHOUSHAN
del 3,9% tra il 2017 e il 2018
36.600.000 teu 26.520.000 teu
+8,7% +7,8%
18°
PORT OF TANJUNG 14°
PELEPAS XIAMEN
8.900.000 teu 10.600.000 teu
+6,2% +2,1%
12° 15°
PORT KLANG KAOHSIUNG
12.030.000 teu 10.450.000 teu
10° +0,4% +1,8%
JEBEL ALI
14.940.000 teu
-2,8%
Fonte: SRM su fonti varie
62018 l'anno dei record per i grandi porti e per Suez
1
Nuovi traguardi per i Top5
porti container del Mediterraneo
3°
ALGECIRAS
4.772.504 teu I Top5 sono cresciuti
+8,7% dell'11% tra il 2017 e il 2018.
4°
BARCELLONA L'Italia
3.472.879 teu
resta stabile
+17%
9° [ PRIMO PORTO ITALIANO ]
GENOVA
2.609.138 teu
-0,5%
1°
VALENCIA
5.182.665 teu
+7,3%
2°
PIREO
4.908.000 teu
5° +18,4%
TANGER MED
3.472.451 teu
+4,8%
Fonte: SRM su fonti varie
72018 l'anno dei record per i grandi porti e per Suez
1
Le recenti performance
del Canale di Suez...
Nel 2018 doppio record:
oltre 18 mila navi e 983 milioni
di merci transitate
Mar Mediterraneo
491
mln tonn
5.706
+4,2%
containership +2,5% 235,5
mln tonn
4.724 +7%
A seguito dell'allargamento
oil tanker +4,1%
la dimensione media delle navi è Golfo di
Suez
cresciuta del 12% tra il 2014 e il 2018
...e il ruolo dei porti Med
524,6 mln tonn TOT. SOUTHBOUND 458,8 mln tonn TOT. NORTHBOUND
BLACK SEA BLACK SEA
89,4 3,7
NORTH MED NORTH MED
62,5 97,6
EAST, S.E. MED
EAST, S.E. MED
110,6
WEST, S.W. MED 86,0 WEST, S.W. MED
48,0 41,3
Su entrambe le rotte
coprono il 55% del totale
Fonte: SRM su Suez Canal Authority
82
I grandi
fenomeni
marittimi
I porti Med:
ponte per la manifattura
cinese e per la distribuzione
dei grandi player
del Middle East
Con le Special Economic Zone
si rafforzano le strategie
degli investimenti esteri
9I grandi fenomeni marittimi
2
Continua la rincorsa al gigantismo
23.000 teu
23.000 teu
21.100 teu
21.100 teu
15.550 teu
15.550 teu
8.160 teu
8.160 teu
4.814 teu
4.814 teu
3.126 teu
3.126 teu
1970 1975 1977 1980 1985 1990 1995 1997 2000 2005 2006 2010 2017 2018
1970 1975 1977 1980 1985 1990 1995 1997 2000 2005 2006 2010 2017 2018
Flotta container
2012 87% 13% 133 nuove navi da 10-23.000 teu
2012 87% 13%
2015 77% 23% verranno lanciate nel 2022,
2015 77% 23%
45 delle quali nella fascia 18-23.000 teu
2022
2022 62%
62% 38%
38%
Fino
Fino ai ai 10.000
10.000 teuteu PiùPiù di 10.000
di 10.000 teuteu
Fonte: SRM su Alphaliner e OCSE
10I grandi fenomeni marittimi
2
Aumenta l'attrattività dei porti Med
AMBURGO
ROTTERDAM
LONDON GATEWAY ANVERSA AMBURGO
SOUTHAMPTON ZEEBRUGGE
LE HAVRE ROTTERDAM
LONDON GATEWAY ANVERSA
SOUTHAMPTON ZEEBRUGGE
LE HAVRE
VADO
LIGURE VENEZIA COSTANZA
GENOVA
BILBAO FOS-SUR-MED VADO
MARSIGLIA LIGURE VENEZIA COSTANZA
GENOVA
AMBARLI
BILBAO FOS-SUR-MED YARIMCA
TERRAGONA
VALENCIA MARSIGLIA
AMBARLI
SINES TERRAGONA PIREO YARIMCA
ALGERI
VALENCIA DJEN-DJEN MERSIN
MALTA PIREO
SINES ALGERI
DJEN-DJEN LIMASSOL
MERSIN
MALTA HAIFA
ASHDOD
LIMASSOL
PORT SAID
HAIFA
ASHDOD
PORT SAID
ABU DHABI
ABU DHABI
INVESTIMENTI: Cina Emirati Arabi Uniti Singapore
INVESTIMENTI: Cina Emirati Arabi Uniti Singapore
Fonte: SRM su fonti varie
11I grandi fenomeni marittimi
2
Alcune Free Zone portuali nel Mediterraneo...
ZAL PORT ISTANBUL
BARCELONA INDUSTRY &
FREE TRADE ZONE
6.000
4.741
>100
387
TANGER MED
ZONE
65.000
SUEZ CANAL
750 ECONOMIC ZONE
1.800
49
Addetti diretti Imprese Settore prevalente
Agricoltura Manifattura Logistica Auto
Innovazione
...e lo stato di avanzamento delle ZES in Italia
Campania Adriatica (Puglia/Molise)
Fase
iniziale
Sardegna Jonica (Puglia/Basilicata)
Iter di
approvazione
Calabria
Comitato
di indirizzo Palermo
completo
Catania, Augusta, Siracusa
Fonte: SRM su fonti varie
123
Il ritratto
marittimo
dell'Italia
I porti italiani 184 mln tonn
rinfuse liquide
gestiscono
69 mln tonn
quasi 500 milioni rinfuse solide
di tonnellate
106 mln tonn
di merci l'anno Ro-Ro
Il mare veicola
oltre un terzo
dell'export italiano
L'export via mare dell'Italia
nel 2018 ha superato
i 120 miliardi di euro (+4%)
13Il ritratto marittimo dell'Italia
3
Le performance delle
Autorità di Sistema Portuale italiane
MAR TIRRENO SETTENTRIONALE
MAR LIGURE ORIENTALE MARE ADRIATICO CENTRO-SETTENTRIONALE
44,1 mln tonn +7,3%
18,3 mln tonn +0,1% 0,7 mln teu +1,9% +0,6% 26,7 mln tonn
1,5 mln teu +0,2% -3,2% 0,2 mln teu
MAR LIGURE OCCIDENTALE MARE ADRIATICO ORIENTALE
69,2 mln tonn +1,6% +0,9% 67,2 mln tonn
2,7 mln teu +0,3% +17,7% 0,7 mln teu
MAR DI SARDEGNA MARE ADRIATICO SETTENTRIONALE
47,6 mln tonn -4,4% +0,7% 26,5 mln tonn
0,3 mln teu -37,8% +3,4% 0,6 mln teu
MAR TIRRENO CENTRO-SETTENTRIONALE MARE ADRIATICO CENTRALE
16,6 mln tonn -0,5% -2,7% 8,4 mln tonn
0,1 mln teu +14,8% -5,5% 0,2 mln teu
MAR TIRRENO CENTRALE * MARE ADRIATICO MERIDIONALE
36,6 mln tonn -2,3% -11,7% 15,0 mln tonn
1,0 mln teu +5,3% -2,2% 0,07 mln teu
MARE DI SICILIA OCCIDENTALE MAR JONIO
7,4 mln tonn +5,7% -5,6% 20,4 mln tonn
0,02 mln teu +19,9%
PORTO DI GIOIA TAURO ***
MARE DI SICILIA ORIENTALE **
-5,9% 31,0 mln tonn
34,3 mln tonn -5,1% -6,0% 2,3 mln teu
0,05 mln teu
PORTI DI MESSINA-MILAZZO
* Il dato delle rinfuse solide del porto di Napoli è stimato.
** Per il porto di Catania il dato 2018 non è disponoibile.
Pertanto è stato considerato il 2017. -6,3% 24,4 mln tonn
*** Stima merci per Gioia Tauro sulla base dei TEU movimentati.
Rinfuse liquide (mln tonn) Rinfuse solide (mln tonn) tot merci Var. 2018-2017
Container (mln tonn) Ro-Ro (mln tonn) Altre merci (mln tonn) tot teu Var. 2018-2017
Fonte: SRM su fonti varie
14Il ritratto marittimo dell'Italia
3
Le regioni italiane con maggiore
import-export marittimo
Lombardia Emilia Romagna Lombardia Veneto
56,4 mld € 27,7 mld € 32 mln tonn 19,2 mln tonn
Lombardia Emilia Romagna Lombardia Veneto
56,4 mld € 27,7Veneto
mld € 32 mln tonn 19,2 mln tonn
26,5 mld €
Veneto
26,5 mld €
Puglia
19,9 mln tonn
Puglia
Piemonte Emilia Romagna 19,9 mln tonn
20,5 mld €
Piemonte 19,2Romagna
Emilia mln tonn
20,5 mld € 19,2 mln tonn
Toscana
Toscana
17,8 mld €
17,8 mld €
Sardegna
Sardegna
28,4
28,4 mln tonn
mln tonn
Sicilia
Sicilia Sicilia
Sicilia
22,3 mld
22,3 mld €€ 45,7mln
45,7 mlntonn
tonn
Quanto vale il "mare" per
l'import-export delle regioni?
Sardegna Sicilia Liguria Calabria Campania
Piemonte Molise Valle d’Aosta Basilicata Trentino-A. Adige Abruzzo
97% 89% 74% 53% 52%
3.294 € 3.104 € 2.847 € 2.747 € 2.328 € 1.827 €
Fonte: SRM su Istat-Coeweb
15Il ritratto marittimo dell'Italia
3
Quali sono le merci più esportate
via mare dalle regioni italiane?
Valle
Valle d’Aosta
d’Aosta Lombardia
Lombardia Trentino
Trentino A.A.
A.A. Friuli
Friuli V.G.
V.G. Veneto
Veneto
0,82
0,82 0,15
0,15 8,12
8,12 3,59
3,59 0,45
0,45 0,32
0,32 1,26
1,26 0,46
0,46 4,28
4,28 1,01
1,01
mld
mld €
€ mld
mld € mld
mld €
€ mld
mld € mld
mld €
€ mld
mld € mld
mld €
€ mld
mld € mld
€ € € € mld €
€ mld
mld €
€
Piemonte
Piemonte Emilia
Emilia Rom.
Rom.
2,89
2,89 2,62
2,62 5,65
5,65 2,09
2,09
mld
mld €
€ mld
mld €
€ mld
mld €
€ mld
mld €
€
Liguria
Liguria Marche
Marche
0,71
0,71 0,65
0,65 0,88
0,88 0,21
0,21
mld
mld €
€ mld
mld €
€ mld
mld €
€ mld
mld €
€
Toscana
Toscana Abruzzo
Abruzzo
2,06
2,06 0,82
0,82 0,28
0,28 0,19
0,19
mld
mld €
€ mld
mld €
€ mld
mld €
€ mld
mld €
€
Sardegna
Sardegna Molise
Molise
3,45
3,45 0,17
0,17 0,11
0,11 0,03
0,03
mld
mld €
€ mld
mld €
€ mld
mld €
€ mld
mld €
€
Umbria
Umbria Puglia
Puglia
0,19
0,19 0,15
0,15 0,42
0,42 0,32
0,32
mld
mld €
€ mld
mld €
€ mld
mld €
€ mld
mld €
€
Lazio
Lazio Campania
Campania Sicilia
Sicilia Calabria
Calabria Basilicata
Basilicata
0,60
0,60 0,57
0,57 1,04
1,04 0,48
0,48 4,75
4,75 0,68
0,68 0,04
0,04 0,04
0,04 1,67
1,67 0,22
0,22
mld
mld €
€ mld
mld €
€ mld
mld €
€ mld
mld €
€ mld
mld €
€ mld
mld €
€ mld
mld €
€ mld
mld €
€ mld
mld €
€ mld
mld €
€
Apparecchi
Apparecchi Mezzi
Mezzi di
di Manufatti
Manufatti Carboni
Carboni fossili,
fossili, Coke,
Coke, petrolio
petrolio Prodotti
Prodotti Prodotti
Prodotti
meccanici
meccanici trasporto
trasporto in
in metallo
metallo petrolio
petrolio greggio
greggio raffinato
raffinato chimici
chimici alimentari
alimentari
Fonte: SRM su Istat-Coeweb (dati relativi al periodo gennaio/settembre 2018)
16Il ritratto marittimo dell'Italia
3
Le prime 10 destinazioni
dell'export italiano via mare
1’ Gli Stati Uniti
assorbono il 23%
STATI UNITI
del nostro export
27,72 mld €
2’ 3’ 4’
CINA TURCHIA TUNISIA
7,81 mld € 4,86 mld € 3,37 mld €
5’ 6’ 7’
MESSICO CANADA BRASILE
3,30 mld € 3 mld € 2,99 mld €
8’ 9’ 10’
AUSTRALIA ALGERIA GIAPPONE
2,97 mld € 2,93 mld € 2,88 mld €
Fonte: SRM su Istat-Coeweb
174
Intervista a
Henk de Bruijn,
Manager Social
& Labour Affairs,
Rotterdam
Port Authority
18Intervista a Henk de Bruijn
4
Do you believe that over the last years the role of the Port Authority
has improved ? Does this connect with general perception
of the port on behalf of the people living around the port?
The role of Port Authorities in the world Important tools are also FutureLand,
is influenced by local and international Maasvlakte2 and Education and
trends and developments, which makes Information Center at the Landtong.
it a challenge to compare. In FutureLand (www.futureland.nl) you
However in the annual report over can experience the developments in
2017 the PA (published in 2018) has an Rotterdam’s newest port area from close
extensive performance dashboard in place. quarters.
The sustainability report is completely Maasvlakte2 (www.portofrotterdam.com)
integrated in the annual report. doesn’t only show you the world’s most
The materiality index explains quite modern container terminals and largest
substantially how the interests of sea-going vessels, you can also view the
stakeholders meet with the value drivers latest offshore innovations. Curious about
of the port of Rotterdam. other Rotterdam port developments? Be
Also there is a comprehensive set of amazed
performance indicators which makes the by the role of digitisation or promising
environmental and social performance as forms of new energy. EIC Mainport
transparent as possible. Rotterdam (www.eic-mainport.nl) is an
Whether this connects with the perception initiative of the Port of Rotterdam and
of the people living around the port Deltalinqs (representing the port and
is difficult to say. What we can say is industrial companies in Rotterdam in
that the PA is taking a pro-active role important issues of common interest). The
when it comes to jobs, employment main objective is to inform young people
and employability, so this contributes about the port and industrial area of
directly to the quality of lives of our port Rotterdam. Yearly about 20.000 pupils and
citizens. The port is and remains the job students visit the port.
engine of the region, which was recently Another important tool is our
underscored by the report ‘The Rotterdam ‘Havenkrant’. The Havenkrant – the main
Effect’, a research conducted by the newspaper of the Port of Rotterdam –
Erasmus University. brings the port ‘closer’ to local residents.
19Intervista a Henk de Bruijn
4
The Havenkrant is a twelve-page tabloid which is signed by the Municipality,
newspaper which the Port of Rotterdam the Port Authority, vocational education
Authorities has been delivering free of institutes and the industry, represented
charge to all the residents living in the by Deltalinqs.
vicinity of the Port of Rotterdam since In this time of transitional change, there
2009. The circulation is 530,000 and is quite an anxiety among the people
it appears four times a year. It is also whether there will be sufficient jobs
available free in central places in the city. because of the digitization, robotization
The newspaper’s aim is to bring the port, and energy transition. This program
which has literally moved increasingly covers actions relating to three labour
further away, closer to local residents. market challenges: from school to work,
The articles are low threshold and present from work to work and return to work.
the port in all its aspects. From work to Companies are going to invest in 1000 so-
recreation, from security to accessibility. called career-start guarantees, and millions
To make it more hands-on: this week we of euros are invested in job mobility (from
have signed a Learning & Jobs agreement work to work) and education programmes.
Do you think that the Port Authority is doing its best
to inform people about and integrate the role of the port for the city?
The PA is using all means of The CEO is also part of the CSR core team,
communication to not only inform, but who are looking after the CSR awareness
also engage people about the role of within the organization.
the port for the city. Obviously there What the general public notices from
are the formal communication channels the pro-active role towards the general
with the municipality and stakeholders public is obviously at big events such as
in the society, but ordinary people will the World Port Days, visited by approx.
not see how intensive these contacts 350,000 per year. Besides this the PA
are. The formal integration of this role sponsors many other festivals. Additionally
is made explicit in the CSR statement. the PA is an active contributor to
Within the department of Environmental education programmes, both in terms of
Management, there is a programme guest lectures, company visits and even as
manager for CSR activities. co-developers of new programmes.
20Intervista a Henk de Bruijn
4
In addition to that there are open with regards to the port vision. This also
communication channels, newsletters, includes many consultative sessions with
Instagram and twitter accounts. and in stakeholder communities.
For the longer term, the port and city The results of our yearly
are actively and collaboratively going ‘Port reputation survey’ are:
through continuous development cycles
Port reputation survey
DUTCH PUBLIC
FAMILIAR PROUD REPUTATION LICENCE TO GROW
with port of Rotterdam of port of Rotterdam of port of Rotterdam of port of Rotterdam
61% 93% 85,7 80,1
of the public of the public
LOCAL RESIDENTS
FAMILIAR PROUD REPUTATION LICENCE TO GROW
with port of Rotterdam of port of Rotterdam of port of Rotterdam of port of Rotterdam
98% 93% 87,4 79,9
of the local residents of the local residents
Would you consider the Rotterdam model as the best for
societal integration? And for business? Is there a limit between
the business role and that of a public authority?
We believe it is not possible to say More and more we are under the
that there is a best for everything. impression that ‘doing the things right’
Whether the Rotterdam model exists is not what matters most.
seems to be the perception of other port What matters is that we have to believe in
authorities or scientists. Our port model is ‘doing the right things right’.
is built upon the landlord model. If you’re really committed to contributing
This means we want to be the best for our to sustainable goals and societal
clients, users and stakeholders, and to lead integration, we have to go beyond
by example. economic growth and let this go
21Intervista a Henk de Bruijn
4
hand in hand with improving respect for people and environmental
the living environment. issues. By doing so, we are reconciling
This means we attract and do business the business role and that of the public
in a socially responsible way with authority.
Do you believe that all PAs would benefit fro this type of model
or do you think that there is a difference
according to location and market?
The landlord model is being applied Considering the performance over the
in other ports around the world. last 15 years, this is actually the best
The scientific discourse tells us that comparison where the ‘Rotterdam
port management models vary a lot, model’ as you are calling is actively
depending on the institutional governance, implemented. We are learning a lot from
the coordination mechanisms at the way we have understood our own port
play to work out conflicts of interests. model, but now in a different location,
We are learning a lot ourselves in the ports different market and different stage of
where we are actively involved, such as in development. So yes, we believe there is a
Sohar. significant difference.
22Puoi anche leggere