Assemblea Cosmetica Italia
←
→
Trascrizione del contenuto della pagina
Se il tuo browser non visualizza correttamente la pagina, ti preghiamo di leggere il contenuto della pagina quaggiù

Assemblea Cosmetica Italia

  FRANCESCO CAVONE
  Director, Offering
  Suppliers & Consumer Health, Italy

© 2019. All rights reserved. IQVIA® is a registered trademark of IQVIA Inc. in the United States, the European Union, and various other countries.

AGENDA

+ IQVIA CONSUMER HEALTH

+ SCENARIO DEL MERCATO IN FARMACIA

+ PRINCIPALI FATTORI DI CAMBIAMENTO

+ I NUMERI DELL’E-COMMERCE

3

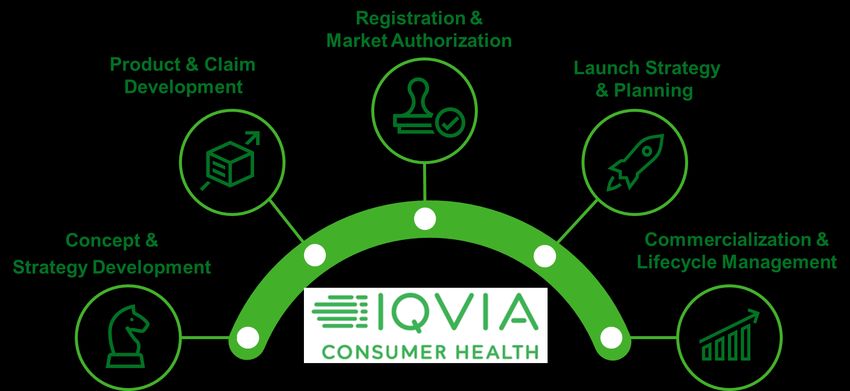
Driving consumer healthcare from Concept to Consumer
Global end-to-end capabilities

Copyright © 2019 IQVIA. All rights reserved.           4
Il mercato
italiano in
farmacia
Il mercato perde 1% a valore, ma con comportamenti opposti tra i
 comparti «etico» e «consumer», anche se nell’ultimo MAT si
 registra un rallentamento
    Totale mercato                                                       4%
                                                                                                                                 MAGGIORE COMPETITIVITÀ

                                                        Variazione%
    €   24,3 Mld

                                                           3 anni
                                                                                                                                  +   Nuove aperture
                      ▼ -1,0% a valore                                   3%
                                                                                                                                  +   Nuovi canali (online)
                      ▼ -2,1% a unità

                                                                                    CONSUMER*                                     +   Sviluppo catene
                                                                         2%
                                                                                                                                  +   Crescita del commerciale
                                                                                                 €   10,0 mld
                                                                         1%                                                      ESIGENZE DEL CONSUMATORE
                                                                                             ultimo anno ▲ +0,3%
                                                                                            ultimi 3 anni ▲ +1,1%                 + Più informato ed esigente
                                                                         0%
     -3%                                -2%       -1%                          0%     1%                  2%                3%    + Decisione più «fluida»
                                                                                                                 Variazione%      + Benessere e non solo cura
                                                                                                                      1 anno
                                                                         -1%

                            ETICO
                                                                                                                                 DINAMICHE DI MERCATO
                                                  €     14,3          mld
                                                                        -2%
                                                                                                                                  + Riduzione valore «generici»
                                               ultimo anno ▼-1,8%                                                                 + Switch su canale non-retail
                                               ultimi 3 anni ▼-2,6%
                                                                  -3%
                                                                                                                                  + Concentrazione dei
                                                                                                                                    distributori
                                                                         -4%

   Fonte: IQVIA Multichannel MAT 10/19 (eur/pub) in farmacia
Copyright © 2019 IQVIA. All rights reserved.
                                                                                           * Consumer = commerciale + autocura
                                                                                                                                                                  6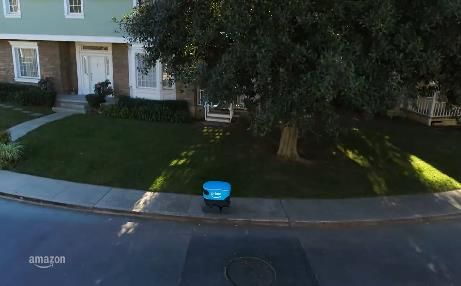
Il comparto OTC ed in particolare gli integratori guidano la
 crescita del commerciale, mentre parafarmaco e nutrizionale
 sono sempre meno presenti
           Totale mercato                                                                            5%

                                                                                       Variazione%
           €   10,0 Mld

                                                                                          3 anni
                                                                                                     4%

                         ▲ +0,3% a valore
                         ▼ -1,8% a unità
                                                                                                     3%

                                                              OTC Automed;                                                        OTC INTEGRATORI;
                                                                              -0,1%;                 2%
                                                                                                                  PEC;                                3,1%;
                                                                               1,1%;                               0,7%;                              3,7%;
                                                                            2.259 k€                 1%            0,7%;                           3.805 k€
                                                                                                                1.973 k€
                                                                                                     0%
            -6%                                -4%                    -2%                                  0%        2%             4%                     6%
               PARAFARMACO;                                                                                                                  Variazione%
                                           -4,4%;                                                    -1%
                                                                                                                                                  1 anno
                                           -3,0%;
                                         1.618 k€    NUT;                                            -2%
                                                     -4,2%;
                                                     -2,7%;
                                                     387 k€                                          -3%

                                                                                                     -4%

                                                                                                     -5%
                                                                                                                           * PEC = Personal Care
          Fonte: IQVIA Multichannel MAT 10/19 (eur/pub) in farmacia

Copyright © 2019 IQVIA. All rights reserved.                                                                                                                    7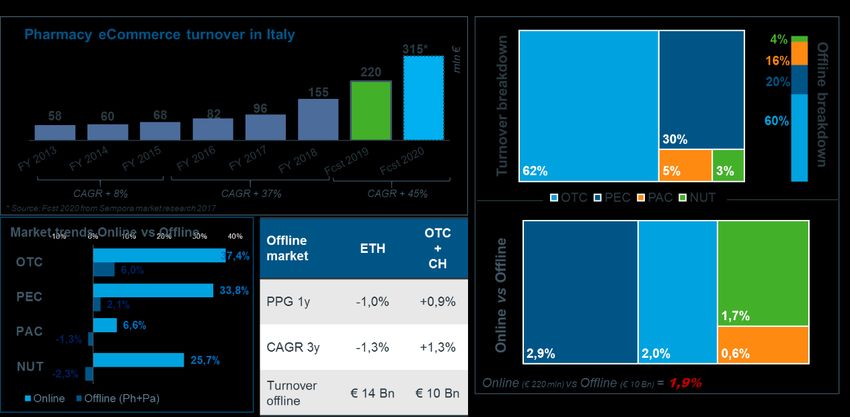
Focus comparto PEC (Personal Care): crescono solo i prodotti
bellezza in farmacia e corner
                             Peso e trend 1 anno nei 3 canali                                                Peso sul comparto          NEC2 coverage 80%

                           -1%                        -5%                 2%                0%
      PGP

                           -4%                        -7%              -1%                  -1%   0%

                                                                                                             BELLEZZA             52%
                          -5%                         -6%                 3%                -4%

                                                11%                 6%              12%
                                                                                                  -10%

                 25%                                                11%
                                                11%                                  9%                     IGIENE
                                                                    83%                           -20%

                                                                                                          PERSONALE              30%
                                                79%                                 79%
                 7%
                 68%
      Peso

                                                                                                  -30%

                                                                                                          ACCESSORI         13%
                                                                                                  -40%

                                                                                                  -50%

                                                                                                                  BAMBINI   5%
          ACCESSORI                            BAMBINI        BELLEZZA            IGIENE
                                                                                                  -60%

                                                                                PERSONALE
                                   Farmacia                 Paraf         Corner
Copyright © 2019 IQVIA. All rights reserved.                                                                                                                8
                                                      Fonte: IQVIA Multichannel MAT 10/19 (eur/pub) in farmacia
La crescita del comparto PEC in Europa ha rallentato negli ultimi
due anni, registrando comunque un trend stabile e positivo

                                               Europe PEC Market Size and Yearly Growth
                                                   4%
                                                                           3%
                                                                                                  0%       1%

                                               6.953                   7.153               7.161       7.215
                          6.672

                           2015                2016                    2017                    2018    2019

                                                        Market Size (LEU mn)    Y-o-Y Growth

Copyright © 2019 IQVIA. All rights reserved.                                                                    10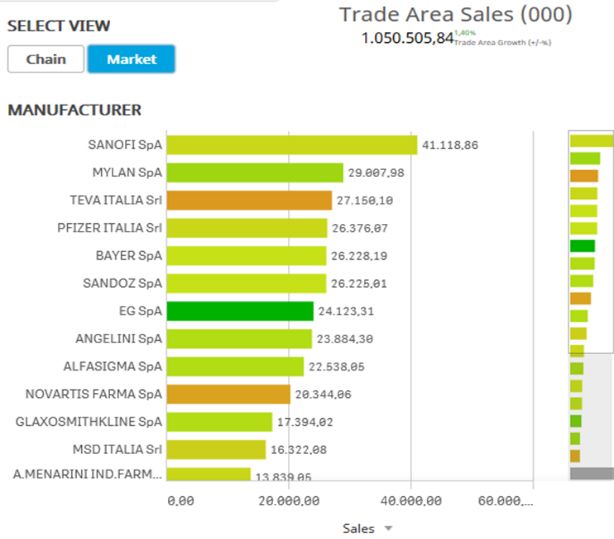
I Paesi CEE (Repubblica Ceca, Ungheria e Croazia) crescono più
 rapidamente, mentre Paesi come l’Italia e la Svizzera mostrano un
 calo sia nel breve che nel medio termine
                                                                EUROPE PEC Growth by Country: Long vs Short Term

                                   EUROPE Latest Year growth            10

                                                     +0,8%
                                                                               Greece                                                                        Hungary
                                                                         8

                                                                                                         Portugal
                                                                                                                    Czech Republic
                                                                         6

                                                                             Poland     Slovakia
                                                                                                                                     Croatia
                                                                         4

                                                              Belgium

                                                                                      Spain
          Switzerland
                                                                         2

                                                    Austria
                                                                         0

          -3                                   -1                1                       3                   5       7               9                  11              13

                                                                                                                                         EUROPE 3 Year Average growth
                                                    Italy               -2                         Germany                                                    +1,2%
                                                              France

                                                                        -4

                                                                        -6

Copyright © 2019 IQVIA. All rights reserved.                                                                                                                                 11
Il numero di abitanti per farmacia si è ridotto del 7% in 3 anni, il
fenomeno delle nuove aperture è in controtendenza rispetto
all’Europa
In Europa fenomeno inverso all’Italia
Popolazione (.000 abitanti)
65.850 60.340 60.626 59.394 59.685 60.783 60.796 60.666 60.589 60.484 60.360
Thousands
55.850
45.850
35.850
25.850
15.850
5.850
2010 2011 2012 2013 2014 2015 2016 2017 2018 2019
22000 3.700
Abitanti per f.cia # Farmacie
21500
3.452
3.401 3.500
21000
20500
3.300
20000
3.163
19500 3.100
19000
19.082
2.900
18500
18000
17.481
17.874
2.700
17500
17000 2.500
2010 2011 2012 2013 2014 2015 2016 2017 2018 2019
Copyright © 2019 IQVIA. All rights reserved. Fonte: IQVIA Analysis Ago19 12In Italia la distribuzione risente del calo del mercato con elevata
polverizzazione di quote, mentre il Europa c’è maggiore
concentrazione
Top3 grossisti in Europa I distributori in Italia nell’ultimo decennio
Var 3 anni
16%
14%
2008
Top5;
12% Spain; 59,8% 45%
10%
8%
Germany; Top10;
Belgium; 6% 63,5% 57%
Austria; 83,9%
71,9%
4%
2%
Top5;
0%
-2% -1% 0% 1% 2% 3% 4% 56%
2019
-2% Var 1 anno
Italy; 40,2%
-4%
Mercato retail 2018 Germania Spagna Austria Belgio Italia
Top10;
Variazione ultimo anno 4,2% 1,1% 4,4% -0,9% -1,0% 80%
Variazione 3 anni 3,7% 2,0% 5,3% -0,7% -1,1%
Copyright © 2019 IQVIA. All rights reserved. 13Modelli e principali catene presenti in Italia
INTERNATIONAL GROUPS NATIONAL WHOLESALERS
INVESTMENT FUNDS NETWORK OF SPECIALIZED BRAND
VIRTUAL CHAIN REAL CHAIN
Copyright © 2019 IQVIA. All rights reserved. Source: IQVIA analysis and #PoS estimation 14…analizzando i dati, Nulla (o quasi) è cambiato dall’entrata in
vigore del DDL concorrenza…
0
0
9 /20
16 8/2017 0
9/2019
Copyright © 2019 IQVIA. All rights reserved. 15…il peso delle catene sul totale mercato a valore è del 14% in
ponderata e 13% in numerica
Reali
Virtuali forti
Virtuali light
Focus Chains
Indipendenti
Focus Virtual Chains
Focus Independents
69%
Indip
85%
18%
11% Chain
14%
2%
Copyright © 2019 IQVIA. All rights reserved. 16Cambia la visione se osserviamo il fenomeno con la lente puntata su aree geografiche con presenza di catene organizzate Copyright © 2019 IQVIA. All rights reserved. 17
I numeri
dell’eCommerce
Il caso Amazon
Gen/18 Cosa può fare Alexa I clienti (pazienti) hanno poco tempo, non possono perdere
oggi…
un assistente medico tempo a cercare prodotti (medicinali) e fare la fila.
personale? I prodotti stessi devono raggiungere il cliente (paziente) e
Feb/18
devono essere il più comodi possibile!
Giu/18
Amazon ha brevettato un
sistema di consegna
Lug/18 basato su droni
Set/18 Amazon è in fase di test
con 6 Robot Scout nella
Ott/19 periferia di Washington
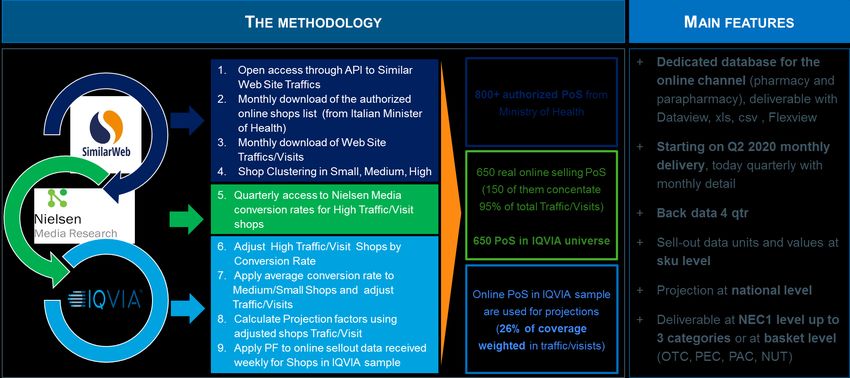
Copyright © 2019 IQVIA. All rights reserved. 19Alto potenziale per il canale eCommerce, ma lo scenario è ancora
molto frammentato
1. PRODUCT CATEGORIES 2. DELIVERING TYPE 3. TYPE OF SITES
•
Which product categories could be sell
Which type of delivery? Which websites?
online?
+ RX: Italian legislation doesn’t allow + Click & Collect: no + Portals: out of scope
+ OTC: Self-Medication products need ministerial + Pick & Pay: no + Pharmacy/para website: in scope
authorization + Delivery at home: yes
+ Consumer: everyone can sell at any price
General Specialized PoS Pure online Omni Market concentration
portals portals website channel
No. of Players with
90% Value Share 800+
Portals Pharmacies & Parapharmacies
Portals Brand or product PoS with their No brick and Chain web
category portals own website mortar portals
150
IQVIA scope
Copyright © 2019 IQVIA. All rights reserved. 20Una metodologia innovative per gestire l’espansione del canale a livello nazionale Copyright © 2019 IQVIA. All rights reserved. 21
Crescita a doppia cifra e forte concentrazione in categorie e line
          di prodotto

Copyright © 2019 IQVIA.
          Copyright     All IQVIA.
                    © 2019  rights reserved.
                                    All rights reserved.                       22
Le 5 principali categorie coprono oltre il 60% del canale
Il canale online per comparti Top5 NEC1 e principali prodotti
11%
89%
Auto-
Integratori 62% 66%
OTC Med
04-Vitamine, 10-App
03-App intestinale 12-Urologia 02-Analgesici
minerali circolatorio
30% 91%
PEC
82-Bellezza 83-Bellezza 85-Igiene
86-Capelli 93-Cavo orale
femmin. unisex personale
5% 64%
PAC
56-Strum 58- 57-Acces.
52-Incontinenza 54-Infanzia
medic/chir Ortop./Reumatici Medico/Chirurg.
3% 94%
NUT
30-Nutrizione 36-Alimenti per 35-Dietetici
34-Dimagranti 32-Senza glutine
enterale adulti infanzia
Copyright © 2019 IQVIA. All rights reserved. 23Comportamento dei Top10 produttori nel comparto PEC
valore canale online MAT 09/19 66,4 mln€
Online Top10 Manufacturer Online Top products ppg 6mth Online new products
140%
TRUDY BB CARE M/L -51%
%PPG 6mth
Top8 ANTHELIOS XL
ORAL B DENT.FLOSS -53%
120%
DERMON DOCCIA SCH. 7%
100%
Top3 SAUGELLA… 9%
DEFENCE SUN
ELMEX DENT. 0%
80% Top5
MUSTELA BEBE 11%
60% EUCERIN PH5 6%
RILASTIL S S
ALOEVERA 2 32%
Top10
40%
Top6
KEOPS DEODORANTE 60%
Top4 Top1 EUPHIDRA AMIDO MIO 28%
20%
Top9 SOMATOLINE
MINERAL 89 36% COSMET
0% CERAVE 32%
0% 1% 2% 3% 4% 5% 6% 7% 8%
NUXE HUILE PRODIGI 97%
-20% BIOCOLLAGENIX
Top7 Top2 ANNURMETS HAIR 30%
BIOSCALIN PHYSIOG. -8%
-40% %Market Share
Copyright © 2019 IQVIA.
Copyright All IQVIA.
© 2019 All rights reserved.Fonte:
rights reserved. IQVIA DW eCommerce 24Da un servizio di “audit” ad un servizio integrato di “analisi
combinata” del canale online
OGGI SVILUPPI FUTURI
+800 150 +32.000
Top PoS in the
Authorized PoS references
online market
eCommerce
Promo
ad hoc project
144 mln 26% 38 mln analysis and
channel
as PMR Projects
IQVIA sample annual traffic in «nominative e-
annual traffic integration
(views) IQVIA sample data»
Integration
offline and
13 mln 41% 5,3 mln online Consulting &
IQVIA sample annual purchases channels Services
annual purchases (Multichannel, Projects
(conversion rate) in IQVIA sample
Pharmatrend,
Weekly Trend)
220 mln€ 17 mln +34%
estimated units sold
turnover in 2019 online %PPG 1y (Giu19)
Copyright © 2019 IQVIA.
Copyright All IQVIA.
© 2019 rights reserved.
All rights reserved. 25iqviaconsumerhealth.com
linkedin.com/showcase/iqvia-consumer-health/
www.IQVIA.com
IQVIA Italia
IQVIA_ITALIA
©2018 IQVIA All rights reserved. This document and the information herein contained are CONFIDENTIAL and PROPRIETARY and
cannot be disclosed to third parties without IQVIA’s written permission. No part of this document and the information herein contained
may be reproduced, stored in back-up systems or transmitted in any form or by any mean without IQVIA’s prior written consent. 26Puoi anche leggere