Un aggiornamento sulle strategie in focus - Dicembre 2020
←
→
Trascrizione del contenuto della pagina
Se il tuo browser non visualizza correttamente la pagina, ti preghiamo di leggere il contenuto della pagina quaggiù

Un aggiornamento sulle strategie in focus

                                                Dicembre 2020

FOR PROFESSIONAL/QUALIFIED INVESTORS ONLY.                          © All rights reserved. Lombard Odier Investment Managers.
Le nostre principali soluzioni d’investimento

       Multi Asset                                                            Equity Sostenibile
                                                    Novità!

   Crescita del capitale con              Digitalizzazione dei servizi           Catturare il potenziale di      Dal 2020 più persone con più di
   protezione dai drawdown                          finanziari                rendimento dei brand sostenibili   65 anni che bambini inferiori ai
                                                                                                                                5
     LO Funds – All Roads               LO Funds – Global FinTech               LO Funds – World Brands            LO Funds – Golden Age

 All Roads PA EUR - LU0718509606       Global Fintech PA USD- LU2107599644         World Brands EUR PA -          Golden Age USD PA - LU0431649028
                                      Global FinTech PA EUR H- LU2107604402            LU1809976522              Golden Age EURH PA - LU0161986921

1 FOR PROFESSIONAL/QUALIFIED INVESTORS ONLY.
LO Funds–All Roads
Obiettivo di preservazione del capitale con rendimenti stabili

LOF All Roads: overview
Un approccio Multi-Asset risk-based come parte liquid core di un portafoglio
STABILITA’ PROTEZIONE DEL CAPITALE LIQUIDITA’
OBIETTIVO
Fornire stable returns attraverso diversi cicli con un investimento liquido1
Protezione del capitale: l'assunzione di rischio significa che gli investimenti possono guadagnare o perdere, cerchiamo di limitare attentamente le
cadute2
IN PRATICA
Ottimizzare la diversificazione con bilanciamento del rischio:
– Allocazione strutturale agnostica al ciclo economico
– Modellazione dinamica del rischio
– Sfruttare le inefficienze di mercato (premi di rischio alternativi)
Protezione dei downside
– Gestione dei drawdown
ESPERIENZE
Gestione attiva da parte di un team esperto con 8 anni di track record; AUM €1’533million3
Un quarto del patrimonio del fondo pensione dei dipendenti di Lombard Odier è gestito con la strategia All Roads4
1 Target performance/risk represents a portfolio construction goal. It does not represent past performance/risk and may not be representative of actual future performance/risk.
2 Capitalpreservation represents a portfolio construction goal. It cannot be guaranteed.
3 Includes all three funds as well as segregated mandates managed by the team under the All Roads strategy; as at 28 February 2020.
4 Note that the CIO of the All Roads Strategy is also the CIO of the Lombard Odier employee pension plan. All investment decisions are part of a robust
committee oversight and review. The LO Pension Fund is a representative account which is being shown for illustrative purposes only and is not available for direct investment.
Source: Morningstar, 31 March 2020. EUR NA share class, Flexible Allocation category. Ratings and awards subject to change without notice.
3 FOR PROFESSIONAL/QUALIFIED INVESTORS ONLY.
Applicazione di principi di investimento chiave per garantire preservazione di
capitale e rendimenti stabili

  MASSIMIZZARE LA DIVERSIFICAZIONE1                                                                                                                                  ALLOCAZIONE DI RISCHIO, NON DI CAPITALE
  espandere l'universo di asset classe tradizionali con                                                                                                              Per migliorare la diversificazione tra i cicli macro ed
  premi per il rischio alternativi trasparenti e liquidi.                                             Massima       Allocazione di                                   evitare una concentrazione eccessiva
     ESPOSIZIONE AL RISCHIO DIVERSIFICATA                                                          diversificazione rischio, non di                                    RISULTATO DI UN’ALLOCAZIONE DINAMICA DEL CAPITALE2
                                      Commodities                                                                       capitale                                    100%
                                                                                                                                                                                                                   Sov Bonds
           14% 7%                     Emerging Equities
                      14%                                                                                                                                            75%                                           Credit
                                      Developed Equities                                                                                                                                                           Dev Eqty
                                                                                                           Gestione attiva dei
       17%                            Emerging Credit                                                                                                                50%
                                                                                                           rischi di drawdown                                                                                      EM Eqty
                                                Credit                                                                                                               25%                                           Commodities
                            27%
            18%                                 Sovereign Bonds                                                                                                                                                    Alpha
                    3%                          Alternative Risk Premia
                                                                                                                                                                       0%
                                                                                                                                                                         Feb-12         Aug-13   Jan-15   Jul-16

                             CONTROLLO DINAMICO DEI DRAWDOWN                                                                                            SOLIDA PROTEZIONE AI RIBASSI3
                                                                                                    0%
                             Focus sul drawdown quale misura di rischio e
                             gestione sistematica e dinamica del downside
                             risk per preservare il capitale e limitare le                         -10%                                  All Roads
                             perdite. Obiettivo di Max. Drawdown del 10%.                                                                portfolio
                                                                                                                                         Traditional
                                                                                                                                         60/40
                                                                                                   -20%

                           La combinazione di questi principi di investimento permette di preservare il capitale
                                       ed ottenere rendimenti stabili attraverso i cicli economici
Fone Lombard Odier, Bloomberg.
1 Al 30 novembre 2016. Allocazione del rischio/composizione del portafoglio è soggetta a cambiamento. Solo a scopoo illustrativo.
2 L’allocazione di capitale inizialmente ha incluso un’allocazione a strategie absolute return (media del 10%) che è stata interrotta nel dicembre 2012. Per semplicità non viene raffigurata.
3 Allocazione tradizionale bilanciata 60/40 = 60% Barclays Global Aggregate Bond (EUR Hedged) + 40% MSCI World Net TR (Eur Hedged).

La preservazione del capitale rappresenta un obiettivo della costruzione del portafoglio. Non può essere garantita.

4 FOR PROFESSIONAL/QUALIFIED INVESTORS ONLY.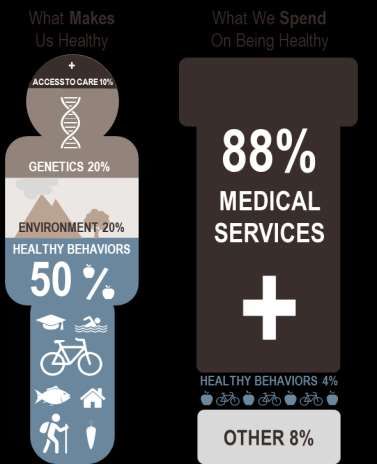
LOF-All Roads: allocazione del portafoglio
                                                                                                                                                                                  (31 Ottobre 2020)

PORTFOLIO COMPOSITION (RISK ALLOCATION)                                                                                        PORTFOLIO COMPOSITION (CAPITAL ALLOCATION)

                                 8%                                                                                                      12%                         Sovereign Bonds
               18%                      3%                                     Sovereign Bonds
                                                                                                                                    6%                               Inflation-Linked Bonds
                                                                               Inflation Linked Bonds
                                               16%                                                                              4%                                   HY Credit
                                                                               HY Credit
                                                                                                                               6%                                    EM Debt
                                                                               EM Debt
      19%                                                                                                                                          55%               DM Equities
                                                 3%                            DM Equity                                       4%
                                                                                                                                                                     EM Equities
                                                                               EM Equity                                            8%
                                                                                                                                                                     Commodities
                                                                               Commodities                                               6%
                                33%                                                                                                                                  Volatility

                                                                                                        Portfolio allocation
                                                                                                        rebased to 100%

                                                          Portafoglio diversificato investito in strumenti liquidi long-only

Fonte: LOIM. Composizione asset allocation / portafoglio è soggetto a modifiche. Solo a scopo illustrativo.

5 FOR PROFESSIONAL/QUALIFIED INVESTORS ONLY.
LOF-All Roads: allocazione storica del fondo
(30 novembre 2020)
COMPOSIZIONE STORICA DI PORTAFOGLIO (ALLOCAZIONE DEL CAPITALE)
Sovereign Bonds Inflation-linked Bonds Credit Developed Market Equities
Emerging Market Equities Commodities Volatility Total Exposure (RHS)
100% 300%
90%
250%
80%
70%
200%
60%
50% 150%
40%
100%
30%
20%
50%
10%
0% 0%
Jan-12 Jan-13 Jan-14 Dec-14 Dec-15 Dec-16 Nov-17 Nov-18 Nov-19 Oct-20
Fonte: LOIM. Composizione asset allocation / portafoglio è soggetto a modifiche. Solo a scopo illustrativo.
6 FOR PROFESSIONAL/QUALIFIED INVESTORS ONLY.LOF-All Roads: portafoglio costruito in futures
(30 novembre 2020)
COMMODITIES VOLATILITY
COMMODITIES RISK PREMIA LONG ONLY 7.2% EQUITY IMPLIED VOLATILITY 1.1%
COMMODITIES CARRY LONG/SHORT 3.9% EQUITY INTRADAY TREND 3.2%
TOTAL 11.2% DIVERSIFIED LONG VOLATILITY USD 5.6%
DIVERSIFIED LONG VOLATILITY EUR 6.2%
TOTAL 16.0%
FX CREDIT
USD 0.4% NORTH AMERICA HIGH YIELD 5Y US 9.7%
JPY 0.1% ITRAXX XO 5YR TOT RET IX 10.8%
GBP 0.1% CDX EMERGING MARKETS INDEX 7.8%
CAD 0.0% TOTAL 28.3%
AUD 0.1%
CHF 0.0% SOVEREIGN BONDS NOMINAL LINKERS
KRW 0.2% US 10YR 5.0% 2.0%
NON-EUR TOTAL 0.9% US LONG 3.1%
US ULTRA 2.5%
US 10YR ULTRA 2.0%
EMERGING MARKETS EQUITIES
CAN 10YR 7.2% 0.7%
MSCI EMERGING MKT FUTURES 2.2% SP 500 INDEX FUTURES 1.4% AMSTERDAM INDEX FUTURES 0.4%
EURO-BUND 10YR 7.4% 1.1%
BRAZIL IBOVESPA INDEX FUTURES 0.0% DJIA INDEX MINI FUTURES 2.6% FTSE/MIB INDEX FUTURES 0.4%
EURO-BUXL 30Y 3.2%
MEXICO IPC INDEX FUTURES 0.0% NASDAQ 100 INDEX FUTURES 2.7% FTSE 100 INDEX FUTURES 0.7%
EURO-OAT 10YR 13.3% 0.6%
NIFTY 50 FUTURES 0.0% RUSSELL 2000 INDEX FUTURES 0.8% SWISS MARKET INDEX FUTURES 0.7% EURO-BTP 10YR 7.2% 0.6%
KOSPI 200 INDEX FUTURES 2.1% S&P/TSX 60 INDEX FUTURES 0.2% NIKKEI 225 FUTURES 1.1% UK 10YR 9.1% 0.9%
HANG SENG INDEX FUTURES 2.1% EURO STOXX 50 PR FUTURES 1.6% TOPIX INDEX FUTURES 0.8% JGB 10YR 14.4% 1.2%
TAIWAN TAIEX INDEX FUTURES 0.5% DAX INDEX 1.0% S&P/ASX 200 INDEX FUTURES 0.5% AUST 10YR 9.4% 0.6%
FTSE CHINA A50 FUTURES 1.2% CAC40 INDEX FUTURES 0.8% KOREA 10YR 2.4%
TOTAL 8.0% TOTAL 15.7% TOTAL 94.0% 86.2% 7.8%
Fonte: LOIM. Composizione asset allocation / portafoglio è soggetto a modifiche. Solo a scopo illustrativo.
7 FOR PROFESSIONAL/QUALIFIED INVESTORS ONLY.LOF-All Roads: performance PA EUR
Performance storica1, 2 (30 novembre 2020)
35%
All Roads
Class EUR PA
28%
ITD 3Y 1Y
21% Annual return 3.23% 1.78% 1.93%
14% Volatility 4.89% 5.16% 4.56%
7% Sharpe ratio 0.71 0.45 0.54
Max drawdown -6.7% -6.6% -3.7%
0%
Jan-12 Nov-13 Aug-15 May-17 Feb-19
JAN FEB MAR APR MAY JUN JUL AUG SEP OCT NOV DEC FUND Portfolio composition (capital allocation)
2012 1.95% -1.28% 0.44% -0.51% 0.14% 3.57% 0.06% 1.05% -1.79% 1.65% 0.87% 5.30%
2013 -0.05% 1.53% 2.24% 1.36% -3.11% -3.38% 0.31% -0.66% 0.75% 1.15% -0.36% -0.43% -0.83% Sovereign Bonds
2014 0.19% 1.62% 0.67% 1.02% 2.48% 1.82% -0.72% 2.49% -1.85% 0.30% 0.58% -1.24% 7.52% 9% Inflation-Linked Bonds
6%
2015 1.89% 1.52% 0.29% 0.06% -0.62% -2.09% -0.17% -1.48% -0.63% 1.34% -0.18% -1.54% -1.69%
HY Credit
5%
2016 -0.67% 0.43% 1.43% -0.42% 0.60% 1.95% 1.84% 0.03% -0.13% -1.73% -0.86% 1.17% 3.62% EM Debt
9% 50%
2017 0.21% 1.89% 0.40% 1.00% 1.05% -1.23% 0.96% 1.64% -0.54% 3.82% -0.06% 0.73% 10.22% DM Equities
2018 0.57% -3.74% 0.29% -0.02% 0.30% -0.52% 0.04% 0.13% -0.20% -2.48% -0.17% -0.36% -6.09% 5%
EM Equities
2019 2.04% 0.72% 3.01% 0.91% -2.45% 3.76% 1.36% 0.61% -0.26% -0.75% 0.18% 1.11% 10.57% 12% Commodities
4%
2020 -0.53% -1.34% -1.85% 0.57% 0.54% 0.70% 1.21% 0.60% -0.88% -0.96% 2.84% 0.81% Volatility
Source: LOIM. Allocations/holdings subject to change. Past performance is not a guarantee of future results. Target performance/risk represents a portfolio construction goal. It does not
represent past performance/risk and may not be representative of actual future performance/risk.
1Fund inception date: 24 January 2012.
2Dividend accumulated retail share class, net performance in EUR. Return compounded monthly. Drawdowns computed on monthly data. Sharpe ratio and volatility computed on monthly returns
with risk free=EONIA
8 FOR PROFESSIONAL/QUALIFIED INVESTORS ONLY.Global FinTech Cinque trend per il prossimo decennio
FinTech: le nostre convinzioni core
 Le società e i servizi finanziari stanno attraversando una fase di rapida trasformazione dovuta principalmente
 alle nuove tecnologie digitali

                                    Una transizione verso una società completamente cashless

                                    La finanza digitale contribuisce all’inclusione finanziaria per tutti

                                    La digitalizzazione riduce le barriere all’entrata, aumenta l’efficienza e permette l’implementazione di nuovi
                                    servizi finanziari

                                    L’ascesa degli ecosistemi tecnologici

                                    La cybersecurity: una necessità fondamentale per tutti i servizi finanziari digitali

                           LOF Global FinTech, un portafoglio high conviction per cogliere queste opportunità

Fonte: LOIM. A soli fini illustrativi.
 10 FOR PROFESSIONAL/QUALIFIED INVESTORS ONLY.
Transizione verso una società completamente cashless
Numero di transazioni non in contanti a livello mondiale (miliardi), per area, 2017-2022E
US$ mld
1.200 CAGR Crescita
North America Europe (including Eurozone) (2017-22F) (2017-18F)
Mature Asia-Pacific Emerging Asia
1.045,5 Globale 14,0% 11,2%
Latin America MEA
1.000
139,3 21,6% 17,9%
895,5 Crescita di oltre 10% dei pagamenti digitali
In via di sviluppo
57,7 6,0% 5,5%
23,5%
111,2
800 779,2 Il processo di sostituzione delle operazioni
90,2
54,3 in contanti con i pagamenti digitali
684,1
352,8 29,7% 28,6% continuerà per decenni.
604,7 74,4 51,1
600 48,4 269,5
538,6 61,9
45,5 208,7
49,3
43,1 161,1
123,7 90,2 10,2% 10,2%
81,7
400 96,2 74,2
67,6
61,3
55,6
8,5% 6,3%
Maturi
203,6
7,1%
170,4 185,9
144,2 156,3
133,8
200
168,2 176,3 184,5 192,8 201,8 4,7% 4,7%
160,6
0
2017 2018F 2019F 2020F 2021F 2022F
Fonti: Capgemini Financial Services Analysis 2019, World Payments Report 2019. A soli fini illustrativi.
11 FOR PROFESSIONAL/QUALIFIED INVESTORS ONLY.La finanza digitale contribuisce all’inclusione finanziaria per tutti
Una lacuna enorme negli Stati Uniti
Circa 1 famiglia americana su 4 (34 milioni di unità familiari) non ha alcun accesso - o non ha sufficiente
accesso - ai servizi bancari
Fully banked
Underbanked
6%
7%
Unbanked ...e nei mercati sviluppati
Status unknown
Secondo la FDIC, il 20% delle famiglie
americane non ha sufficiente accesso ai
19% servizi bancari.
68%
Fonte: FDIC, 2017 American Banker. A soli fini illustrativi.
12 FOR PROFESSIONAL/QUALIFIED INVESTORS ONLY.Cybersecurity: una necessità fondamentale per tutti i servizi finanziari digitali
Le violazioni di dati nei servizi finanziari sono tra le più costose in assoluto
(costo per violazione)
Health $380
Financials $336
Services $274 La cybersecurity è fondamentale
Life Science $264
I servizi finanziari sono tra le vittime più
Industrial $259
bersagliate dagli hacker, con danni
Technology $251 finanziari spesso elevati.
Education $245 Crescente connessione tra attacchi
Transportation $240 informatici e performance sui mercati
Communications $239 azionari.
Energy $228
Consumer $196
Retail $177
Hospitality $144
Entertainment $131
Research $123
Public Sector $110
Splunk, IBM, 2019.
13 FOR PROFESSIONAL/QUALIFIED INVESTORS ONLY.Un portafoglio ampiamente diversificato su tre categorie chiave
Established FinTech Enabling technology Upcoming FinTech
Società di finanza digitale consolidate, che Società che aiutano il settore finanziario a Società più giovani e meno consolidate che
si distinguono dalle altre. Queste sono sviluppare e implementare tecnologie. hanno le potenzialità per diventare le società
caratterizzate da crescita attorno al 15-16%, Queste aziende presentano una crescita consolidate del futuro. Di norma presentano
performance stabili e cap di mercato a degli utili stabile, sono di buona qualità e una crescita elevata con una cap di mercato
partire dai 20 mld di USD. possono essere di grandi o medie tipicamente inferiore a 10 mld di USD.
dimensioni.
Stabilità Prevedibilità Crescita
Fonte: LOIM. Le allocazioni sono soggette a modifica. Mostra il processo d’investimento intrapreso dal gestore in relazione ad alcuni tipi di investimento, ma
potrebbe non essere rappresentativo del portafoglio di investimenti passato o futuro del Fondo. A soli fini illustrativi.
14 FOR PROFESSIONAL/QUALIFIED INVESTORS ONLY.LOF Global FinTech: caratteristiche di portafoglio
(30 novembre 2020)
Ripartizione settoriale (%, ex-cash) 10 paesi principali (%, ex-cash)
60% Fund Index 80% Fund Index
50% 70%
60%
40%
50%
30% 40%
20% 30%
20%
10%
10%
0% 0%
10 posizioni principali Suddivisione per categoria Suddivisione per cap di mercato (%)
Active Absolute
50% Fund Index
GLOBAL PAYMENTS Established FinTech 4.1% 4.2%
FISERV Enabling Technology 4.1% 4.2% 8% 40%
AMERICAN EXPRESS Established FinTech 3.8% 4.0%
48% 30%
INTUIT Enabling Technology 3.6% 3.8% 43%
VISA Established FinTech 3.4% 4.0%
20%
SBI HDG. Established FinTech 2.5% 2.5%
WORLDLINE Established FinTech 2.2% 2.3% 10%
FINECOBANK SPA Established FinTech 2.2% 2.2% Established Fintech
0%
CAPITAL ONE FINL. Established FinTech 2.2% 2.2% Enabling Technology < USD 10 bn USD 10 bn – USD 50 bn – > USD 100 bn
PAYPAL HOLDINGS Established FinTech 1.9% 2.3% Upcoming Fintech 50 bn 100 bn
Fonte: LOIM. Benchmark: MSCI All Country World Index. A soli fini illustrativi. Le partecipazioni e/o allocazioni sono soggette a modifica. Qualsiasi riferimento a società o titoli specifici non
costituisce una raccomandazione ad acquistare, vendere, detenere o investire direttamente nelle società o nei titoli.
15 FOR PROFESSIONAL/QUALIFIED INVESTORS ONLY.Stock in portafoglio: established FinTech
PayPal (PYPL) è una piattaforma tecnologica che consente i pagamenti digitali e mobili per conto di clienti ed
esercenti. Oltre alla piattaforma principale, offre altri servizi interessanti, quali Braintree (elaborazione pagamenti),
Xoom (trasferimenti/rimesse di fondi) e Venmo (pagamenti P2P). Inoltre, la società effettua investimenti strategici in
America Latina (MercadoLibre) e Cina (UnionPay), migliorando la propria impronta globale
Nasdaq (NDAQ) è una società FinTech consolidata grazie alla forte posizione di mercato, CF elevato e in aumento e
al buon profilo di crescita organica. Le attività in abbonamento di Nasdaq sono aumentate fino a rappresentare negli
ultimi anni quasi tre quarti dei ricavi totali. Queste attività hanno inoltre tassi di ritenzione impressionanti, spesso
superiori al 90%, limitando il rischio di volatilità della top-line. La valutazione è attraente rispetto alle prospettive di
crescita.
FleetCor (FLT) offre servizi di pagamento per flotte commerciali e governative, prevalentemente per gli acquisti di
carburante. FleetCor offre inoltre una suite di soluzioni per flotte e servizi di pagamento della forza lavoro, tessere per
acquisti di alimentari, carte sconti per alloggi aziendali, servizi di gestione dei pagamenti di pedaggi elettronici e altri
servizi di pagamento specialistici per gestori di flotte. La strategia di crescita di FleetCor ha puntato fortemente sulle
acquisizioni e la società ha completato più di 75 operazioni dai primi anni 2000.
Fonte: Analisi LOIM. A soli fini illustrativi. Le informazioni di portafoglio riportate nel presente documento hanno fini esclusivamente illustrativi e non
intendono essere una raccomandazione d’investimento nei, o una dichiarazione esaustiva di tutti i fattori o le considerazioni che potrebbero essere
pertinenti per un investimento nei, titoli cui si fa riferimento. Qualsiasi riferimento a società o titoli specifici non costituisce una raccomandazione ad
acquistare, vendere, detenere o investire direttamente nelle società o nei titoli. Non si deve presupporre che le raccomandazioni fatte risulteranno
redditizie in futuro o riporteranno performance analoghe a quelle dei titoli discussi nel presente documento.
16 FOR PROFESSIONAL/QUALIFIED INVESTORS ONLY.Stock in portafoglio: enabling Technology
Fidelity National Information Services (FIS) è un fornitore di servizi di pagamento. La società offre servizi di
elaborazione per carte di credito e di addebito, servizi bancari elettronici, gestione del rischio degli assegni, incasso
assegni e servizi di elaborazione carte per istituzioni finanziarie ed esercenti. Oltre al profilo di crescita stabile e ai
rendimenti elevati, la fusione con Worldpay genera ulteriori potenzialità di guadagno.
Akamai (AKAM) è la società leader nell’ambito della prevenzione e della gestione degli attacchi DDOS. I ricavi della
divisione Performance and Security Solutions sono ora attestati al 60% del totale e si prevede aumenteranno. Akamai
ha registrato ROIC a doppia cifra e una costante crescita degli utili, con previsioni di incremento degli EPS del 13%.
Intuit (INTU) sviluppa e vende soluzioni software per la gestione aziendale e finanziaria, soluzioni per aziende di
piccole e medie dimensioni, istituzioni finanziarie, consumatori e professionisti contabili. La società fornisce software
per la gestione delle piccole imprese e l’elaborazione dei libri paga, la finanza personale, la preparazione e la
presentazione dei documenti e dichiarazioni fiscali.
Fonte: Analisi LOIM. A soli fini illustrativi. Le informazioni di portafoglio riportate nel presente documento hanno fini esclusivamente illustrativi e non
intendono essere una raccomandazione d’investimento nei, o una dichiarazione esaustiva di tutti i fattori o le considerazioni che potrebbero essere
pertinenti per un investimento nei, titoli cui si fa riferimento. Qualsiasi riferimento a società o titoli specifici non costituisce una raccomandazione ad
acquistare, vendere, detenere o investire direttamente nelle società o nei titoli. Non si deve presupporre che le raccomandazioni fatte risulteranno
redditizie in futuro o riporteranno performance analoghe a quelle dei titoli discussi nel presente documento.
17 FOR PROFESSIONAL/QUALIFIED INVESTORS ONLY.Stock in portafoglio: upcoming FinTech
Tradeweb (TW) crea e gestisce mercati elettronici per prodotti di tasso e di credito, azioni/ETF e mercati monetari. La
società serve clienti istituzionali, all’ingrosso e privati in 62 paesi del mondo. Tradeweb presenta una crescita dei ricavi
e degli utili a doppia cifra, nonché CF/ROI molto solidi.
Network International Holdings (NETW) è un'azienda mediorientale di elaborazione dei pagamenti, acquirente ed
emittente di carte di credito attiva in Medio Oriente e in alcune parti dell'Africa. La consideriamo una posizione
interessante per beneficiare dalla digitalizzazione dei pagamenti in un mercato poco sviluppato.
PagSeguro (PAGS) fornisce servizi di tecnologia finanziaria. La società offre numerose soluzioni per pagamenti
digitali, pagamenti personali mediante dispositivi POS e servizi per carte prepagate. Prevediamo diversi anni di solida
crescita degli utili grazie alla bassa penetrazione dei pagamenti con carte in Brasile, all’interessante opportunità di
vendite incrociate di prodotti e servizi diversi dai servizi di pagamento alla base di clienti esistente e alla grande leva
operativa incorporata nel modello aziendale.
Fonte: Analisi LOIM. A soli fini illustrativi. Le informazioni di portafoglio riportate nel presente documento hanno fini esclusivamente illustrativi e non intendono essere una raccomandazione
d’investimento nei, o una dichiarazione esaustiva di tutti i fattori o le considerazioni che potrebbero essere pertinenti per un investimento nei, titoli cui si fa riferimento. Qualsiasi riferimento a
società o titoli specifici non costituisce una raccomandazione ad acquistare, vendere, detenere o investire direttamente nelle società o nei titoli. Non si deve presupporre che le
raccomandazioni fatte risulteranno redditizie in futuro o riporteranno performance analoghe a quelle dei titoli discussi nel presente documento.
18 FOR PROFESSIONAL/QUALIFIED INVESTORS ONLY.LO Funds – World Brands Investire nei Brands più influenti a livelllo mondiale
LO Funds – World Brands
Investire nei Top Brands
1 Cogliere i trends attraverso i brands 3 Esperienze
I global trends stanno guidando il cambiamento a lungo termine della Juan Mendoza gestisce questo fondo dal lancio, nel 20092, ed è
società e avranno un grande impatto sui marchi in tutti i settori supportato dall'esperienza dei team Global Trends, EM-Asian, Global
Outperform l’indice MSCI World1 Sector Research & Investment Platform
Gestito dall’ufficio di Hong-Kong, ha la possibilità di entrare a contatto
in anteprima su quelli che sono i nuovi trend e i nuovi brand emergenti
Identificare un elevato potenziale di crescita
2 sostenibile 4 Portafoglio High Conviction
Marchi accuratamente selezionati di tutti i settori che possono Un portafoglio di 30 / 60 titoli ad alta qualità
beneficiare dei forti cambiamenti nel comportamento dei consumatori Un return on equity, cash flow e attese di crescita maggiori rispetto
con interessanti prospettive di crescita: Sostenibilità, Demografia, all’indice MSCI World1Index
Tecnologia, Emerging Markets Brands e Healthy Living
Un portafoglio diversification in 3 buckets: Global Brands, Upcoming
All’interno dell’universo d’investimento troviamo intangible assets Brands e Digital Brands
difficili da replicere – come Brand e Platform – con un elevato pricing
tracking error di 5-10% con un excess return annuo di 3-5%
power
Un’analisi fondamentale sui titoli più promettenti
1For illustrative purposes only. Holdings and/or allocations are subject to change. / 2 Since August 2009 for Retail Share Class. Past performance relates to the CS (Lux) Global Prestige Equity Fund currently
managed by Credit Suisse Asset Management. Citywire rating as of 31 January 2020. / 3 Source: LOIM, Morningstar (Global large blend equity category, benchmark MSCI World EUR) NA EUR share class,
31 May 2020. Ratings subject to change without notice. Since manager change on 31 December 2009. Performance of the fund reflects the performance of CS (Lux) Global Prestige Equity Fund, which was
managed by Credit Suisse Asset Management. The CS fund was formerly known as Clariden Leu (Lux) Luxury Goods Equity Fund (21.08.2009-01.04.2012) prior to the integration of Clariden Leu AG into
Credit Suisse. The fund was transferred to LO Funds-World Brands (previously LO Funds-Global Prestige) and managed by Lombard Odier Investment Managers from 26 June 2018. Past performance is not a
guarantee of future results. Target performance/risk represents a portfolio construction goal. It does not represent past performance/risk and may not be representative of actual future performance/risk.
20 FOR PROFESSIONAL/QUALIFIED INVESTORS ONLY.Investire nei Brands migliori al mondo
Investire nei brands a livello globale Performance YTD, 3 Years e 5 Years (agosto 2020)
120% 111%
100%
1 Finanziari solidi 81%
80%
60% 54%
Selezionare i
migliori machi 2 Sostenibilità 40% 32%
al mondo 22%
20%
0%
Creazione di un -1%
3 marchio di successo -20%
YTD 3Y 5Y
World Brands EUR PA MSCI World EUR
Source: Lombard Odier, as at 30 September 2020. Performance for the LO Funds – World Brands EUR NA. Past performance is not a guarantee of future results. Since manager change on
31 August 2009. Performance of the fund reflects the performance of CS (Lux) World Brands Equity Fund, which was managed by Credit Suisse Asset Management. Dividend accumulated
intermediary client share class since 03/05/2013, net of fees in EUR. Return compounded monthly./ MSCI World ND EUR. The CS fund was formerly known as Clariden Leu (Lux) Luxury
Goods Equity Fund (21.08.2009-01.04.2012) prior to the integration of Clariden Leu AG into Credit Suisse. The fund was transferred to LO Funds–World Brands and managed by Lombard
Odier Investment Managers on 26 June 2018. On 25 May 2020, LO Funds – Global Prestige was renamed LO Funds – World Brands. Source: Morningstar, Date 2019, EUR NA share class,
EUR Flexible Bond category. Source: Citywire, 30 June 2019. Ratings and awards subject to change without notice.
21 FOR PROFESSIONAL/QUALIFIED INVESTORS ONLY.Brands 2030 - Le nostre convinzioni sul futuro
Cambiamenti di comportamento nel lungo termine che avrà un grande impatto su marchi e settori
Sustainability Revolution: un nuovo mindset che diventerà uno standard tra consumatori e investitori. La spesa etica
crescerà in modo esponenziale e i marchi dovranno essere in grado di guidare questa transizione
Demographics: il mondo avrà 1 miliardo di persone in più ento il 2030 and 2ml nella classe media. Questa crescita
nella middle class e le nuove generazioni sempre più digitali rappresentano la più grande opportunità per le società
Technology: il digital e i consumi online cresceranno ampiamente rispetto agli acquisti offline. Artificial Intelligence,
piattaforme in sharing ed eCommerce reinventeranno l’esperienza di fare shopping
Brands di paesi emergenti: diversi brands cinesi e indiani entreranno nella top30 mondiale come maggiori marchi di
maggior prestigio a discapito di marchi europei e americani
Healthy Living: sempre più marchi saranno rilevanti per uno stile di vita più sano, sia per i Millennials che GenZ
LOF World Brands coglie opportunità attraverso un portafoglio high-conviction
Source: LOIM. For illustrative purposes only.
22 FOR PROFESSIONAL/QUALIFIED INVESTORS ONLY.In quali tipologie di brands investiamo?
GLOBAL BRANDS UPCOMING BRANDS DIGITAL BRANDS
Upcoming Brand globali Best digital Brands globali con revenues derivanti
Best in Class Brand e portafogli di Brands Market share e revenues in crescita a tassi principalmente da servizi web
Stabili e prevedibili earnings e cash flows maggiori rispetto al settore, tipicamente a doppia Revenues in crescita a doppia cifra yoy
Almeno il 30% delle revenues da mercati globali cifra
Source: LOIM, 2020.
23 FOR PROFESSIONAL/QUALIFIED INVESTORS ONLY.LOF World Brands: caratteristiche di portafoglio
(30 novembre 2020)
Sector breakdown (in % ex-cash) Top 10 countries (in % ex-cash)
45% Portfolio 70% Portfolio
40% 60%
35% Benchmark Benchmark
30% 50%
25% 40%
20% 30%
15%
10% 20%
5% 10%
0% 0%
Top 10 active positions (in % ) Market cap breakdown (in % ex-cash) Top 5 currencies (in %)
Company name % Active % Absolute 100% Portfolio Benchmark 100%
Portfolio
TESLA 3.3% 4.2%
80% 80% Benchmark
LULULEMON ATHLETICA 3.0% 3.1%
ESTEE LAUDER COS.'A' 2.9% 3.1% 60% 60%
HERMES INTL. 2.8% 2.8%
NIKE 'B' 2.6% 3.0% 40% 40%
LVMH 2.6% 2.9%
20% 20%
FERRARI 2.3% 2.4%
XPENG 1:2 ADR 2.2% 2.2% 0% 0%
MEITUAN 2.2% 2.2% 0-4 bn USD 4-10 bn USD >10 bn USD #N/A #N/A #N/A #N/A #N/A #N/A
KWEICHOW
Source: MOUTAI
LOIM. For 'A' purpose2.0%
illustrative 2.0%and/or allocations are subject to change. Any reference to a specific company or security does not constitute a recommendation to buy,
only. Holdings
sell, hold or directly invest in the company or securities. It should not be assumed that the recommendations made in the future will be profitable or will equal the performance of the securities
discussed in this document. Source: Morningstar, 30 September 2019, EUR NA share class, EUR Flexible Bond category. Ratings and awards subject to change without notice. Citywire, 30
September 2019. Ratings and awards subject to change without notice.
24 FOR PROFESSIONAL/QUALIFIED INVESTORS ONLY.LOF World Brands: performance PA EUR
(30 novembre 2020)
Fund - cumulative performance 1 Portfolio statistics
500% Fund assets under management EUR 651 million
LO Funds - World Brands, (EUR) P A MSCI World in EUR ND
450% Number of positions 61
400%
350% Performance statistics
300%
Annualised
250% 2
ITD 3Y
200%
150% Class PA EUR Fund Bench³ Fund Bench³
100% Absolute return 16.07% 11.92% 19.87% 9.36%
50% Volatility 15.94% 12.16% 18.24% 16.58%
0% Sharpe ratio 1.00 0.98 1.11 0.59
-50% Excess return 4.15% - 10.51% -
Aug-09 Jan-11 Jun-12 Nov-13 Apr-15 Sep-16 Feb-18 Jul-19 Nov-20 Tracking error 11.24% - 9.64% -
Information ratio 0.32 - 0.99 -
Fund - historical performance 1
Yearly returns Monthly excess returns
Absolute
Class PA EUR Fund Bench³ Excess Jan Feb Mar Apr May Jun Jul Aug Sep Oct Nov Dec
2016 0.92% 10.73% -9.80% 1.21% 0.41% -1.43% -3.35% -3.99% -0.51% 2.35% -0.73% 0.60% 0.69% -2.91% -1.74%
2017 27.12% 7.51% 19.60% 2.22% -3.11% 4.59% 3.62% 1.17% 0.12% 2.40% 2.89% -0.65% 1.78% 0.52% 1.41%
2018 0.49% -4.11% 4.60% 2.31% 1.95% 3.43% 3.05% 4.97% -0.25% -5.32% 1.73% -0.53% -6.50% -0.38% 1.17%
2019 34.11% 30.02% 4.09% 1.41% 0.76% 3.10% 0.48% -0.48% 1.74% -0.97% 0.43% -3.13% -0.61% 0.17% 0.54%
2020 25.51% 4.34% 21.18% -0.48% 0.96% 5.74% -1.84% 4.26% 5.61% 1.83% 5.16% -2.72% 2.11% -2.34%
Past performance is not a guarantee of future results. Fund inception date 25 June 2018. Performance of the fund reflects the performance of CS (Lux) Global Prestige Equity Fund, which was
managed by Credit Suisse Asset Management. The CS fund was formerly known as Clariden Leu (Lux) Luxury Goods Equity Fund (21.08.2009-01.04.2012) prior to the integration of Clariden
Leu AG into Credit Suisse. The fund was transferred to LO Funds-Global Prestige and managed by Lombard Odier Investment Managers on 26 June 2018. On 25 May 2020, LO Funds –
Global Prestige was renamed LO Funds – World Brands. 1 Dividend accumulated share class, net performance in EUR. Return compounded monthly; 2 Since strategy inception; 3 MSCI World
in EUR ND. Source: LOIM.
25 FOR PROFESSIONAL/QUALIFIED INVESTORS ONLY.Dall’universo d’investimento al portafoglio High Conviction
Un processo high conviction di stock picking
1. Universo investimento iniziale 1 (2500 stocks)
Difficoltà di replicare intangible assets
e pricing power
Brands 2030 trends
2. Universo di World Brands (350 stocks) Sustainability Demographics Technology Chinese Brands Healthy Living
Identificare società con un forte Equity Brand in
grado di generare Excess Economic Return (EER) e Sostenibilità dei financial models
identificare strong/weak pratiche di business (ESG)
3. “Sustainable” investment universe (210 stocks)
Sostenibilità delle business practices
Un’analisi forward looking analysis
Stewardship
su business models e valutazioni Sostenibilità dei business models
High Conviction portfolio (30 - 60 stocks) Global Brands Upcoming Brands Digital Brands
Source: LOIM. 1Minimum USD 1 billion market cap, minimum USD 5mn average daily liquidity, listed in developed markets. Allocations are subject to change. It illustrates the investment
process undertaken by the manager in respect of a certain type of investment, but may not be representative of the Fund's past or future portfolio of investments. For illustrative purposes
only.
26 FOR PROFESSIONAL/QUALIFIED INVESTORS ONLY.LO Funds – Golden Age Benefitting from the ageing society
LO Funds–Golden Age
FUND MANAGEMENT LO Funds - Golden Age
Gestito da Johan Utterman e Henk Grootveld, con più di vent’anni di esperienza nel settore, il fondo è parte, Approccio d’investimento High-Conviction
della piattaforma Equity High Conviction, con USD 7,5 billion di masse in gestione
Asset Class Azionario, globale, tematico
FILOSOFIA D’INVESTIMENTO Indice riferimento MSCI World
Strategia globale, long-only, settoriale con focus sul mega trend demografico Mega Trend Demografia
Almeno il 30% del fatturato delle aziende deve derivare da persone over 55 (baby boomers)
Settori principale Healthcare, Consumer,
Approccio high-conviction, bottom up con esposizione a multi settori. Storicamente il comparto ha l’80% del Financial
portafoglio esposto a Healthcare, Consumer, Financial, settori che beneficiano maggiormente del trend
Volatilità Inferiore al benchmark
demografico
Top-down overlay settoriale e geografico Valuta del fondo USD
Il Benchmark di riferimento è MSCI World, ma il gestore prende posizioni fuori dal benchmark fino al 30% Posizioni 50-70
PROCESSO D’INVESTIMENTO & RISK MANAGEMENT
Un portafoglio di 50-70 titoli – ben diversificato – principalmente in tre settori : Healthcare, Consumer e
Financial
Criteri di esclusione di titoli illiquidi: almeno $500m di market cap e $2m di liquidità giornaliera
Analisi fondamentale bottom up sui 180 titoli dell’universo investibile
28 FOR PROFESSIONAL/QUALIFIED INVESTORS ONLY.La crescita della Silver Generation avrà un importante impatto in numerosi settori
In questa decade ci aspettiamo che…
Baby boomer brands: Il numero di baby boomer che hanno tempo e denaro disponibile crescerà in modo
esponenziale. Inoltre, la fedeltà nei marchi tra i baby boomer rimane molto alta
Pension providers: forme pensionistiche private e piani di risparmio diventeranno sempre più la norma
eHealth: il supporto tecnologico alla sanità. L’interconnessione dei pazienti con strumenti digitali trasformerà il
settore health care aumentando l’efficacia e riducendo i costi
Healthy living: una maggior prevenzione sanitaria basata su stili di vita più sani e una dieta più equilibrata
Longevity: costante allungamento delle aspettative di vita nel tempo grazie ai miglioramenti sanitari
LOF – Golden Age coglie queste opportunità attraverso un portafoglio high-conviction
29 FOR PROFESSIONAL/QUALIFIED INVESTORS ONLY.eHealth: la sanità abbraccerà nuovi strumenti digitali per diventare sempre più
economica ed efficace
La spesa healthcare US è cresciuta più velocemente del PIL nelle
ultime decadi
900%
800% National health expenditures 818%
Gross domestic product
Wages Aumento
700%
percentuale
Inflazione sanitaria inversa
600%
• AI Healthcare genererà risparmi per
500% $150bn all'anno entro il 2026
• Si stima che la chirurgia robo-assistita
400% arriverà a $40bn entro il 2026
• L'auto diagnosi porterà ad un'esplosione di
dati e ad una migliore diagnostica
300%
200%
168%
100%
0% 16%
1960 1965 1970 1975 1980 1985 1990 1995 2000 2005 2010
Source:: McKinsey “Accounting for the Cost of U.S. Health Care” (2011), Center for American Progress. 1 2019 United Nations, DESA, Population Division. Licensed under Creative
Commons license CC By 3.0 IGO. United Nations, DESA, Population Division. World Population Prospects 2019. http://population.un.org/wpp/
30 FOR PROFESSIONAL/QUALIFIED INVESTORS ONLY.Healthy living: abitudini sane sono la miglior prevenzione Source: McKinsey “Accounting for the Cost of U.S. Health Care” (2011), Center for American Progress. 1 2019 United Nations, DESA, Population Division. Licensed under Creative Commons license CC By 3.0 IGO. United Nations, DESA, Population Division. World Population Prospects 2019. http://population.un.org/wpp/ 31 FOR PROFESSIONAL/QUALIFIED INVESTORS ONLY.
Un universo di opportunità
                  Longevity                                                           Healthy Living                                                Baby Boomer Brands

                                                                                Ageing
                                                                                   500+ companies
                                                                               €25bn average market cap

                                                          Pension Providers                                   eHealth

Source: LOIM. For illustrative purposes only. Any reference to a specific company or security does not constitute a recommendation to buy, sell, hold or
directly invest in the company or securities. It should not be assumed that the recommendations made in the future will be profitable or will equal the
performance of the securities discussed in this document.
32 FOR PROFESSIONAL/QUALIFIED INVESTORS ONLY.
LOF Golden Age: caratteristiche di portafoglio
(30 novembre 2020)
SCOMPOSIZIONE GEOGRAFICA (EX CASH IN %) SCOMOPOSIZIONE SETTORIALE (EX CASH IN %)
70% Fund Fund
50%
MSCI World ND USD MSCI World ND USD
60%
40%
50%
40% 30%
30%
20%
20%
10% 10%
0% 0%
TOP TEN POSITIONS IN % TREND SPLIT SCOMPOSIZIONE MARKET CAP (EX CASH %)
Active Absolute
60% Portfolio
VOYA FINANCIAL 3.0% 3.0% Ehealth Baby
17,5% Boomer MSCI World ND USD
AMERICAN EXPRESS 3.0% 3.2% Brands
ABBVIE 3.0% 3.4% 23,9% 40%
KEYSIGHT TECHNOLOGIES 3.0% 3.0%
CHARLES SCHWAB 2.9% 3.1% Pension
Providers 20%
ANTA SPORTS PRODUCTS 2.9% 2.9% 19,2% Healthy
IQVIA HOLDINGS 2.8% 2.9% Living
LVMH 2.7% 3.0% 19,9%
Longevity 0%
VISA 2.7% 3.4% < USD 10 bn USD 10 bn – USD 50 bn – > USD 100 bn
19,4%
MERCK & COMPANY 2.6% 3.0% 50 bn 100 bn
Source: LOIM. For illustrative purpose only. Holdings and/or allocations are subject to change. Any reference to a specific company or security does not constitute a recommendation to
buy, sell, hold or directly invest in the company or securities. It should not be assumed that the recommendations made in the future will be profitable or will equal the performance of the
securities discussed in this document.
33 FOR PROFESSIONAL/QUALIFIED INVESTORS ONLY.LOF Golden Age: performance PA USD
(30 novembre 2020)
Fund - cumulative performance 1 Portfolio statistics
200% Fund assets under management USD 940 million
LO Funds - Golden Age, (USD) P A MSCI World ND USD
Number of positions 53
150%
Performance statistics
100% Annualised
2
ITD 3Y
50% Class PA USD Fund Bench³ Fund Bench³
Absolute return 8.96% 9.65% 9.89% 9.48%
0% Volatility 13.50% 14.50% 16.74% 18.43%
Sharpe ratio 0.60 0.61 0.48 0.42
-50% Excess return -0.69% - 0.42% -
Nov-09 Apr-11 Aug-12 Jan-14 May-15 Oct-16 Feb-18 Jul-19 Nov-20 Tracking error 6.40% - 5.03% -
Information ratio -0.15 - -0.01 -
Fund - historical performance 1
Yearly returns Monthly excess returns
Absolute
Class PA USD Fund Bench³ Excess Jan Feb Mar Apr May Jun Jul Aug Sep Oct Nov Dec
2013 29.41% 26.68% 2.73% 1.23% 2.25% 1.44% -0.40% -0.09% 0.32% 0.44% -0.56% -1.58% -1.11% 0.60% -0.34%
2014 11.08% 4.94% 6.14% 2.19% -0.25% -2.30% -3.17% 1.37% -0.85% 1.05% 0.37% 2.86% 0.95% 2.11% 1.36%
2015 1.58% -0.87% 2.45% 1.72% -0.72% 3.46% -4.12% 2.89% 0.63% 2.07% -1.00% -1.55% -2.37% 0.16% 1.29%
2016 -7.61% 7.51% -15.12% -2.47% -0.41% -2.16% -1.60% 1.68% 0.93% -0.83% -2.62% -0.23% -3.23% -2.33% -1.73%
2017 26.12% 22.40% 3.72% 1.53% -0.09% 0.17% 2.18% 1.73% 0.58% -0.89% -0.15% -1.25% 0.03% 0.23% -0.95%
2018 -5.32% -8.71% 3.39% 0.83% -0.69% 0.60% 0.57% -0.29% 0.05% 0.47% 0.49% 0.10% -0.67% 1.45% 0.84%
2019 22.03% 27.67% -5.64% -1.68% 0.16% 1.10% -3.50% 2.10% 0.62% -1.03% 2.17% -3.48% -0.44% -0.53% -0.26%
2020 14.54% 11.19% 3.35% -0.18% 1.70% 1.45% -1.07% 1.15% -0.86% 0.83% -3.39% 2.24% 1.25% -0.86%
Past performance is not a guarantee of future results. Share class launch date 13 November 2009.FX hedging contributed 1.9% from May 2012 until October 2015 - Official benchmark over
the period: MSCI World ND Unhedged USD since 30 September 2015, previously MSCI World ND Hedged USD (since 31 May 2012), before that MSCI World ND USD 1 Dividend
accumulated share class, net performance in USD. Return compounded monthly; 2 Since inception; 3 MSCI World ND USD. Source: LOIM.
34 · Lombard Odier Investment Managers - Please see important information at the end of this document.Le nostre principali soluzioni d’investimento
Multi Asset Equity Sostenibile
Novità!
Crescita del capitale con Digitalizzazione dei servizi Catturare il potenziale di Dal 2020 più persone con più di
protezione dai drawdown finanziari rendimento dei brand sostenibili 65 anni che bambini inferiori ai
5
LO Funds – All Roads LO Funds – Global FinTech LO Funds – World Brands LO Funds – Golden Age
All Roads PA EUR - LU0718509606 Global Fintech PA USD- LU2107599644 World Brands EUR PA - Golden Age USD PA - LU0431649028
Global FinTech PA EUR H- LU2107604402 LU1809976522 Golden Age EURH PA - LU0161986921
35 FOR PROFESSIONAL/QUALIFIED INVESTORS ONLY.LombardOdier IM: siamo a vostra disposizione
Head of Distribution Senior Sales
M +393347568671 M +393454664897
T +390230314605 T +390230314606
g.fonseca@lombardodier.com a.redaelli@lombardodier.com
wwwlombardodiercomLO Funds – Global FinTech- Rischi principali
Indicatore sintetico di rischio (SRRI)
1 2 3 4 5 6 7
Rischio inferiore Rischio più elevato
Rendimenti potenzialmente minori Rendimenti potenzialmente maggiori
Questo indicatore (SRRI) rappresenta la volatilità storica annualizzata del Comparto possono generare difficoltà nelle operazioni di compravendita degli investimenti
nell’arco di un periodo di 5 anni. Laddove i dati disponibili risalgano a un periodo stessi. Inoltre, i mercati emergenti sono più esposti a incertezze politiche e gli
inferiore a 5 anni, i rendimenti mancanti vengono simulati con l’aiuto di un benchmark investimenti in questi paesi potrebbero non godere della stessa protezione di quelli
idoneo. L’indicatore SRRI può cambiare nel tempo e non deve essere utilizzato come effettuati nei paesi più sviluppati.
un indicatore di rischio o rendimento futuro. Anche la classificazione di rischio più
bassa non implica che il Comparto sia privo di rischio o che il capitale sia Rischio di gestione attiva: la gestione attiva consiste nel prevedere vari sviluppi di
necessariamente garantito o protetto. mercato e/o nella selezione dei titoli. Sussiste il rischio, in qualunque momento, che il
fondo non sia investito nei mercati o nei titoli dalle performance più elevate. Anche il
Il Comparto investe prevalentemente in azioni e titoli correlati alle azioni emessi dalle valore patrimoniale netto del fondo può diminuire.
società di tutto il mondo (inclusi i Mercati Emergenti).
I seguenti rischi possono essere sostanzialmente rilevanti ma potrebbero non essere Prima di prendere qualsiasi decisione d’investimento, si prega di leggere
sempre adeguatamente espressi dall’indicatore di rischio sintetico e potrebbero l’ultima versione del prospetto, lo statuto, il KIID (documento contenente le
conseguentemente causare perdite addizionali. informazioni chiave per gli investitori) e le ultime relazioni annuale e
semestrale. Prestare attenzione all’allegato sui fattori di rischio dell’Appendice
Rischio di concentrazione: nella misura in cui gli investimenti del fondo sono B del prospetto.
concentrati in un particolare paese, mercato, industria, settore o asset class, il fondo
può essere soggetto a perdite dovute a eventi sfavorevoli che interessano tale paese, .
mercato, industria, settore o asset class.
Rischio dei mercati emergenti: investimenti significativi nei mercati emergenti
37 FOR PROFESSIONAL/QUALIFIED INVESTORS ONLY.LO Funds – Golden Age
Risk profile
Synthetic risk indicator (SRRI)
The value of these shares is exposed to high volatility,
1 2 3 4 5 6 7 which means that this value may be subject to high
variations both upward and downward that may create
Lower risk Higher risk important short term latent losses.
Potentially lower rewards Potentially higher rewards
The following risks may be materially relevant but may not always be adequately captured by Currencies: If the Sub-Fund is denominated in a currency other than that in which the
the Synthetic Risk Indicator and may cause additional loss: majority of the investors assets are held, the investor should be aware that changes in
Counterparty risk: When a fund is backed by a guarantee from a third party, or where its rates of exchange may affect the value of the funds underlying assets.
investment exposure is obtained to a material degree through one or more contracts with a The portfolio risk management process includes an effort to monitor and manage risks,
counterparty, there could be a material risk that the counterparty to the transactions will fail to but this does NOT imply that investing in this Sub-Fund is risk-free.
honour its contractual obligations. This may result in a financial loss to the Fund. There can be no assurance that a return will be achieved or that a substantial loss
Risks linked to the use of derivatives and financial techniques: Derivatives and other of capital will not be incurred.
financial techniques used substantially to obtain, increase or reduce exposure to assets may Before taking any investment decision, please read the latest version of the
be difficult to value, may generate leverage, and may not yield the anticipated results. All of prospectus, the articles of incorporation, the Key Investor Information Documents
this could be detrimental to fund performance. (KIIDs) and the latest annual report and semi-annual report. Please pay attention to
Concentration risk: To the extent that the fund’s investments are concentrated in a the Appendix B “Risk Factors Annex” of the prospectus.
particular country, market, industry, sector or asset class, the fund may be susceptible to loss
due to adverse occurrences affecting that country, market, industry, sector or asset class.
Derivatives: The strategy may include the use of derivatives. Derivatives often involve a high
degree of financial risk because a relatively small movement in the price of the underlying
security or benchmark may result in a disproportionately large movement in the price of the
derivative and are not suitable for all investors. No representation regarding the suitability of
these instruments and strategies for a particular investor is made.
38 FOR PROFESSIONAL/QUALIFIED INVESTORS ONLY.LO Funds – World Brands
Risk profile
Synthetic risk indicator (SRRI)
The value of these shares is exposed to high volatility,
1 2 3 4 5 6 7 which means that this value may be subject to high
variations both upward and downward that may create
Lower risk Higher risk important short term latent losses.
Potentially lower rewards Potentially higher rewards
The following risks may be materially relevant but may not always be adequately captured by The portfolio risk management process includes an effort to monitor and manage risks,
the Synthetic Risk Indicator and may cause additional loss: but this does NOT imply that investing in this Sub-Fund is risk-free.
Concentration risk: To the extent that the fund’s investments are concentrated in a There can be no assurance that a return will be achieved or that a substantial loss
particular country, market, industry, sector or asset class, the fund may be susceptible to loss of capital will not be incurred.
due to adverse occurrences affecting that country, market, industry, sector or asset class. Before taking any investment decision, please read the latest version of the
Emerging market risk: Significant investment in emerging markets may expose to prospectus, the articles of incorporation, the Key Investor Information Documents
difficulties when buying and selling investments. Emerging markets are also more likely to (KIIDs) and the latest annual report and semi-annual report. Please pay attention to
experience political uncertainty and investments held in these countries may not have the the Appendix B “Risk Factors Annex” of the prospectus.
same protection as those held in more developed countries.
Active management risk: Active management relies on anticipating various market
developments and/or security selection. There is a risk at any given time that the fund may
not be invested in the highest-performing markets or securities. The fund’s net asset value
may also decline.
Currencies: If the Sub-Fund is denominated in a currency other than that in which the
majority of the investors assets are held, the investor should be aware that changes in rates
of exchange may affect the value of the funds underlying assets.
39 FOR PROFESSIONAL/QUALIFIED INVESTORS ONLY.Key risks: LO Funds – All Roads
Synthetic risk indicator (SRRI)1 Before taking any investment decision, please read the latest version of
1 2 3 4 5 6 7 the prospectus, the articles of incorporation, the Key Investor Information
Documents (KIIDs) and the latest annual report and semi-annual report.
Lower risk Higher risk Please pay attention to the Appendix B “Risk Factors Annex”
Potentially lower return Potentially higher return of the prospectus.
The following risks may be materially relevant but may not always be adequately captured by the Synthetic Risk Indicator and may cause additional loss:
Counterparty risk When a fund is backed by a guarantee from a third party, or where its investment exposure is obtained to a material degree through one or more
contracts with a counterparty, there could be a material risk that the counterparty to the transactions will fail to honour its contractual obligations. This may result in a
financial loss to the Sub-Fund
Risks linked to the use of derivatives and financial techniques: Derivatives and other financial techniques used substantially to obtain, increase or reduce
exposure to assets may be difficult to value, may generate leverage, and may not yield the anticipated results. All of this could be detrimental to fund performance
Model Risk: Models may be misspecified, badly implemented or may become inoperative when significant changes take place in the financial markets or in the
organization. Such a model could unduly influence portfolio management and expose to losses.
Please also pay attention to the following risks of this Sub-Fund:
The Sub-Fund is denominated in a currency other than that in which the majority of the investors assets are held, the investor should be aware that changes in rates
of exchange may affect the value of the funds underlying assets
The portfolio risk management process includes an effort to monitor and manage risks, but this does NOT imply that investing in this Sub-Fund is risk-free.
There can be no assurance that a return will be achieved or that a substantial loss of capital will not be incurred.
1 LO Funds – All Roads Conservative has a lower SRRI level of 3.
40 FOR PROFESSIONAL/QUALIFIED INVESTORS ONLY.Informazioni Importanti
Lombard Odier Funds (di seguito il “Fondo”) è una società di investimento a capitale variabile (SICAV) del informazioni di MSCI (collettivamente le “parti MSCI”) e altri fornitori di dati escludono espressamente tutte le
Lussemburgo. Il Fondo è autorizzato e disciplinato dalla Autorità di Sorveglianza del Mercato Finanziario garanzie relative alle presenti informazioni (comprese, a titolo esemplificativo e non esaustivo, tutte le garanzie di
lussemburghese (CSSF) quale Organismi di investimento collettivo in valori mobiliari (OICVM) conformemente originalità, accuratezza, completezza, puntualità, non violazione, commerciabilità e idoneità a un particolare
alla Parte I della legge lussemburghese del 17 dicembre 2010 che attua la Direttiva Europea 2009/65/EC, come scopo). Fermo restando quanto precede, in nessun evento una parte MSCI o un altro fornitore di dati sarà
modificata (“Direttiva OICVM”). La Società di Gestione del Fondo è Lombard Odier Funds Europe) S.A (di seguito ritenuto responsabile di eventuali danni diretti, indiretti, speciali, incidentali, punitivi, consequenziali (comprese, a
la “Società di Gestione”), società per azioni di diritto lussemburghese, con sede legale in 291, route d’Arlon L- titolo esemplificativo, eventuali perdite di profitto) o di qualsiasi altro danno.
1150 Lussemburgo, Granducato di Lussemburgo, autorizzata e disciplinata dalla CSSF quale Società di Gestione
Tutti gli indici o benchmark qui menzionati sono indicati a solo scopo informativo. Nessun indice o benchmark è
conformemente alla Direttiva Europea 2009/65/EC, come modificata. Il presente documento di marketing si
direttamente comparabile agli obiettivi di investimento, strategia o universo del Sotto-fondo. La performance del
riferisce a "Golden Age", un Sotto-fondo di Lombard Odier Funds (di seguito il "Sotto-fondo").
benchmark non è indicativa di performance passate o future del Sotto-fondo. Non si deve presumere che il fondo
Il presente documento di marketing è stato redatto da Lombard Odier Asset Management (Europe) Limited. in oggetto investirà in strumenti finanziari specifici che comprendono indici né si deve desumere nessuna
correlazione tra il risultato del Sotto-fondo e quello di qualsiasi altro indice. Il target di performance/rischio
Lo statuto, il prospetto, le informazioni chiave per gli investitori (KIID), il modulo di sottoscrizione ed i più recenti
rappresenta un obiettivo della costruzione del portafoglio. Non rappresenta il rapporto performance/rischio
documenti finanziari annuali e semestrali sono i documenti ufficiali di offerta delle azioni del Fondo (la
passato e non può essere rappresentativo dell'effettivo apporto performance/rischio futuro.
“Documentazione di Offerta”). La Documentazione di Offerta è disponibile in inglese, francese, tedesco e italiano
sul sito www loim com e può essere richiesta gratuitamente presso la sede legale del Sotto-Fondo in Le informazioni e le analisi ivi contenute sono basate su fonti ritenute affidabili. Lombard Odier fa del proprio
Lussemburgo: 291 route d’Arlon, 1150 Lussemburgo, Granducato di Lussemburgo. meglio per assicurare la puntualità, l’accuratezza o la completezza delle informazioni contenute nel presente
documento.
Le informazioni contenute nella presente comunicazione di marketing non tengono conto di circostanze
specifiche, degli obiettivi o delle esigenze di ciascuno e non rappresentano una ricerca, né intendono comunicare Tuttavia, tutte le informazioni e le opinioni, i prezzi, le valutazioni di mercato e i calcoli ivi contenuti possono
che una strategia d’investimento sia adatta o adeguata a singole circostanze, né che un investimento o una cambiare senza preavviso. Fonte dei dati: i dati vengono preparati da Lombard Odier Asset Management
strategia siano un consiglio di investimento personale a un investitore. La presente comunicazione di marketing (Europe) Limited, se non diversamente indicato. Il trattamento fiscale dipende dalle singole circostanze personali
non intende sostituire un’assistenza professionale relativa a investimenti in prodotti finanziari. Prima di decidere di ogni cliente e può essere soggetto a modifica in futuro. Lombard Odier non offre consulenza fiscale e spetta a
l’investimento, l’investitore deve leggere tutta la Documentazione di Offerta ed in particolare i fattori di rischio ciascun investitore interpellare i propri consulenti fiscali.
relativi all’investimento nel Sotto-fondo. Desideriamo attirare l’attenzione dell’investitore sulla natura a lungo
termine della generazione di rendimenti nel ciclo economico e sul fatto che l’uso di strumenti finanziari derivati
nel contesto della strategia d’investimento potrebbe risultare in un maggior livello di leva finanziarie e a un
aumento dell’esposizione complessiva al rischio del Sotto-fondo e della volatilità del suo valore patrimoniale
netto. Gli investitori dovrebbero valutare l'adeguatezza di un investimento di questo tipo in base al proprio
specifico profilo di rischio e alle proprie circostanze personali e, se necessario, ricevere una consulenza
professionale indipendente in relazione ai rischi, oltre che alle conseguenze legali, normative, di credito, fiscali e
contabili dell’investimento. Non c’è nessuna garanzia che gli obiettivi di investimento del Sotto-fondo saranno
raggiunti o che ci sarà un guadagno rispetto al capitale iniziale. La performance bassata non è un indicatore
affidabile dei risultati futuri. Laddove il Sotto-fondo è denominato in una moneta diversa dalla moneta di base
dell’investitore, l’eventuale oscillazione del tasso di cambio potrebbe incidere sfavorevolmente sul prezzo e sulle
entrate Prendere debitamente nota dei fattori di rischio.
Le informazioni ottenute da MSCI e contenute nel presente documento possono essere utilizzate solo per uso
interno, non possono essere riprodotte né distribuite in alcuna forma e non possono essere usate per creare
strumenti o prodotti finanziari né alcun indice. Le informazioni di MSCI e quelle di altri fornitori di dati sono sono
fornite "come sono" e l’utente di tali informazioni si assume tutto il rischio di qualsiasi utilizzo ne faccia. MSCI, le
sue affiliate e qualsiasi altra persona coinvolta o in altro modo legata alla compilazione o creazione di
41 FOR PROFESSIONAL/QUALIFIED INVESTORS ONLY.Puoi anche leggere