Discorso del Presidente Mario Nava - Speech by the Chairman Mario Nava Milan, 11 June 2018 - Affari Italiani

Pagina creata da Valeria Fava
 
CONTINUA A LEGGERE
Discorso del Presidente Mario Nava - Speech by the Chairman Mario Nava Milan, 11 June 2018 - Affari Italiani
Consob Day 2018
         Discorso del Presidente
         Mario Nava

                                   Palazzo Carmagnola Consob Milano

         Consob Day 2018
         Speech by the Chairman
         Mario Nava

                                   Palazzo Carmagnola Consob Milan

Milan, 11 June 2018                                                   1
Discorso del Presidente Mario Nava - Speech by the Chairman Mario Nava Milan, 11 June 2018 - Affari Italiani
sostegno all’accesso al mercato
                                       informazione non finanziaria
                                   tutela del risparmio e degli investitori
                                           educazione finanziaria

              mercato domestico
                                   Arbitro per le controversie finanziarie
                                         leadership internazionale                      !
                                                                                vigilanza proattiva
               domanda e offerta                                              ecosistema economico
                                                                                   e finanziario

                                       supporting firms market access
                                         non financial information
                                       saving and investor protection
                                             financial education

               domestic market
                                    alternative dispute resolution (ACF)
                                          international leadership                      !
                                                                               proactive supervision
              supply and demand                                               economic and financial
                                                                                    ecosystem

Milan, 11 June 2018                                                                                    2
Discorso del Presidente Mario Nava - Speech by the Chairman Mario Nava Milan, 11 June 2018 - Affari Italiani
ITALIA nel mondo: 9a economia ‐ 17a piazza finanziaria
                TASSO DI CRESCITA DEL PIL

                                                                      TASSO DI RISPARMIO LORDO
                2018               1,4%                   2,4%
                                                                      2017               9,7%                  11,8%

                2017               1,5%                   2,3%
                                                                      2012               9,5%                 12,3%

                2012              ‐2,8%                  ‐0,9%

                                   Italia            area euro
                                                                      2005              14,7%                 13,2%
                 Fonte: Istat e FMI. Dati previsionali per il 2018.

                                                                                         Italia             area euro
                                                                      Fonte: Commissione europea. Dati stimati per il 2017. Valori
                                                                      in percentuale del reddito disponibile lordo.

                ITALY in the world: the 9th economy and the 17th financial market
                GDP GROWTH RATE

                                                                      GROSS SAVING RATE
                2018               1.4%                   2.4%
                                                                      2017               9.7%                  11.8%

                2017               1.5%                   2.3%
                                                                      2012               9.5%                 12.3%

                2012              ‐2.8%                  ‐0.9%

                                    Italy              euro area
                                                                      2005              14.7%                 13.2%
                 Source: Istat and IMF. Provisional data for 2018.

                                                                                         Italy               euro area
                                                                      Source: European Commission. Provisional data for 2017.
                                                                      Data are measured as percentage of gross disposable income.

Milan, 11 June 2018                                                                                                                  3
Discorso del Presidente Mario Nava - Speech by the Chairman Mario Nava Milan, 11 June 2018 - Affari Italiani
RICCHEZZA E INVESTIMENTI DELLE FAMIGLIE
                       ATTIVITÀ E PASSIVITÀ                            attività reali               attività finanziarie          passività finanziarie

                                     Italia                                 6,0                             3,8                             0,8

                                     area euro                              5,2                             3,7                             1,1

                       Fonte: Eurostat, BCE, Istat. Tutte le grandezze si riferiscono al 2016 e sono espresse in rapporto al reddito netto disponibile.

                       SCELTE DI PORTAFOGLIO
                           azioni quotate                fondi comuni               titoli di debito         riserve assicurative                liquidità
                                                                                                                               34%           33%            34%
                                                                                                                23%
                                                        12%           9%             9%
                            2%            4%                                                       3%
                          Italia     area euro         Italia     area euro        Italia     area euro         Italia    area euro         Italia        area euro
                       Fonte: Eurostat. Tutte le grandezze si riferiscono al 2016 e sono espresse in percentuale del totale delle attività finanziarie.

                       HOUSEHOLD WEALTH AND FINANCIAL INVESTMENTS
                       ASSETS AND LIABILITIES                          real assets                  financial assets              financial liabilities

                                     Italy                                  6.0                             3.8                             0.8

                                     euro area                              5.2                             3.7                             1.1

                       Source: Eurostat, ECB, Istat. Data refer to 2016 and are measured as percentage of net disposable income.

                       ASSET ALLOCATION
                50%
                             listed shares               mutual funds               debt securities           technical reserves         currency & deposits
                40%

                                                                                                                               34%           33%            34%
                30%

                                                                                                                23%
                20%

                                                        12%           9%             9%
                10%

                            2%            4%                                                       3%
                 0%

                ‐10%

                           Italy     euro area         Italy     euro area         Italy     euro area          Italy     euro area          Italy    euro area
                       Source: Eurostat. Data refer to 2016 and are measured as percentage of total financial assets.

Milan, 11 June 2018                                                                                                                                                   4
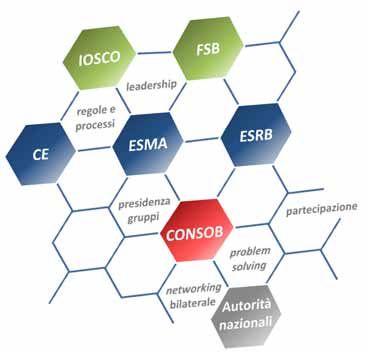
Discorso del Presidente Mario Nava - Speech by the Chairman Mario Nava Milan, 11 June 2018 - Affari Italiani
MERCATO AZIONARIO
                DIMENSIONI DEL MERCATO E DEL SETTORE FINANZIARIO NEL 2017
                                      capitalizzazione               settore finanziario/            settore finanziario/PIL
                                      totale/PIL                     capitalizzazione totale

                      Italia                37%                              30%                            11%

                      area euro             62%                              21%                            13%

                CAPITALIZZAZIONE/PIL NEL 2017                                                                     128%
                                                                                           100%
                                                                   58%
                                            37%

                                           Italia               Germania                 Francia             Regno Unito
                                    Fonte: elaborazioni su dati Thomson Reuters Datastream ed Eurostat per l’area euro; statistiche
                                    delle borse nazionali per i singoli paesi.

                STOCK MARKET
                MARKET AND FINANCIAL SECTOR SIZE IN 2017
                                      capitalisation/GDP             financial sector/               financial sector/GDP
                                                                     total capitalisation

                      Italy                 37%                              30%                            11%

                      euro area             62%                              21%                            13%

                CAPITALISATION/GDP 2017                                                                          128%
                                                                                          100%
                                                                    58%
                                             37%

                                            Italy                Germany                  France                   UK
                                    Source: calculations on Thomson Reuters Datastream and Eurostat data as for the euro area;
                                    national stock exchange data for country statistics.

Milan, 11 June 2018                                                                                                                   5
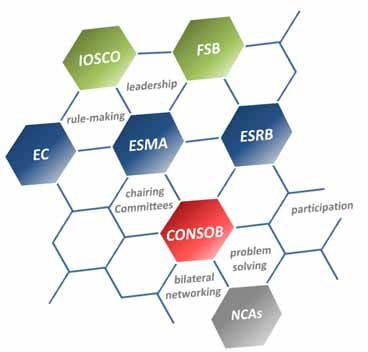
Discorso del Presidente Mario Nava - Speech by the Chairman Mario Nava Milan, 11 June 2018 - Affari Italiani
MERCATO AZIONARIO
                SOCIETÀ QUOTATE

                          2017               990                   465                  407                  240                    95

                          2009              1.121                  580                  605                  280                     5

                                          London                  Paris              Deutsche              MTA                     AIM
                                       Stock Exchange           EuroNext              Börse              Domestic                  Italia

                PERFORMANCE (31/12/2009 – 01/06/2018)
                                                                                           114%
                                              42%                    39%
                                                                                                                   ‐5%
                                           Ftse 100                Cac 40                 Dax 30                Ftse Mib
                                     Fonte: elaborazioni su dati Thomson Reuters Datastream e statistiche delle borse nazionali.

                STOCK MARKET
                LISTED COMPANIES

                          2017               990                   465                  407                  240                    95

                          2009              1,121                  580                  605                  280                     5

                                          London                  Paris              Deutsche              MTA                     AIM
                                       Stock Exchange           EuroNext              Börse              Domestic                  Italy

                PERFORMANCE (31/12/2009 – 01/06/2018)
                                                                                           114%
                                              42%                    39%
                                                                                                                   ‐5%
                                           Ftse 100                Cac 40                 Dax 30                Ftse Mib
                                     Source: calculations on Thomson Reuters Datastream and national stock exchanges data.

Milan, 11 June 2018                                                                                                                         6
Discorso del Presidente Mario Nava - Speech by the Chairman Mario Nava Milan, 11 June 2018 - Affari Italiani
MERCATO AZIONARIO
                 LE BIG COMPANIES QUOTATE (capitalizzazione > 50 miliardi di euro)

                numero                       2                2                  4                   9       9            14

                capitalizzazione
                                            51                89               108                  82       84           89
                media

                capitalizzazione
                totale                     102              178                431                  742     756         1.257

                                          Italia          Spagna            Olanda             Francia    Germania   Regno Unito
                Fonte: elaborazioni su dati ThomsonReuters Datastream; dati a fine 2017.

                STOCK MARKET
                 LISTED BIG COMPANIES (capitalisation > 50 billion euros)

                number                       2                2                  4                   9       9            14

                average
                                            51                89               108                  82       84           89
                capitalisation

                total
                capitalisation             102              178                431                  742     756         1,257

                                           Italy            Spain The Netherlands               France    Germany         UK
                Source: calculations on Thomson Reuters Datastream data; data at the end of 2017.

Milan, 11 June 2018                                                                                                                7
Discorso del Presidente Mario Nava - Speech by the Chairman Mario Nava Milan, 11 June 2018 - Affari Italiani
SISTEMA PRODUTTIVO
                PESO DELLE PMI SUL SETTORE NON FINANZIARIO

                      occupati                                     78,6%                   63,2%                  72,6%               63,4%

                      valore aggiunto                               67,7%                  54,5%                  61,8%               54,1%

                      capitalizzazione PMI
                                                                   0,13%                   0,08%                  0,05%              0,10%
                      sul totale di borsa

                                                                     Italia                Francia               Spagna             Germania
                      Fonte: Commissione europea, Annual Report on European SMEs 2016/2017, per occupazione e valore aggiunto del settore
                      non finanziario (il dato include le micro imprese). Statistiche delle borse nazionali per la capitalizzazione di mercato a fine
                      2017 (per le PMI quotate si intendono le società con capitalizzazione inferiore o uguale a 50 milioni di euro).

                REAL ECONOMY
                WEIGHT OF SMEs IN THE NON FINANCIAL SECTOR

                      employment                                   78.6%                   63.2%                  72.6%               63.4%

                      value added                                   67.7%                  54.5%                  61.8%               54.1%

                      listed SMEs capitalisation                   0.13%                   0.08%                  0.05%              0.10%
                      on total market value

                                                                     Italy                 France                 Spain             Germany
                      Source: European Commission, Annual Report on European SMEs 2016/2017, for employment and value added of non
                      financial sector (data include micro firms). National stock exchanges data for market capitalisation at the end of 2017 (listed
                      SMEs with capitalisation up to 50 million euros).

Milan, 11 June 2018                                                                                                                                     8
Discorso del Presidente Mario Nava - Speech by the Chairman Mario Nava Milan, 11 June 2018 - Affari Italiani
SISTEMA PRODUTTIVO
                INDEBITAMENTO DELLE PMI

                      2016                61,9%                      59,6%                    47,6%                   52,6%

                      2009                66,2%                      63,4%                    55,6%                   54,9%

                                           Italia                   Francia                   Spagna                Germania

                      Fonte: elaborazioni su dati BACH ‐ Bank for the Accounts of Companies Harmonized; rapporto tra debito e attività
                      delle imprese.

                REAL ECONOMY
                SMEs FINANCIAL LEVERAGE

                      2016                61.9%                      59.6%                    47.6%                   52.6%

                      2009                66.2%                      63.4%                    55.6%                   54.9%

                                            Italy                    France                    Spain                Germany

                      Source: BACH ‐ Bank for the Accounts of Companies Harmonized; debt to asset ratio.

Milan, 11 June 2018                                                                                                                      9
MERCATO OBBLIGAZIONARIO
                EMISSIONI NEL 2017                       settore finanziario                settore non finanziario

                               Italia                              62                                   43

                               area euro                          341                                   365

                               Fonte: Dealogic, Kler’s. Dati parzialmente stimati; miliardi di euro.

                                                                                                                 > € 50 milioni
                MINI‐BOND IN ITALIA
                                                                                                                      8,5
                         5,0
                                                                         5,5                 < € 50 milioni
                                  1,9                 3,5                                         2,4
                         0,0
                                 2015                2016               2017                            2015‐2017
                               Fonte: Politecnico di Milano, Report italiano sui mini‐bond, 2018. Valori in miliardi di euro.

                BOND MARKETS
                ISSUANCES IN 2017                          financial sector                 non financial sector

                               Italy                               62                                   43

                               euro area                          341                                   365

                               Source: Dealogic, Kler’s. Data are partially estimated; billion euros.

                                                                                                                 > € 50 million
                MINI‐BONDS IN ITALY
                                                                                                                      8.5
                         5,0
                                                                         5.5                 < € 50 million
                                  1.9                 3.5                                         2.4
                         0,0
                                 2015                2016               2017                            2015‐2017
                               Source: Politecnico di Milano, 2018; billion euros.

Milan, 11 June 2018                                                                                                               10
RISPARMIO E INVESTITORI
                            riducono la partecipazione           riducono la qualità            non è interessato         è a disagio        non sa valutare le
                            al mercato finanziario               delle scelte                   alla finanza              con la finanza     sue conoscenze

                            emotività                           percezioni
        attitudini                                                                                50%                      50%               40%
                             sfiducia                           soggettive

                            inflazione                 rischio‐rendimento          diversificazione           rischio              rischio          rischio
                                                                                                              liquidità            credito          mercato

        conoscenze            53%                        52%                        33%                       18%                   16%             10%

                            non ha un                            non legge l’informativa          si affida all’informal        investe anche se
                            piano finanziario                    finanziaria                      advice                        non comprende

        comportamenti          78%                                57%                               53%                         37%

                        Fonte: Consob, Rapporto sulle scelte di investimento delle famiglie italiane, 2017.

                     SAVINGS AND INVESTORS
                            lower financial                      impair decision              is not interested      feels unconfortable     not able to evaluate
                            market participation                 making                       in finance             with finance            her/his knowledge

                            gut feelings                         subjective
        attitudes
                             mistrust                           perceptions                     50%                   50%                    40%

                            inflation                  risk‐return                 diversification            liquidity            credit           market
                                                       relationship                                           risk                 risk             risk

        knowledge             53%                        52%                        33%                       18%                   16%             10%

                            does not have                        does not read                    relies on                     invests although she/he
                            a financial plan                     financial information            informal advice               does not understand

        behaviours             78%                                57%                               53%                         37%

                        Source: Consob, Report on financial investments of Italian households, 2017.

Milan, 11 June 2018                                                                                                                                                 11
Imprese             investitori
                         istituzionali

                      quotata digitale
                               monistico
                               controlli interni
                                       handbooks
                                            linee guida       azioni a voto
                                                              multiplo

                                                                              education

      Firms              institutional
                           investors

                         digitalisation
                            one-tier model
                                  internal controls
                                           handbooks
                                                 guidelines   multiple
                                                              voting shares

                                                                              education

Milan, 11 June 2018                                                                       12
Informazione
      non finanziaria

      Non financial
      information

Milan, 11 June 2018     13
FinTech e              trasparenza
                            nuovi prodotti            emittenti,

      Tutela risparmio             strumenti e
                                                    informazione
                                                      prodotti
                                                                     correttezza
                                       servizi                         condotte
      e investitori                  finanziari
                                                       tutela
                                                                     intermediari

                                                    risparmio e
                                                     investitori

                                                                    cyber security
                               Arbitro
                            controversie
                             finanziarie
                                                  educazione
                                                  finanziaria

                            FinTech and                 issuer
                            new products            transparency,

      Saving and investor           financial
                                                       product
                                                     information
                                                                      fairness of

      protection                  services and
                                    products
                                                                    intermediary
                                                                        conduct
                                                     saving and
                                                      investor
                                                     protection

                            alternative                             cyber security
                              dispute
                             resolution
                               (ACF)
                                                  financial
                                                  education

Milan, 11 June 2018                                                                  14
PMI        studenti
                                             formazione                                 fasce più
                                            dei formatori                              vulnerabili

      Educazione                Comitato
                                                                     seminari
                                                                  lezioni frontali associazioni
                                                                                          fasce di
                                                                                        consumatori
                                Nazionale                                                  vulnerabili

      finanziaria          OCSE,
                           IOSCO                                                        portale
                            (WIW)                                                     gamification

                        comportamenti
                           competenze
                             conoscenze
                                                       multidisciplinarietà
                      finanza comportamentale
                                                                          evidence‐based

                                                               SMEs    students
                                            training the                               vulnerable
                                              trainers                                  citizens

      Financial                  National
                                                                     seminars
                                                                  frontal lessons       consumers’
                                                                                             fasce
                                Committee                                               association
                                                                                           vulnerabili

      education            OECD,
                                                            training the
                                                              trainers                 web-portal
                           IOSCO
                            (WIW)                                                     gamification

                          behaviours
                           competencies
                             knowledge
                                                       multidisciplinarity
                        behavioural finance
                                                                                 evidence‐based

Milan, 11 June 2018                                                                                      15
Arbitro per le                                        116 soggetti
                                                            (92 banche)
                                                                                  625 decisioni
                                                                                  (431 a favore
      Controversie            30.000 €
                           rimborso medio
                                                                                 degli investitori)

                                                                                  @
                               erogato
      Finanziarie             54.000 €                                   … ottima è l’opportunità che
                           rimborso medio                                  la Consob ha dato ai risparmiatori
                              richiesto                                      istituendo l’ACF …
                                                               2.542
                                                               ricorsi            … grazie all’intervento positivo
                                                                                    dell’ACF è stata raggiunta
                                                                                     una conciliazione con
                                                                                          l’intermediario…

                       Dati dal 09/01/2017 al 31/05/2018.

      Alternative                                           116 subjects
                                                            (92 banks)
                                                                                  625 decisions
                                                                                  (431 in favour
      dispute                 30,000 €
                       average compensation
                                                                                   of investors)

                                                                                  @
                              received
      resolution             54,000 €                                      … Consob gave a great
                       average compensation                                 opportunity to investors
                             required                                         by establishing the ACF…
                                                               2,542
                                                             complaints              … thanks to ACF we came
                                                                                     to an agreement
                                                                                        with the intermediary …

                       Data from 09/01/2017 to 31/05/2018.

Milan, 11 June 2018                                                                                                  16
Attività
      internazionale

      International
      activity

Milan, 11 June 2018    17
analisi rischi
                                        quadro normativo nazionale e internazionale
                      e priorità                              approccio data‐driven
                                                       integrazione studi e vigilanza
      Vigilanza                                           Comitato di consultazione
                                             collaborazione con Banca d’Italia e altri

      proattiva       azioni              linee guida
                                          handbooks                        vigilanza
                                                                            ispezioni
                                                                contrasto abusivismo
                                                                             sanzioni

                      obiettivi                         sostegno all’accesso al mercato
                                                        tutela di risparmio e investitori
                                                              salvaguardia della fiducia
                                                                    integrità dei mercati

                       risk analysis
                                           national and international legal framework
                       and priorities                           data‐driven approach
                                                  studies and supervision integration
      Proactive                                               Stakeholder Committee
                                              cooperation with Bank of Italy & others

      supervision      actions              guidelines
                                            handbooks                    supervision
                                                                          inspections
                                                   contrast to unauthorised activities
                                                                            sanctions

                       goals                                  supporting market access
                                                         saving and investor protection
                                                                          fostering trust
                                                               financial market integrity

Milan, 11 June 2018                                                                         18
Ecosistema

                      CONSOB

      ecosystem       CONSOB

Milan, 11 June 2018            19
Consob Day 2018
         Discorso del Presidente
         Mario Nava

                                   Palazzo Carmagnola Consob Milano

         Consob Day 2018
         Speech by the Chairman
         Mario Nava

                                   Palazzo Carmagnola Consob Milan

Milan, 11 June 2018                                                   20
Puoi anche leggere