2017 CSR RepTrak Webinar - How to use data to connect CSR and Reputation and be relevant for the business
←
→
Trascrizione del contenuto della pagina
Se il tuo browser non visualizza correttamente la pagina, ti preghiamo di leggere il contenuto della pagina quaggiù
2017 CSR RepTrak® Webinar
                                How to use data to connect CSR and Reputation and be relevant for the business

Fabio Ventoruzzo
                                                                                                    23 Novembre 2017
Director Reputation Institute                                                                                          1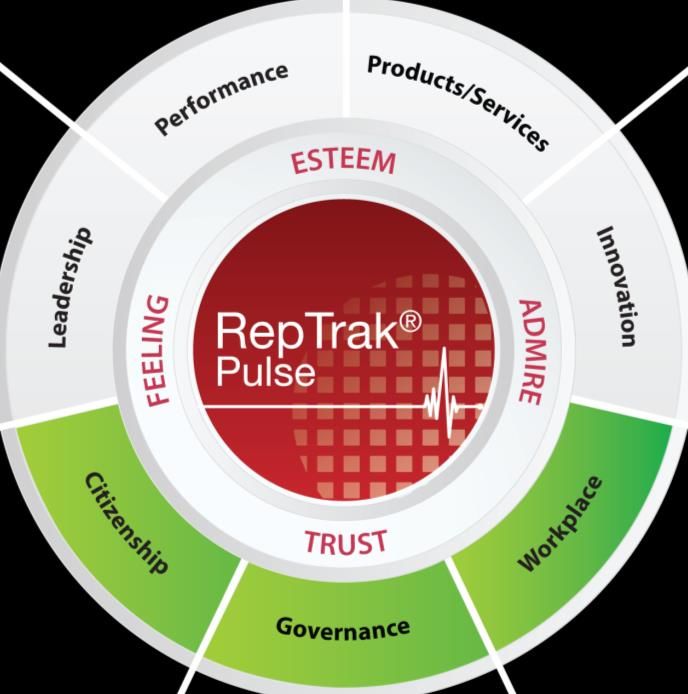
Reputation Institute da +20 anni è leader nella misurazione e gestione della reputazione aziendale

                                                                                                 We enable leaders to make business decisions that build and
                                                                                                  protect reputation capital and drive competitive advantage
          «We own the science
            of Reputation»
              Reputation Institute è la società leader mondiale
                                                                                 11 Years of Data Indexed
              nella ricerca e consulenza specializzata in corporate
              reputation management, fondata dal Dott. Charles                              40 Countries
              Fombrun e dal Dott. Cees Van Riel nel 1997.
                                                                                            25 Industries                                    c

              Reputation Institute è l’ideatore della metodologia
              RepTrak® per la misurazione della reputazione e
              realizza ogni anno il Global RepTrak® 100 - il più
                                                                                          7,000 Companies
              importante studio annuale sulla reputazione delle
              top 100 aziende nel mondo
                                                                                       15+ Stakeholder Groups
                  •   7 dimensioni di reputazione
                  •   10 anni di storico dati
                  •   40 Paesi misurati                               Membership                    Measurement                           Consulting
                  •   15 Gruppi di stakeholder
                  •   7.000 aziende misurate/anno                     Reputation workshop            From data to insight           Reputation building
                  •   8+M valutazioni/anno                            Best practice sharing            Multi-country db           Reputation protection
                                                                      RepTrak® database access       Multi-stakeholder db            Strategic planning

                                                                                                                                                           2
Oggi quasi il 90% del valore di un’azienda è costituito da asset intangibili

                                                   Components of S&P 500 Market Value
             100%
                           83%         68%              32%                20%                 19%    13%

                                                                                                      87%
               80%
                                                                           80%                 81%

                                                        68%
               60%

               40%

                                       32%
               20%
                           17%

                0%
                           1975        1985             1995               2005                2009   2015

                                                     Tangible Assets       Intangible Assets

 Source: OCEAN TOMO, LLC                                                                                     3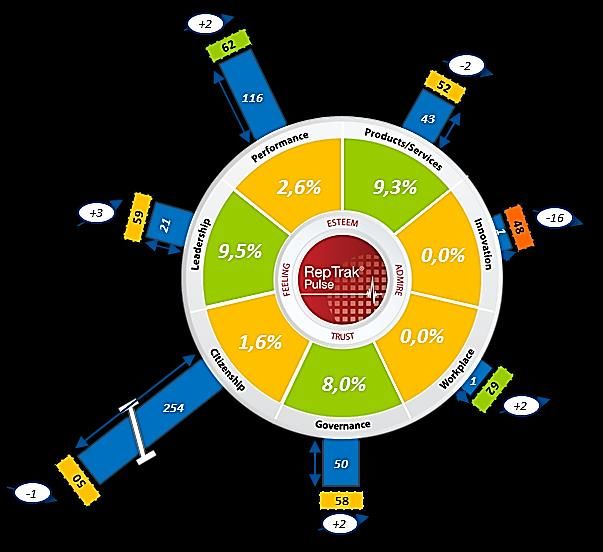
Agenda

   •     Perché misurare e gestire la Reputazione

   •     Come sta cambiando la CSR: «the new normal»

   •     La Corporate Social Responsibility come driver di business
          – Key learnings
          – Evidenza Italia

   •     Il business case della CSR
          – Lavorare sul coinvolgimento per costruire equity reputazionale
          – Come far leva sui contenuti
          – Come utilizzare i canali

                                                                             4
La reputazione è un “hot-topic” per le aziende

  Successo e sostenibilità dell’azienda dipendono dalla convinzione dei suoi stakeholder a sostenerla

                 La Reputazione è un legame emotivo…                                            …che garantisce che

                                                                                                    •      i consumatori acquistino i prodotti

                                                                                                    •      istituzioni e regolatori concedano il permesso di operare

                                                                                                    •      la comunità finanziaria investa

                                                                                                    •      i media siano favorevoli

                                                                                                    •      le risorse umane siano allineate alla strategia aziendale

RepTrak® is a registered trademark of Reputation Institute. Copyright © 2017 Reputation Institute. All rights reserved.                                                5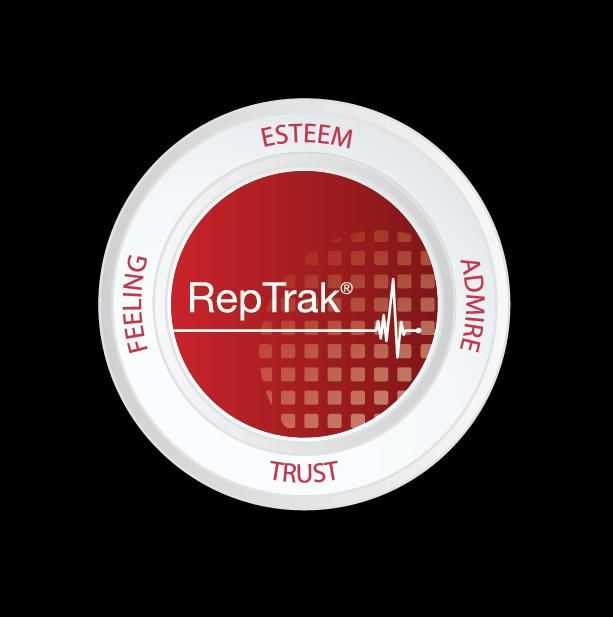
La reputazione influenza le scelte di consumatori e stakeholder

                                                                         Scarsa   Debole   Moderata   Forte   Eccellente
                 RepTrak® Pulse Score                                     0-39     40-59    60-69     70-79      80+

                         Comprare                                         9%       16%       34%      55%       83%

                         Parlare positivamente                            8%       13%       29%      50%       82%

                         Raccomandare i prodotti                          8%       13%       30%      50%       82%

                         Fidarsi della capacità di fare la cosa giusta    8%       12%       26%      44%       77%

                         Dare il beneficio del dubbio                     7%       12%       27%      43%       71%

                         Dare il benvenuto nella Comunità                 9%       14%       29%      47%       78%

                         Lavorare per                                    11%       17%       31%      48%       73%

                         Investire                                        8%       11%       23%      38%       67%

                                                                                                                           6
Source: Reputation Institute – RepTrak® global database 1997-2017
I risultati di una reputazione forte sono evidenti

    1                                                                3
                    Correlation between Reputation and Stock Price       Correlation between Reputation and Post-crises recovery

    2                                                                4
                       Correlation between Reputation and EBITDA           Correlation between Reputation and Financial KPIs

                                                                                                                                   7
Fonte: Reputation Institute Database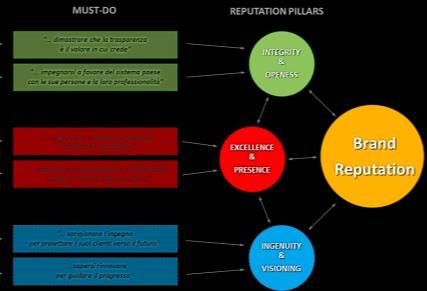
Come funziona il modello RepTrak®: la nostra “Reputation Value Equation”

                                                      How Reputation is formed
                                                       (DESCRIPTIVE INSIGHTS)

          Communication channels         Stakeholder’s perception      Stakeholder’s behaviors + Business deliverables
         (INPUT FOR REPUTATION)               (REPUTATION)                      (OUTPUTS OF REPUTATION)

                   Consumer Experience                                                                        Churn
                                                                        Buy/Subscribe
                                                                                                               Sales
                                                                         Recommend
                           Paid Media                                                                Customer share of wallet
                                                                        Benefit of doubt
                                                                                                      Cost of crisis recovery
                                                                       Licence to operate
                         Owned Media
                                                                                                           Market Cap
                                                                           Work for
                                                                                                     Cost of talent acquisition
                         Earned Media
                                                                             Invest
                                                                                                      Customer satisfaction

                                                    How we manage Reputation
                                                     (PRESCRIPTIVE MODELS)
                                                                                                                                  8
Agenda

   •     Perché misurare e gestire la Reputazione

   •     Come sta cambiando la CSR: «the new normal»

   •     La Corporate Social Responsibility come driver di business
          – Key learnings
          – Evidenza Italia

   •     Il business case della CSR
          – Lavorare sul coinvolgimento per costruire equity reputazionale
          – Come far leva sui contenuti
          – Come utilizzare i canali

                                                                             9
La reputazione si basa su ciò che fa/racconta l’azienda;
Il CSR Index è la percezione degli italiani rispetto al ruolo sociale dell’azienda

                 • Agisce in maniera responsabile per                                          • Offre pari opportunità sul posto di lavoro
                   proteggere l'ambiente                                                       • Ricompensa i suoi dipendenti in maniera
                 • Influisce positivamente sulla società                                         adeguata
                 • Supporta le giuste cause                                                    • Si preoccupa della salute e del benessere
                                                                                                 dei suoi dipendenti

                                                           • Opera in modo equo
                                                           • Si comporta eticamente
                                                           • É aperta e trasparente sul modo
                                                             in cui opera

                                                                      CSR
                                                                      Index

                                                                                                                                              10
“Companies with their eye on their
'triple-bottom-line' outperform their less
fastidious peers on the stock market.”
11Oggi ‘chi sei’ conta sempre più di ‘cosa vendi’
Prodotto/Servizio
40% AZIENDA
60%
LEGITIMACY
Fonte: Reputation Institute - Italy RepTrak® 2017
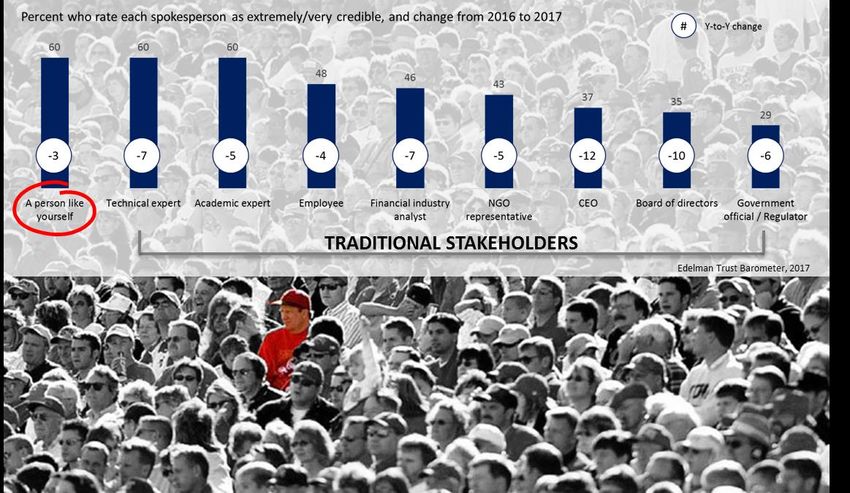
12La crisi di fiducia nelle autorità spinge i consumatori a chiedere alle aziende di esporsi
A person like you is now the most credible Consumers want brands to address
spokesperson: general public is a key-stakeholder community issues
Le aziende leader devo allineare strategia e azioni con gli interessi e I valori della società
L’ascolto del general public e l’integrazione tra corporate e social purpose diventano fondamentali
13Nella società della personalizzazione (iper-modernità) le aziende si coinvolgono di più su temi
socialmente rilevanti
INVOLVEMENT COMMITMENT ENGAGEMENT
European Communication Monitor, 2017 - Rivisitazione Reputation Institute
14Alle aziende è chiesto di prendere posizioni, con coraggio e autenticità, per costruire un legame valoriale
+
Fair Sincere Intelligent Genuine
Exciting
Media impatto sulla
reputazione +4,2pt
Courageous Imaginative Charming
Straightforward Friendly Tech-savvy
Environmentally-
Progressive Hard-working Spirited Daring
Conscious
Impatto sulla reputazione
Flexible Confident
Caring
Down-to-earth Worldly
Aggressive Traditional
0
Greedy
Arrogant
Lazy
-
- Reach Tratti 32,6% +
15
Fonte: Reputation Institute - Italy RepTrak® 2017Agenda
• Perché misurare e gestire la Reputazione
• Come sta cambiando la CSR: «the new normal»
• La Corporate Social Responsibility come driver di business
– Key learnings
– Evidenza Italia
• Il business case della CSR
– Lavorare sul coinvolgimento per costruire equity reputazionale
– Come far leva sui contenuti
– Come utilizzare i canali
16Learning #1
La reputazione delle Aziende influenza ed è influenzata dalla percezione rispetto al suo ruolo sociale
72,2
Global Rankings for Reputation and CSR
CSR
Index
RepTrak® CSR
Rank Settore Rank Settore
Pulse Index
1 Rolex 80,4 1 LEGO Group 74,4
2 LEGO Group 79,5 2 Microsoft 74,1
3 The Walt Disney Company 79,2 3 Google 73,9
4 Canon 78,3 4 The Walt Disney Company 73,5
5 Google 78,2 5 BMW Group 71,5
6 Robert Bosch 78,1 6 Intel 71,1
7 Sony 77,7 7 Robert Bosch 71,0
8 Intel 77,7 8 Cisco Systems 71,0
9 Rolls-Royce Aerospace 77,7 9 Rolls-Royce Aerospace 70,7
10 Adidas 77,3 10 Novo Nordisk 70,6
17
Fonte: Reputation Institute – Italy RepTrak® Pulse 2013, 2014, 2015, 2016, 2017Learning #2
Anche la percezione della CSR delle aziende – come la loro reputazione – è «local for local»
Country CSR Index 2017 Ranking
72,9
Top 3 Countries
70,7 68,5
1° US 75,1 Russia
67,0 75,1 UK
2° Australia 73,3 Germany 55,2
Canada France
3° Russia 72,9 Japan
Italy
US 64,6 S. Korea
Spain
Italy 68,1
* 68,1
8°
China 63,2
Mexico 68,9 65,5
India 62,1
Worst 3 Countries
68,3
13° Japan 63,2
Brazil 68,0
14° China 62,1
15° South Korea 55,2
Australia
73,3
* 68.1 - dato calcolato sulla media delle aree di CSR delle top 100 aziende misurate globalmente nello studio “2017 Global Reptrak® 100” 18
Source: Reputation Institute – Global RepTrak® Pulse 2017Learning #3
LA CSR è rilevante per il business perché influenza le scelte di consumatori e stakeholder
100,0%
BUY
90,0%
WORK FOR
BENEFIT OF DOUBT
80,0%
70,0%
60,0%
50,0%
40,0%
30,0%
20,0%
10,0%
0,0%
Scarsa Debole Moderata Forte Eccellente
CSR Index* 0-39 40-59 60-69 70-79 80+
19
Fonte: Reputation Institute - Italy RepTrak® 2017In Italia, negli anni il divario tra reputazione e CSR è in crescita
Media +6,3%
Italia
70,8
69,6
Reputazione
67,4 66,9
66,6 66,6 Δ 5,3
Δ 2,0
65,4 65,5
64,6 64,0 63,8
62,6
CSR Index
+1,2%
2012 2013 2014 2015 2016 2017
20
Fonte: Reputation Institute - Italy RepTrak® 2012-2017Gli italiani sono più critici rispetto alle performance delle aziende sui temi della CSR
Italian Sector Ranking for CSR
Performance Italia 2017
Rank Settore CSR Index
+1,3
1 Pharmaceutical 69,9
+2,5
2 Retail – Online 69,3
3 FMCG - Food 68,4
70,6 70,4 4 Electrical & Electronics 68,4
5 FMCG - Home & Personal Care 68,3
+2,3 +1,2
6 FMCG – Beverage 68,1
70,2 68,6 7 Automotive 67,3
8 Luxury Products 66,7
9 Financial - Diversified 66,7
64,5 66,8 11 Entertainment - Media 66,5
12 Industrial 66,5
+1,2 65,2 -0,4
13 Streetwear 65,5
14 Turism 65,4
15 Logistic 64,7
-0,7
16 Retail - Brick&Mortar 64,7
17 Financial - Insurance 62,3
18 Football 58,9
19 Energy & Utilities 58,2
65,5 20 Telco 58,0
+0,1 21 Financial - Bank 57,6
- X,X Delta vs 2016
22 Entertainment - Gambling 53,4
21
Fonte: Reputation Institute - Italy RepTrak® 2017Le aspettative sulla CSR sono trasversali in tutti i settori
Contenuti Prioritari
Italia 2017 Lusso Banking
Automotive Pharma Energy
3 1 1 1 1 1
13,7% 21,8% 12,6% 21,6% 13,2% 17,4% 10,7% 19,1% 13,2% 22,0%
Corporate Product
13,0% 11,5% 14,5% 13,6% 13,2% 12,0% 10,8% 11,6% 12,5% 12,0%
25,3% 33,7% 2
12,8% 12,2% 13,0% 10,8% 15,5% 12,9% 17,6% 12,6% 13,2% 9,9%
15,0% 13,8% 15,8% 17,7% 17,3%
1 3 3 3
12,3% 21,3% 2 3 2 2 2
Social Role Social Role Social Role Social Role Social Role
40,0% 37,6% 44,2% 47,9% 40,4%
13,0% 12,4%
3 14,4% 11,4%
Electronics Insurance Gaming Industrial Food & Beverage
15,2%
3 1 3 1 1
13,0% 22,7% 1 14,6% 18,3% 11,0% 18,7% 11,6% 18,7% 11,0% 23,7%
2
13,2% 13,3% 12,2% 12,3% 11,4% 10,3% 13,5% 14,6% 12,7% 10,5%
Social Role 3
41,0% 12,0% 12,0% 16,1% 12,0% 20,0% 9,4% 15,3% 11,7% 14,0% 12,0%
13,7% 14,5% 19,3% 14,7% 16,1%
2 1 2 3
2 2 3 2
Social Role Social Role Social Role Social Role Social Role
37,7% 42,6% 48,7% 41,7% 42,1%
22
Fonte: Reputation Institute - Italy RepTrak® 2017Agenda
• Perché misurare e gestire la Reputazione
• Come sta cambiando la CSR: «the new normal»
• La Corporate Social Responsibility come driver di business
– Key learnings
– Evidenza Italia
• Il business case della CSR
– Lavorare sul coinvolgimento per costruire equity reputazionale
– Come far leva sui contenuti
– Come utilizzare i canali
23Lavorare sulla «familiarità» per intensificare l’engagement con il consumatore attraverso la CSR
Familiarità Familiarità x CSR CSR e Reputazione Business Impact
Conoscere il livello di Awareness Il gap di CSR Index tra chi ha Migliorare il livello di familiarità ...che a sua volta impatta sulla
è solo il punto di partenza. uno scarso livello di conoscenza provoca un aumento diretto performance di business aumentando
Per costruire Equity Reputazionale dell’azienda (60,3) e chi ha un di +2,9pti di CSR Index che corrispondono la propensione all’acquisto (+5,2 pti),
è fondamentale indagare i livelli di engagement eccellente (72,2) è +12 pti a +3,5pti di Reputazione… il passaparola positivo (+4,9 pti) e
Familiarità degli stakeholder vs azienda il beneficio del dubbio (+5,2 pti)
+11,9pti +2,9pti di CSR Index generano +5,2%
Eccellente +3,5pti di Reputazione
16,2% BUY
72,2
Buona
10,3% +2,9pt
Reputazione (RepTrak® Pulse)
Corr.ne: 0,81
Aware
62,1% Sufficiente
20,7% 67,2
68,4 +4,9%
CSR Index
Scarsa
RACCOMANDARE
14,9% 63,8 65,5 L’AZIENDA
Corr.ne: 0,83
Not Aware Not Aware
37,9% 37,9% 60,3
Not Aware
37,9% +5,2%
Awareness Familiarità Scarsa Sufficiente Buona Eccellente Oggi +1pt familiarità BENEFICIO
DEL DUBBIO
Familiarità
Corr.ne: 0,69
24
Fonte: Reputation Institute - Italy RepTrak® 2017Gli italiani sono sempre più incerti rispetto alla CSR delle aziende
% persone “incerte” nel valutare l’operato delle aziende
70,6 70,4
Gli Italiani come
valutano le aziende
nelle aree di Corporate
Social Responsibility? 70,2 68,6
54,4% 51,6%
CSR Index
64,5 66,8
65,5
56,1% 54,2% 65,2
65,5% 70,9%
Quali sono le 1
64,0% dimensioni più 12,3% 21,3%
importanti per gli
italiani nel 2017?
13,0% 12,4%
Social Role Social Role
Uncertainty Relevance
3 14,4% 11,4%
avg. 66,8% 41%
15,2%
2
25
Fonte: Reputation Institute - Italy RepTrak® 20172 strategie su cui basarsi per migliorare il coinvolgimento dello stakeholder e impattare il business
La base per creare Equity Reputazionale oggi Le 2 opzioni strategiche
+
+11,9pti Situazione ideale
Strategia di canale
72,2
Content Performance
67,2
CSR Index
63,8
60,3
Scarsa Sufficiente Buona Eccellente Fai leva su entrambi Strategia di contenuto
-
Familiarità - Touchpoint Performance +
26
Fonte: Reputation Institute – Italy RepTrak® Pulse 20171) Strategia di contenuto – Comunicate i contenuti/messaggi rilevanti per il General Public
facendo leva su i messaggi che vi contraddistinguono
+ Reagisci! Offers high quality products and Elementi focus Imp.
Fai leva! Fai leva! Score
160 services
Stands behind its products and
P&S Offers high quality products and services 156 71.8
services P&S Stands behind its products and services 145 70.2
P&S Meets customer needs 136 72.0
Offers products and services that L Is a well organized company 106 72.6
are a good value for the money Meets customer needs
Has a positive influence on
society Elementi focus Imp.
Reagisci! Score
P&S Value for the money 129 67.6
Is open and transparent about
Media importanza*
Behaves ethically the way the company operates Is a well organized company C Has a positive influence on society 124 66.4
contenuti 100
G Is open and transparent 110 65.7
G Behaves ethically 106 64.9
Is fair in the way it does business
Acts responsibly to protect the
environment Is an innovative company Shows strong prospects for
Is generally the first company to go to
future growth
Supports good causes market with new products and services
Has a strong and appealing Has a clear vision for its future
Delivers financial results that are
leader
Demonstrates concern for the better than expected
Has excellent managers Is a profitable company
health and well-being of its Rewards its employees fairly
50 employees Offers equal opportunities in the Adapts quickly to change
Monitora! workplace Push!
-
- 60,0 Performance Aree reputazione 75,0 +
68,3
Prod & Serv Innovation Workplace Governance Citizenship Leadership Performance
Source: National Pulse 2017, Italy
27
* L’importanza dei singoli attributi è determinata attraverso una analisi di regressione sul Pulse Score
Fonte: Reputation Institute - Italy RepTrak® 20172) Strategia di Canale – la CSR viene fatta raccontare…
Reach
Consumer experience 39,1%
Impatto
+7,1 pt.
IMPATTO SUL
• Servizio assistenza clienti CSR INDEX
• Acquisto prodotto
Reach Consumer
Owned 24,2% Experience
Impatto Owned
• Sito web +6,7 pt.
• Annual report +7,1pts
•
•
Comunicato stampa
Email dall’azienda
+6,7 pts
• Post su social media dell’azienda
Reach Paid
Paid 33,1% Earned
Impatto
• Pubblicità su social media +4,1 pt. +4,1pts
• Pubblicità su media tradizionali
• Evento o team sponsorizzato dall’azienda
+3,8pts
• Programma o evento sponsorizzato
dall’azienda a cui ho partecipato
Reach
Earned 48,4%
Impatto
+3,8 pt.
• Parenti, amici o colleghi
• Post di altre persone sui social media su
• Experti, siti internet, blog
• Media tradizionali
REACH %
24,2% 33,1% 39,1% 48,4%
28
Fonte: Reputation Institute - Italy RepTrak® 2017…alcuni canali di comunicazione hanno un potenziale inespresso
Reach
Consumer experience 39,1%
Impatto IMPATTO SUL
• Servizio assistenza clienti
+7,1 pt.
CSR INDEX
Owned
• Acquisto prodotto
Annual
Report Website
Reach Consumer
Owned 24,2% Experience
Impatto
• Sito web +6,7 pt. Press Release
• Annual report +7,1pts Newsletter
•
•
Comunicato stampa
Email dall’azienda
+6,7 pts
• Post su social media dell’azienda Social Media
Posting
Reach Paid
Paid 33,1% Earned
Impatto
• Pubblicità su social media +4,1 pt. +4,1pts
• Pubblicità su media tradizionali
• Evento o team sponsorizzato dall’azienda
+3,8pts
• Programma o evento sponsorizzato
dall’azienda a cui ho partecipato
Reach
Earned 48,4%
Impatto
+3,8 pt.
• Parenti, amici o colleghi
• Post di altre persone sui social media su
• Experti, siti internet, blog
• Media tradizionali
REACH %
24,2% 33,1% 39,1% 48,4%
29
Fonte: Reputation Institute - Italy RepTrak® 2017Alert – Quando si verifica una crisi/issue l’area più sensibile è il ruolo Ruolo Sociale dell’azienda
Financial
malpractice
Le dimensioni della reputazione maggiormente colpite
Product -11.5 -10.4
Defect
Arranging private gifts and
making financial donations to Performance Product
influential politicians
-16.1% -13.7%
Fraud
Experiencing significant quality
issues with its main product -15.9% -13.8%
-11.2 -9.4
Accounting malpractice of
the financial statements
-16.3% -13.6%
Environment
Staff -16.3% -15.9%
Turnover
-11.3 -10.6
Damaging the
environment
Transparency -17.0%
Large reduction in staff due
to financial difficulties.
Lack of openness and honesty about
Social Role
structures and operations -11.1
-16.4%
30
Fonte: Reputation Institute - Italy RepTrak® 2017Partire dall’intelligence reputazionale per rafforzare il posizionamento CSR delle aziende
Prioritize key contents Select the most effective
to be embedded in touchpoints to maximize Strengthen Corporate
Draw up an action plan to
Company Corporate storytelling the impact of narrative
define Reputation initiatives,
Company media mix by leveraging
timing and owners
Reputation data
CONTINUOUS MEASUREMENT
ASSESS AND TRACK
COMPANY REPUTATION PROFILE
ON A MONTHLY BASIS
Integrate Analyze sentiment, topics
Set Reputation targets Evaluate the RORA
Reputation metrics and tone of voice of
and goals (Return of Company
with Company internal KPIs Earned media
for the years forward Reputation Activities)
31Grazie
Contattaci per comprendere:
• Le aspettative degli italiani rispetto alla tua azienda
• Come lavorare sulla CSR della tua azienda per migliorare il coinvolgimento dei tuoi stakeholder
• Come usare i tuoi dati per integrare la CSR nella strategia di business e rafforzare la tua corporate purpose
• Quali sono i contenuti e canali di comunicazione da usare per rafforzare la percezione del tuo ruolo sociale
I nostri riferimenti:
www.reputationinstitute.com
Reputation Institute Italy
fferrucci@reputationinstitute.com
+39 02 84 25 31 69
32Puoi anche leggere