RAPPORTO SUL MERCATO DELLE AUTOLINEE A LUNGA PERCORRENZA IN ITALIA | SINTESI SEMESTRE I - 2018 ITALIAN LONG-DISTANCE COACH TRANSPORT MARKET REPORT ...
←
→
Trascrizione del contenuto della pagina
Se il tuo browser non visualizza correttamente la pagina, ti preghiamo di leggere il contenuto della pagina quaggiù

TRASPOL report 2/18
RAPPORTO SUL MERCATO DELLE AUTOLINEE A LUNGA
PERCORRENZA IN ITALIA | SINTESI SEMESTRE I - 2018
ITALIAN LONG-DISTANCE COACH TRANSPORT MARKET
REPORT | SUMMARY SEMESTER I - 2018

                             In collaboration with: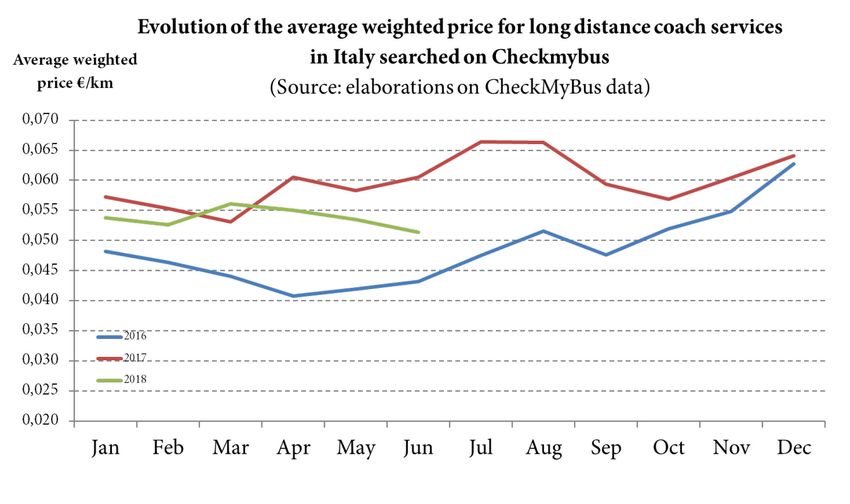
IL MERCATO DELLE AUTOLINEE A LUNGA PERCORRENZA IN ITALIA (Italian long-distance
coach transport market report)
Sintesi primo semestre 2018 / Summary first semester 2018

Autori: Paolo Beria, Samuel Tolentino

Il presente rapporto viene pubblicato periodicamente in collaborazione con Checkmybus.it, sulla base dei dati
raccolti sulla piattaforma. La collaborazione rientra nelle attività del progetto QUAINT (MIUR rif.:
RBSI14JR1Z), di cui il prof. Paolo Beria è titolare.
The report is published in collaboration with Checkmybus.it based on the data available on Checkmybus.it website. This
partnership is part of the activities foreseen in the project QUAINT (MIUR rif.: RBSI14JR1Z) under the scientific
responsibility of prof. Paolo Beria.

Please quote as follows:
 Beria P., Tolentino S. (2018). Rapporto sul Mercato delle Autolinee a Lunga Percorrenza in Italia / Sintesi
 semestre I - 2018. TRASPOL Report 2/18 & Checkmybus. Milano, Italy.

Photo by Scott Webb on Unsplash

TRASPOL – Laboratorio di Politica dei Trasporti
Dipartimento di Architettura e Studi Urbani, Politecnico di Milano
Via Bonardi 3, 20133, Milano, Italy.
www.traspol.polimi.it
SOMMARIO

1   Introduzione | Introduction .................................................................................................................................... 4

2   Nota alla versione | Release note ............................................................................................................................ 5

3   Sintesi | Key figures .................................................................................................................................................. 7
4   Metodologia | Methodology .................................................................................................................................... 8

                                        TRASPOL – Politecnico di Milano ||| Checkmybus.it
                                                                                                                                                                            3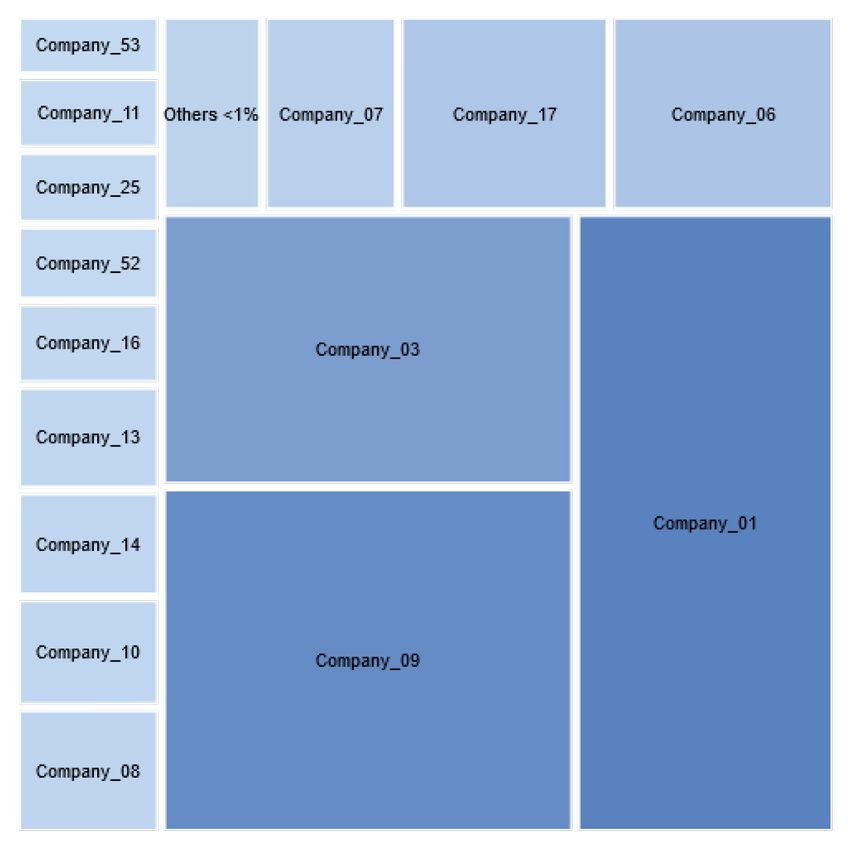
1 INTRODUZIONE | I NTRODUCTION
Questo rapporto, preparato in collaborazione con Checkmybus.it, è la quinta uscita di una serie di studi
semestrali sull’andamento del mercato degli autobus di lunga percorrenza in Italia. Il rapporto è dedicato
al monitoraggio dell’evoluzione del settore fino al primo semestre 2018 con un particolare focus sui prezzi.
Il rapporto è disponibile gratuitamente su www.traspol.polimi.it e su www.checkmybus.it ed è basato sul
campione di dati raccolti dalla piattaforma di vendita Checkmybus.it da gennaio 2016 a giugno 2018. Grazie a
questa base dati è possibile studiare il profilo degli utenti delle autolinee e della piattaforma, i prezzi praticati,
il livello di concentrazione del mercato, le rotte principali.
Tutte le specifiche metodologiche sono raccolte nell’ultimo capitolo.
Approfondimenti / Further material
Per approfondire il settore prima e dopo la liberalizzazione, è possibile scaricare e consultare i seguenti rapporti ed
articoli:
2011. STUDIO SUL SERVIZIO AUTOBUS DI LUNGA PERCORRENZA IN ITALIA
Beria P., Grimaldi R., Laurino A. (2013). Long distance coach transport in Italy. State of the art and perspectives.
2013. IL TRASPORTO PASSEGGERI SU AUTOBUS PER LE LUNGHE DISTANZE. CONFRONTO
MODALE, ANALISI SPAZIALE E SCENARI DI SVILUPPO
Beria, P. et al. (2014). Spatial and scenario analyses of long distance coach transport in Italy
2015. AUTOLINEE STATALI: GLI EFFETTI DELLA RIFORMA. RISULTATI, OPPORTUNITÀ E
CRITICITÀ DELL’APERTURA DEL MERCATO
Beria P., Laurino A., Bertolin A., Grimaldi R. (2015). Long distance coach services: the effects of the reform. Results,
opportunities and critical aspects following the opening of the market.
2015-2017. RAPPORTO SUL MERCATO DELLE AUTOLINEE A LUNGA PERCORRENZA IN ITALIA
Beria P., Laurino A. (2016). Italian Long-Distance Coach Transport Market. Report I° semester 2016.
Beria P., Nistri D., Laurino A. (2017). Italian Long-Distance Coach Transport Market. Report full year 2016.
Beria P., Nistri D. (2017). Italian Long-Distance Coach Transport Market. Report I° semester 2017.
Beria P., Nistri D. (2018). Italian Long-Distance Coach Transport Market. Report full year 2017.
2017. INTERCITY COACH LIBERALISATION. THE CASES OF GERMANY AND ITALY
Grimaldi R., Augustin K., Beria P. (2017). Intercity coach liberalisation. The cases of Germany and Italy.
Transportation Research Procedia, 25, 474-490.
2018. INTERCITY COACH LIBERALISATION IN ITALY: FARES DETERMINANTS
Beria P., Nistri D., Laurino A. (2018). Intercity coach liberalisation in Italy: Fares determinants in an evolving market,
Research in Transportation Economics, in press
This report, prepared in collaboration with Checkmybus.it, is the fifth of a biannual series of studies on the long-
distance coach market trends in Italy. The current issue summarizes the first semester 2018 data and trends, through
which it is possible to describe the evolution of what is becoming a relatively liberalized mature market.
The report is aimed at being a useful tool to monitor the evolution of the market, both for the companies and the public
regulator.
The report is available for free at www.traspol.polimi.it and www.checkmybus.it. It is based on a sample of data collected
by the Checkmybus.it platform. Thanks to this database, it is possible to study the profile of platform users, the prices,
the level of market concentration, the main routes.
All methodological specifications are given in the last section.
TRASPOL – Politecnico di Milano ||| Checkmybus.it
4
2 NOTA ALLA VERSIONE | RELEASE NOTE

Abbiamo osservato nel corso dei precedenti rapporti come il semestre estivo di ciascuno dei due anni analizzati
presentasse un prezzo medio maggiore rispetto al corrispondente semestre invernale, rendendo più utile
comparare gli indicatori con il semestre omologo dell’anno precedente. La piattaforma CheckMyBus nel primo
semestre del 2018 ha iniziato a registrare il numero di posti per biglietto ricercati dagli utenti, aggiungendo
questo dato a quelli disponibili per la stesura del rapporto. Per poter utilizzare questo dato mantenendo la
comparabilità con i risultati degli anni precedenti è necessario calcolare un fattore di conversione di “posti medi
per prenotazione” su ciascuna rotta, che potrebbe però variare in base al semestre considerato (invernale od
estivo). Allo stato attuale non è quindi ancora possibile utilizzare questo nuovo dato.
Rispetto al primo rapporto pubblicato nel 2016 la base dati si è espansa notevolmente, con un numero di record
relativi alle tratte nazionali che è quasi triplicato nel primo semestre 2018 rispetto al primo semestre del 2016. Il
filtro utilizzato per le elaborazioni precedenti, finalizzato a diminuire la variabilità dei dati escludendo le rotte
meno costantemente rappresentate (in entrambe le versioni di filtro sul numero di biglietti mensile e/o
semestrale), risulta escludere a questo punto una quota consistente di dati che, se considerati raccolti in modo
casuale (ipotizzando che CheckMyBus abbia ormai penetrato adeguatamente il mercato, come suggerito dalla
crescita nel numero di utenti e di rotte raccolte), può entrare a far parte del campione arricchendo le analisi
anche dei contributi delle rotte meno rappresentate.

Per questi motivi, stiamo conducendo una revisione della metodologia e delle elaborazioni che confluiranno nel
prossimo rapporto, che sarà presentato completo dei dati dell’intero 2018. Le pubblicazioni dei rapporti
completi seguiranno una cadenza annuale. In questo rapporto si trova invece una sintesi dei dati relativi al
primo semestre 2018, trattati con la metodologia utilizzata fino ad oggi.

Errata corrige - Indice dei prezzi
Per il report corrente sono stati calcolati nuovamente tutti i valori dei prezzi al km sia per il nuovo semestre che
per quelli precedenti, in quanto nella loro elaborazione era stato commesso un errore materiale nel trattamento
dei dati (dovuto a problemi di troncamento) che ha portato ad una generalizzata sottostima dei prezzi al km
dell’ordine del 8-9%. Il grafico pubblicato è emendato dell’errore in questione.

                             TRASPOL – Politecnico di Milano ||| Checkmybus.it
                                                                                                                   5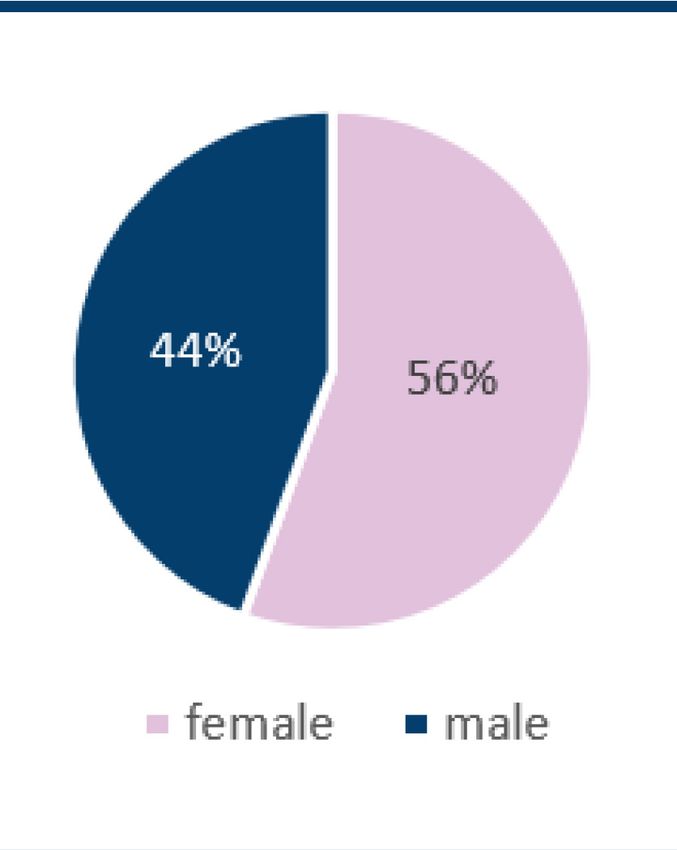
In the previous reports we have observed how the summer semester of each of the two analyzed years had a higher average
price compared to the corresponding winter semester, making it more useful to compare the indicators with the same
semester of the previous year. CheckMyBus platform in the first half of 2018 began to record the number of searched seats
by each user, along with the number of searches (or, more properly, of click-outs), adding this data to those available for
the preparation of the report. To be able to use this data, maintaining the comparability with the results of previous years,
it is necessary to calculate a conversion factor of “average seats per booking” on each route, which could however vary
according to the considered semester (winter or summer). Currently, it is therefore not yet possible to use this new kind of
data.
Since the first report published in 2016, the database has expanded considerably, with the total of records relating to
national routes that almost tripled in the first half of 2018 (compared to the first half of 2016). The filter used for the
previous calculations to reduce the variability of data, excluding the less consistently represented routes (in both filter
versions on the number of monthly and / or semi-annual tickets), at this point may lead to neglect a fairly large amount of
data that, if considered collected in a random way (assuming that CheckMyBus has now adequately penetrated the market,
as suggested by the growth in the number of users and routes), may become part of the sample enriching the analysis with
the contributions of the less represented routes.

For these reasons, we are conducting a review of methodology and elaborations that will affect the next Report, which is
going to be presented complete with data for the entire 2018. The publications of the complete reports will then follow
annually. In this report there is instead a summary of the data for the first half of 2018, processed with the methodology
used to produce the previous reports.

Errata corrigenda - Price index
The price per km has been recalculated both for the current semester and the previous ones, as we noticed we made a factual
error (due to truncating issues) in its calculation that led to a generalized underestimation of the price per km about 8-9%
of the correct value. The published graph is consequently amended.

                                TRASPOL – Politecnico di Milano ||| Checkmybus.it
                                                                                                                           6
3 SINTESI | KEY FIGURES
Indice dei Prezzi | Price Index
Variazione media pesata / Average
Weighted Price Change
-16%
Rispetto al semestre precedente /
With respect to the previous semester
-6%
Rispetto allo stesso semestre dell’anno
precedente /With respect to the same
semester in the previous year
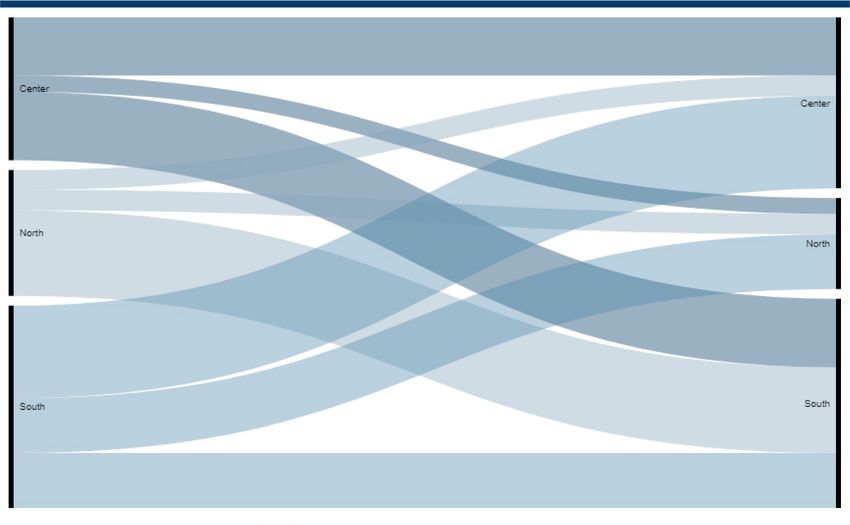
Profilo degli utente tipo Viaggi ricercati per origine e destinazione
User profile Researched tickets per origins and destinations
Top 10 città origine e destinazione Share compagnia
Top10 cities origins and destinations Sample Company Share
Rank Top Domestic origins Top domestic destinations
1° Roma Roma
2° Milano Milano
3° Napoli Napoli
4° Bologna Torino
5° Bari Taranto
6° Torino Catania
7° Taranto Bari
8° Catania Bologna
9° Firenze Messina
10° Lecce Firenze
TRASPOL – Politecnico di Milano ||| Checkmybus.it
74 METODOLOGIA | METHODOLOGY
Le elaborazioni presentate in questo documento sono state The elaborations presented in this document have
sviluppate a partire dal database mensile fornito da been developed starting from the monthly database
Checkmybus.it. Il dato si riferisce ai “click” (biglietti provided by Checkmybus.it. The data refer to the
“clicks” (researched tickets) made on the website
ricercati) effettuati sul motore di ricerca Checkmybus.it
Checkmybus.it every month, which are then
ogni mese e reindirizzati verso i siti dei singoli operatori che
redirected towards the website of the single
forniscono il servizio. Nel dettaglio il database contiene, per
operators serving the route. In detail, the database
ciascun mese: includes:
- Località di origine e di destinazione - Place of origin and destination
- Operatore che fornisce il servizio - Operator running the service
- Numero di ricerche effettuate per tipologia (coppia OD - Number of researched tickets per typology (OD
ed operatore) couple and operator)
- Prezzo medio proposto per tipologia di ricerca - Average price per typology
Product Operator Quantity Total revenues Average price Month Year
Venice – Istanbul OrientExpress 100 8000,00 80,00 3 2016
Nel campo “Operatore” sono inclusi sia gli operatori In the “Operator” field are specified both operators
effettivi che i reseller. In alcuni casi, sono presenti solo and reseller. In some cases, there is only the latter
questi ultimi. Qualora riconducibili ad operatori specifici, information: when possible, data have been
manually associated to the actual company
sono stati ricodificati manualmente associandoli alla
providing the service 7.
compagnia che opera effettivamente la tratta 6.
Starting from these data, we built another enriched
A partire da questi dati è stato costruito un database
database containing other attributes that allowed the
arricchito di attributi tali da consentire le analisi proposte. proposed analysis. The new database includes
Il database rielaborato contiene record “filtrati” records which routes exceed the “minimum
secondo una “soglia minima” di biglietti cercati/venduti threshold” of tickets sold/researched in the
per coppia OD per mese e per semestre (rispettivamente month and semester (5 and 150 respectively)
5 e 150).
6
Ad esempio, i biglietti venduti da Ibus, ove non diversamente specificato nei dati, sono stati attribuiti a Marino Autolinee.
7
As an example, tickets sold by Ibus, where not otherwise specified in the data, have been associated to Marino Autolinee.
TRASPOL – Politecnico di Milano ||| Checkmybus.it
8Puoi anche leggere