UniCredit - ECM Italy - Contesto Industriale Italiano e Fattori Fondanti per la Crescita Aziendale
←
→
Trascrizione del contenuto della pagina
Se il tuo browser non visualizza correttamente la pagina, ti preghiamo di leggere il contenuto della pagina quaggiù

UniCredit - ECM Italy

Contesto Industriale Italiano e Fattori Fondanti per la Crescita Aziendale

Roberto Rati
Head of Equity Capital Markets Italy

31 Maggio 2013

                                       UniCredit Bank AG
Agenda
IL CONTESTO INDUSTRIALE ITALIANO: I TREND POST CRISI
LE DINAMICHE DEI MERCATI FINANZIARI
FATTORI FONDANTI PER LA CRESCITA E COMPETITIVITA’ AZIENDALE
2
UniCredit Bank AG
Sistema Paese – PMI punto di forza della struttura industriale italiana
Commenti Attitudine all’ Export, un punto di forza del sistema1)
Le imprese italiane hanno mantenuto una forte propensione 70 63.5
%
all’export, nel confronto internazionale grazie a innovazione e 60 55.6
leadership di prodotto 47.9
50 45.4
41.2
Questa attitudine coinvolge in modo importante anche le piccole 40 34.5
30.1 28.8 29.0
imprese: in Italia la quota di esportazioni delle grandi imprese 25.9
30
(>250 addetti) è pari al 50 per cento, contro 3/4 di Francia e
20
Germania
10
La marginalità delle PMI manifatturiere italiane è superiore alla
0
media europea grazie all’eccellenza dei distretti industriali di
Germania Francia Spagna Regno Unito Italia
riferimento
% di esportatori sul totale delle imprese Quota esportazioni su fatturato totale
Margine Operativo Lordo dell’Industria Manifatturiera nei paesi UE2)
EUR(mld)
38.1 36.8
33.9 33.4
24.5
17.7
15.7 15.0 15.2
13.4
10.9
8.5 9.2 9.4
7.7
6.3 6.1
5.0 4.2 4.7
2.5 3.3 2.6 1.9
Austria Finlandia Germania Irlanda Italia Olanda Polonia Regno Unito Rep. Ceca Spagna Svezia Ungheria
SME Large
1) Efige/UniCredit database
3 2) Eurostat 2012. Definizione Eurostat: Large (più di 250 impiegati), Medium (da 50 a 249 impiegati), Small (da 10 a 49 impiegati), Micro (meno di 10 impiegati). SME = Medium, Small,
Micro
UniCredit Bank AG
Sistema Paese - La dimensione modesta può essere un limite alla
crescita…
Commenti Incidenza delle PMI per settore rispetto alla media UE 1)
Mobili 72%
La dimensione media dell’impresa italiana (misurata in termini di 84%
fatturato) è ancora molto al di sotto della media europea Meccanica 44%
66%
28%
La dimensione ridotta si associa spesso ad assetti proprietari Comp. Elettronica 57%
legati a persone fisiche e famiglie di imprenditori Metallurgia 27%
46%
16%
Questo comporta che il finanziamento bancario sia la principale Farmaceutica 23%
fonte per il fabbisogno dell’impresa Chimica 36%
60%
Spesso la conseguenza è che la disponibilità ad erogare credito Carta 40%
60%
delle banche è il vero limite alla crescita dell’impresa Abbigliamento 72%
68%
F&B 47%
68%
Italia UE27
Frammentazione e predominanza di piccole imprese 2) Size media modesta dell’impresa italiana vs altri paesi
Fatturato medio (EUR /000)
M&L:1.2% # Società
Polonia 95.5% 3.3% 1,556 Polonia 536
M&L:1.9%
Regno Unito 89.3% 8.8% 1,731 Italia 773
M&L:4.3%
Francia 73.0% 22.7% 1,847 Spagna 806
M&L:2.9%
Germania 83.0% 14.1% 1,880 Francia 1,938
M&L:0.9%
Spagna 93.1% 6.0% 2,653 Regno Unito 2,116
M&L:0.6%
Italia 94.3% 5.1% 3,947 Germania 2,488
micro small medium large
1) Banca d’Italia. Valori percentuali; quota dei prestiti delle banche sul totale dei debiti finanziari
4 2) Eurostat 2012. Definizione Eurostat: Large (più di 250 impiegati), Medium (da 50 a 249 impiegati), Small (da 10 a 49 impiegati), Micro (meno di 10 impiegati). SME = Medium, Small,
Micro
UniCredit Bank AG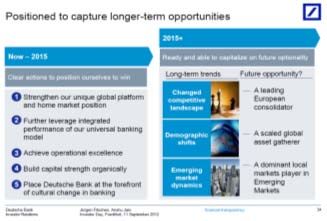
… anche a causa di una limitata diversificazione delle fonti di
finanziamento soprattutto nel confronto Europeo
Commenti Ricorso all’indebitamento bancario vs Europa 1)
Oggi il canale bancario rappresenta in Italia oltre il 70% del totale
dei debiti finanziari contro una media europea pari a 53% Equity / Cluster % sul tot.
Tot. Attivo
Circa il 50% delle imprese corporate italiane, secondo un campione
individuato da un recente survey di UniCredit risultano essere
sottopatrimonializzate, avente un rapporto mezzi propri / totale attivo
Capitalizzazione medio-alta 39,1%
inferiore al 20%
Riteniamo che adeguatezza dei mezzi patrimoniali e diversificazione 53%
delle fonti di finanziamento saranno i temi cruciali nel contesto post- 30%
crisi 13,9%
Capitalizzazione moderata
20%
Ricorso all’indebitamento bancario vs Europa 2)
10%
70% 68%70%
64% Bassa capitalizzazione 41,2%
61% 58%
54%
48% 5% 47%
45%
40%39% 39%
0%
Capitalizzazione negativa 5,9%
equity < 0
Italia Spagna Germania Francia
2007 2010 2011 100,0%
1) Banca d’Italia. Valori percentuali; quota dei prestiti delle banche sul totale dei debiti finanziari
5 2) Rapporto Equity / Tot. Attivo
UniCredit Bank AG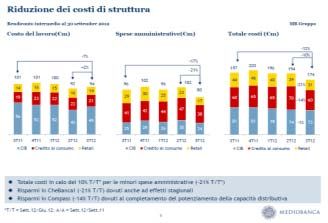
Ricorso all’Equity di terzi è ancora limitato nel confronto europeo
Commenti Capitalizzazione di Borsa
La strutturale sottopatrimonializzazione dell’impresa italiana si (USD /000 mld)
riflette anche nella bassa capitalizzazione di borsa (USD 400 mld 17.9
vs. USD 1.200-1.300 mld in Germania e Francia)
Il rapporto Market Cap / PIL è al di sotto della media europea
(24% vs 62%)
3.8
3.5
Il peso del comparto finanziario in borsa, pari al 28% vs il 17% 3.3
di media europea, accentua ancor più il problema
Le PMI italiane, pur rappresentando l’asse portante del sistema 1.7 1.6
industriale italiano (contando per più del 70% del PIL), sono
presenti solo in modo marginale sul listino:
0.5
Le Società di capitalizzazione inferiore a EUR 400mn pesano 0.2
per il 3.5% della capitalizzazione totale di borsa
USA Giappone Regno Cina Francia Germania Italia Polonia
Unito
Rapporto Capitalizzazione di Borsa / PIL (%) Numero Mid- Small Cap vs Mercato
144%
14,435 3,721 2,652 2,367 2,282 1,231 793 305
120% 100% 900
4%
12% 17% 18% 17%
24% 21%
33%
80% 700
60% 500
65% 63%
96.5%
88.2% 83.3% 82.1% 82.8%
45% 44% 40% 75.9% 79.0% 300
67.3%
34%
24% 20% 100
0% -100
USA Giappone Regno Cina Germania Francia Polonia Italia
Regno USA Giappone Francia Germania Cina Polonia Italia Unito
Unito # Società % Small-Mid Cap % Large Cap # Large Cap (dx)
quotate
Fonte: Analisi UniCredit su dati Bloomberg al 6 Febbraio 2013
6
UniCredit Bank AG
Nonostante il graduale miglioramento del “rischio paese” percepito e
la contrazione nel costo del funding...
Commento Spread BTP - Bund
600
Il ruolo attivo della BCE, a supporto dei singoli paesi e la maggiore
bps
disciplina di bilancio in alcuni paesi periferici, hanno contribuito ad
500
allentare la tensione sui mercati finanziari determinando una graduale
contrazione degli spread
400
La percezione di rischio del sistema finanziario si è smorzata grazie
alla ripatrimonializzazione delle banche (in linea con i requisiti EBA) e
300
alla liquidità iniettata nel sistema dalla BCE
L’incremento della liquidità nel sistema e la relativa contrazione del 200
“cost of funding” delle banche si è solo parzialmente tradotto in un gen-12 apr-12 lug-12 ott-12 gen-13 apr-13
miglior accesso al credito per le PMI BTP 10A Rendimento
CDS Principali Banche Europee a 5 anni dal 2012 Core Tier I – Principali Banche Europee
625
bps 13%
12% 11.6% 11.4%11.70%
500
11% 10.60%
AVG
375 10% 11.3%
9.2%
8.5% 8.7%
9%
250
8% AVG
7.1%
8.4%
125 7%
6%
0 2009 1Q2013
gen-12 apr-12 lug-12 ott-12 gen-13 apr-13
2009 3Q2012
Société Générale Intesa SanPaolo UniCredit BNP Paribas
Fonte: analisi UniCredit su dati Bloomberg, Investor Relations istituti finanziari al 29 Maggio 2013
7
UniCredit Bank AG
...il capitale nel “new normal” di Basilea III dovrà essere allocato con
requisiti più stringenti e selettivi
Commento
Le maggiori istituzioni finanziarie operanti sul territorio italiano, vista
la prossimità dell’entrata in vigore dei requisiti di Basilea III, hanno
dovuto stabilire un approccio più selettivo e stringente all’utilizzo del
“Maggiore attenzione
capitale all’uso del capitale:
saremo più selettivi nella
concessione del credito
Nonostante dei livelli di patrimonializzazione già coerenti con la
e più focalizzati sulle
nuova regolamentazione, il livello di attenzione rimane alto verso nostre attività principali.
una maggiore coscienza sull’utilizzo del capitale che è destinato a Il capitale è una risorsa
rimanere sempre più una risorsa scarsa scarsa e dobbiamo
tenerne conto”
UniCredit Strategic Plan
Nov 2011
“Ottimizzazione dell’uso del capitale” “Significativa riduzione del profilo di “We will allocate assets dynamically “Adapting to the new environment”
“Gestione del business in ottica rischio, significativamente migliorato across our portfolio” “Continue to develop Financing
Capital Effective” in determinate esposizioni corporate“ “World-class financial strength means Solutions with a selective reduction
“Riallocazione del capitale da clienti “Approccio selettivo alla crescita prudent risk management, of outstandings with a focus on
e prodotti a EVA negativa a entità a dell’attivo, con elevata qualità degli sustainable funding and new balance profitability and an efficient risk-
EVA positiva con ca. EUR 800 mn di attivi: sofferenze nette/impieghi=0%” of risk/reward in financing Corporates” return profile”
capitale a generazione di EVA “Risk assessment e de-risking sono “Focused portfolio of clients based “Stringent risk policy with proven
negativa già convertiti” top priorities ” on ability to generate value” effectiveness”
Intesa Sanpaolo Mediobanca Deutsche Bank BNP Paribas
Piano di Impresa 2011-2013/2015 Investor Day – Ottobre 2012 Investor Day – September 2012 Investor Day - November 2012
Fonte: analisi UniCredit su pubblicazioni ufficiali degli istituti di credito
8
UniCredit Bank AG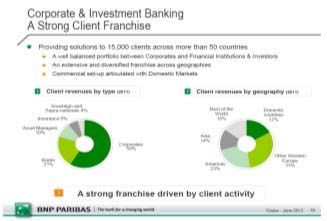
Agenda
IL CONTESTO INDUSTRIALE ITALIANO: I TREND POST CRISI
LE DINAMICHE DEI MERCATI FINANZIARI
FATTORI FONDANTI PER LA CRESCITA E COMPETITIVITA’ AZIENDALE
9
UniCredit Bank AG
Come sempre i mercati finanziari anticipano l’economia reale…

     Performance degli Indici Azionari e del PIL dal 1995

                                      400
         Indici Equity Mondiali

                                      350

                                      300

                                      250

                                      200

                                      150
                                                                          MSCI World
                                                                          Comit
                                      100                                 STOXX Europe 600
                                                                          S&P 500
                                       50
                                             95   96      97     98      99     00      01       02   03    04   05   06   07   08   09   10   11   12   13   14   15   16

                                        6

                                        4
         PIL Europa e Italia

                                        2

                                        0
                                             95   96     97      98      99     00      01      02    03    04   05   06   07   08   09   10   11   12   13   14   15
                                        -2

                                        -4

                                        -6        Eurostat GDP constant prices Europe
                                                  Eurostat GDP constant prices Italy
                                        -8

     Fonte: Bloomberg, Aprile 2013, stime UniCredit Research
10                          Periodi di performance negativa dei mercati azionari e del PIL

                                                                                             UniCredit Bank AG
…e i settori ciclici registrano una performance amplificata trainata
dalle aspettative di crescita…
Performance degli Indici Azionari Settoriali e del PIL dal 1995
500
Stoxx EU Consumer Discretionary
450
Stoxx EU F&B
400
Europei Settoriali
Indici Equity
350
300
250
200
150
100
50
95 96 97 98 99 00 01 02 03 04 05 06 07 08 09 10 11 12 13 14 15 16
6
4
PIL Europa e Italia
2
0
95 96 97 98 99 00 01 02 03 04 05 06 07 08 09 10 11 12 13 14 15
-2
-4
-6 Eurostat GDP constant prices Europe
Eurostat GDP constant prices Italy
-8
Fonte: Bloomberg, Aprile 2013, stime UniCredit Research
11 Periodi di performance negativa dei mercati azionari e del PIL
UniCredit Bank AG…mentre il mercato primario, ed in primis le IPO, riparte in un
momento successivo…
Volumi di IPO in Europa in relazione all’andamento del PIL dal 1995
40 400
EUR mld Volumi IPO (S)
Volumi di IPO in Europa
35 Euro Stoxx 600 (D) 32 350
30 29
30 27 27 300
26
25 25
25 250
20 2121
19
20 18 200
16
14
15 13 13 12 12 150
11 11 10 10 10 11 10 11 11
9 9 9
10 8 8 8 7 8 8 100
6 67 7 6
5 5 5 6 5 5
4 3 3 4
5 3 2 2 3 3 50
2 1 1101 1 1 1100 0 00
- 0
95 Q1
95 Q4
96 Q3
97 Q2
98 Q1
98 Q4
99 Q3
00 Q2
01 Q1
01 Q4
02 Q3
03 Q2
04 Q1
04 Q4
05 Q3
06 Q2
07 Q1
07 Q4
08 Q3
09 Q3
10 Q2
11 Q1
11 Q4
12 Q3
13 Q1
14 Q1
14 Q1
15 Q1
6
4
PIL Europa e Italia
2
0
95 96 97 98 99 00 01 02 03 04 05 06 07 08 09 10 11 12 13 14 15
-2
-4
-6 Eurostat GDP constant prices Europe
Eurostat GDP constant prices Italy
-8
Fonte: Bloomberg, Aprile 2013, stime UniCredit Research
12 Periodi di performance negativa dei mercati azionari e del PIL
UniCredit Bank AGMarket Recovery and Low Volatility Turned Investors flows into
Equities, with Asset Rotation Still in an Early Phase
Volatility at last 5Y lows Indices recovery with FTSEMIB slowly catching up
%
EU Sovereign Debt
EU Sovereign Debt Crisis Escalation
60
Crisis - I Phase
Japan Crisis 110
Concerns over Europe
50 N. African
and China’s soft landing
turmoil
105 Italian
40 Italian Political
Elections
Deadlock, Cyprus
Crisis
30
100
20
95
10
- 90
May-10 Nov-10 May-11 Nov-11 May-12 Nov-12 May-13 Jan-13 Feb-13 Mar-13 Mar-13 Apr-13 Apr-13 May-13
VSTOXX VIX MSCI World FTSE MIB STOXX Europe 600 S&P 500
2013E annualized equity flows – strongest in 11 years Yield driven asset rotation still in an early phase
Annual Flows as % of AuM, all equities
6
9.0% 5
2013 Annualized rate
rate, yield (%)
7.0%
4
5.0%
3
3.0%
2
1.0%
1
-1.0%
0
-3.0% 2010 2011 2012 2013
-5.0% Stoxx 600 Europe (est. dividend yield) iBoxx EUR NFI Senior yield
2002 2003 2004 2005 2006 2007 2008 2009 2010 2011 2012 2013E iBoxx EUR FIN Senior yield 5Y Bund yield
Source: UniCredit analysis on Bloomberg data. Net Cash Overweight in Funds Portfolios source: ML Asset Management Survey
13
UniCredit Bank AGInvestment criteria: Sector Selection
Increasing exposure towards equity, Luxury perceived as top pick in the next 12 M
Asset Allocation – Selected example 1) Cash overweight in funds portfolios at minimum level 1)
40% 6%
Current Next 12 M
Cash, Cash, 30%
14% 7%
5%
20%
Fixed
Income
10%
Fixed Equity, , 40%
4%
Income 69%
, 45% Equity, 0%
79%
-10% 3%
Jul-10
Jul-11
Jul-12
Sep-10
Nov-10
Jan-11
Sep-11
Nov-11
Jan-12
Sep-12
Nov-12
Jan-13
Mar-10
May-10
Mar-11
May-11
Mar-12
May-12
Mar-13
May-13
Net % Overweight Cash (LHS) Average Cash Balance % (RHS)
Early cyclicals main winners of economic recovery Top Criteria for Investors’ Portfolio Selection 1)
Next 12 M 2) Kepler Cheuvreux Outlook3)
Utilities 29% 71% Expected growth 29.2%
Search for yield
Focus on
Technology 75% 13%13% High visibility on future cash
25.0% companies with
flows
Industrials 38% 50% 13% clear growth
Management track record 8.3% trajectory and
Healthcare 43% 43% 14%
visibility of earnings
Profitability 8.3%
Financials 43% 57% for next 3-5 years
Energy 29% 57% 14%
= Stock liquidity 8.3%
Expected growth
and visibility on
Consumer
14% 57% 29% future cash flows
Services
Country specific factors 4.2%
Consumer as main investment
38% 50% 13%
Goods
dividend policy 4.2%
rational
Basic Mat. 29% 57% 14%
1) Net Cash Overweight in Funds Portfolios source: ML Asset Management Survey
14 2) UniCredit / Kepler survey on 20 top institutional investors, March 2013
3) Kepler Cheuvreux sector recommendations – May 2013
UniCredit Bank AGAgenda
IL CONTESTO INDUSTRIALE ITALIANO: I TREND POST CRISI
LE DINAMICHE DEI MERCATI FINANZIARI
FATTORI FONDANTI PER LA CRESCITA E COMPETITIVITA’ AZIENDALE
15
UniCredit Bank AGFattori fondanti per la crescita e competitività aziendale
Overview
6 1
Dimensione Visione Strategica
5 2
Accelerare la Crescita Posizionamento
Struttura Finanziaria per Governare la Competitivo
Competitività (Prodotti / Mercati)
4 3
Organizzazione
Capacità Manageriale
Aziendale
Esempio di Successo1)
1) Descrizione dettagliata nell’appendice “UniCredit Partner per la Crescita - Esempi di Successo”
16
UniCredit Bank AGL’Esempio di Successo di DMT/EI Towers (1/3)
DMT / EI Towers
2000 2012
Size
10 217
(Fatturato in EUR mln)
Diversificazione Player nazionale ora parte di gruppo
Player locale
Geografica multinazionale
Posizionamento Unico player indipendente in Italia in un
N. 1 tower operator indipendente in Italia
Competitivo di Rilievo mercato ad alte potenzialità
Ben definita e valida orientata alla Nuova fase di sviluppo post-
Visione Strategica
crescita consolidamento
Top manager
Capacità Manageriale Leadership e dinamismo top manager
con riconosciute capacità nel settore
Organizzazione Aziendale Start-up Best practice di settore
17
UniCredit Bank AGL’Esempio di Successo di DMT/EI Towers (2/3)
Evoluzione del Fatturato, dell’EBITDA e della Marginalità di Lungo Periodo1)
DMT – EI Towers
DMT – EI Towers
EUR 230,000,000
EUR 793,500,000 Senior Bond
Reverse Merger 3.875% due 2018
120 (EUR mln) Joint Bookrunner 60%
Listing Sponsor Italy, 2013
Italy, 2012
246
240
230
100 217 50%
80 40%
60 DMT 30%
EUR 84,000,000
IPO
40 Sole GC 20%
Sole Bookrunner
Sponsor
Italy, 2004
20 10%
0 0%
2001 2002 2003 2004 2005 2006 2007 2008 2009 2010 2011PF 2012E 2013E 2014E
Ebitda (sx) Ricavi (sx) Ebitda Margin (dx)
Fonte: Documenti Societari, Bloomberg
18 1) EI Towers è il nuovo nome di DMT a seguito della fusione per incorporazione di EI Towers (Società del gruppo Mediaset) in DMT, effettiva dal 1 Gennaio 2012
UniCredit Bank AGUniCredit Partner per la Crescita - Esempi di Successo
DMT-EI Towers (2/2)
Supporto di UniCredit nel percorso di crescita di DMT – EI Towers1)
DMT
Anno Operazione Ruolo di UniCredit
2000 DMT nasce come “management buy out” di un ramo di
2000 azienda di Elettronica Industriale S.p.A/Mediaset
EUR 84,000,000
IPO
Sole GC
Sole Bookrunner
2001 Erogazione da parte di UniCredit Banca d’Impresa S.p.A. Mandated Lead Arranger Sponsor
di un finanziamento a medio termine per EUR 26 milioni Italy, 2004
2003 Ampliamento linea a medio termine da parte di UniCredit Mandated Lead Arranger DMT
Banca d’Impresa SpA e di Efibanca S.p.A. per EUR 30m
Quotazione in Borsa sul segmento STAR Sole Global Coordinator,
2004 Bookrunner, EUR 476,000,000
Reverse Merger
Sponsor
Advisor
2004 Ristrutturazione linea di credito per EUR 50 milioni Arranger Italy, 2012
DMT – EI Towers
2005 Finanziamento a medio termine per EUR 100 milioni Arranger
2007 Estensione del finanziamento 2005 ad EUR 180 milioni Mandated Lead Arranger EUR 793,500,000
finalizzato allo sviluppo del portafoglio torri Reverse Merger
Listing Sponsor
Erogazione del margin loan a Millennium SpA Euro 20 Mandated Lead Arranger Italy, 2012
2011
mln
2011 Fusione per incorporazione di EI Towers (Gruppo Advisor DMT – EI Towers
Mediaset) in DMT
2012 Fusione per incorporazione di EI Towers (Gruppo Listing Sponsor EUR 230,000,000
Mediaset) in DMT Senior Bond
3.875% due 2018
2012 Joint Bookrunner
2013 Senior Bond Joint Bookrunner Italy, 2013
Fonte: Documenti Societari, Bloomberg
19 1) EI Towers è il nuovo nome di DMT a seguito della fusione per incorporazione di EI Towers (Società del gruppo Mediaset) in DMT, effettiva dal 1 Gennaio 2012
UniCredit Bank AGDisclaimer
This publication is presented to you by:
Corporate & Investment Banking
UniCredit Bank AG, Milan Branch
Via Tommaso Grossi, 10
20121 Milano, Italy
The information in this publication is based on carefully selected sources believed to be reliable. However we do not make any representation as to its accuracy or completeness. Any opinions herein reflect our judgement at the date hereof
and are subject to change without notice. Any investments presented in this report may be unsuitable for the investor depending on his or her specific investment objectives and financial position. Any reports provided herein are provided for
general information purposes only and cannot substitute the obtaining of independent financial advice. Private investors should obtain the advice of their banker/broker about any investments concerned prior to making them. Nothing in this
publication is intended to create contractual obligations. Corporate & Investment Banking of UniCredit Group consists of UniCredit Bank AG, Munich, UniCredit Bank Austria AG, Vienna, UniCredit CAIB Securities UK Ltd. London, UniCredit
S.p.A., Rome and other members of the UniCredit Group. UniCredit Bank AG is regulated by the German Financial Supervisory Authority (BaFin), UniCredit Bank Austria AG is regulated by the Austrian Financial Market Authority (FMA),
UniCredit CAIB AG is regulated by the Austrian Financial Market Authority (FMA) and UniCredit S.p.A. is regulated by both the Banca d'Italia and the Commissione Nazionale per le Società e la Borsa (CONSOB). UniCredit Bank AG Milan
Branch is regulated by the Banca d'Italia and the Commissione Nazionale per le Società e la Borsa (CONSOB) and BaFin.
Note to UK Residents:
In the United Kingdom, this publication is being communicated on a confidential basis only to clients of Corporate & Investment Banking of UniCredit Goup (acting through UniCredit Bank AG, London Branch and/or UniCredit CAIB Securities
UK Ltd. who (i) have professional experience in matters relating to investments being investment professionals as defined in Article 19(5) of the Financial Services and Markets Act 2000 (Financial Promotion) Order 2005 (“FPO”); and/or (ii)
are falling within Article 49(2) (a) – (d) (“high net worth companies, unincorporated associations etc.”) of the FPO (or, to the extent that this publication relates to an unregulated collective scheme, to professional investors as defined in Article
14(5) of the Financial Services and Markets Act 2000 (Promotion of Collective Investment Schemes) (Exemptions) Order 2001 and/or (iii) to whom it may be lawful to communicate it, other than private investors (all such persons being
referred to as “Relevant Persons”). This publication is only directed at Relevant Persons and any investment or investment activity to which this publication relates is only available to Relevant Persons or will be engaged in only with Relevant
Persons. Solicitations resulting from this publication will only be responded to if the person concerned is a Relevant Person. Other persons should not rely or act upon this publication or any of its contents.
The information provided herein (including any report set out herein) does not constitute a solicitation to buy or an offer to sell any securities. The information in this publication is based on carefully selected sources believed to be reliable but
we do not make any representation as to its accuracy or completeness. Any opinions herein reflect our judgement at the date hereof and are subject to change without notice.
We and/or any other entity of Corporate & Investment Banking of UniCredit Group may from time to time with respect to securities mentioned in this publication (i) take a long or short position and buy or sell such securities; (ii) act as
investment bankers and/or commercial bankers for issuers of such securities; (iii) be represented on the board of any issuers of such securities; (iv) engage in “market making” of such securities; (v) have a consulting relationship with any
issuer. Any investments discussed or recommended in any report provided herein may be unsuitable for investors depending on their specific investment objectives and financial position. Any information provided herein is provided for
general information purposes only and cannot substitute the obtaining of independent financial advice.
UniCredit Bank AG, London Branch is regulated by the Financial Services Authority for the conduct of business in the UK as well as by BaFIN, Germany. UniCredit CAIB Securities UK Ltd., London, a subsidiary of UniCredit Bank Austria AG,
is authorised and regulated by the Financial Services Authority.
Notwithstanding the above, if this publication relates to securities subject to the Prospectus Directive (2005) it is sent to you on the basis that you are a Qualified Investor for the purposes of the directive or any relevant implementing
legislation of a European Economic Area (“EEA”) Member State which has implemented the Prospectus Directive and it must not be given to any person who is not a Qualified Investor. By being in receipt of this publication you undertake that
you will only offer or sell the securities described in this publication in circumstances which do not require the production of a prospectus under Article 3 of the Prospectus Directive or any relevant implementing legislation of an EEA Member
State which has implemented the Prospectus Directive.
Note to US Residents:
The information provided herein or contained in any report provided herein is intended solely for institutional clients of Corporate & Investment Banking of UniCredit Group acting through UniCredit Bank AG, New York Branch and UniCredit
Capital Markets, Inc. (together “UniCredit”) in the United States, and may not be used or relied upon by any other person for any purpose. It does not constitute a solicitation to buy or an offer to sell any securities under the Securities Act of
1933, as amended, or under any other US federal or state securities laws, rules or regulations. Investments in securities discussed herein may be unsuitable for investors, depending on their specific investment objectives, risk tolerance and
financial position.
In jurisdictions where UniCredit is not registered or licensed to trade in securities, commodities or other financial products, any transaction may be effected only in accordance with applicable laws and legislation, which may vary from
jurisdiction to jurisdiction and may require that a transaction be made in accordance with applicable exemptions from registration or licensing requirements.
All information contained herein is based on carefully selected sources believed to be reliable, but UniCredit makes no representations as to its accuracy or completeness. Any opinions contained herein reflect UniCredit's judgement as of the
original date of publication, without regard to the date on which you may receive such information, and are subject to change without notice.
UniCredit may have issued other reports that are inconsistent with, and reach different conclusions from, the information presented in any report provided herein. Those reports reflect the different assumptions, views and analytical methods of
the analysts who prepared them. Past performance should not be taken as an indication or guarantee of further performance, and no representation or warranty, express or implied, is made regarding future performance.
UniCredit and/or any other entity of Corporate & Investment Banking of UniCredit Group may from time to time, with respect to any securities discussed herein: (i) take a long or short position and buy or sell such securities; (ii) act as
investment and/or commercial bankers for issuers of such securities; (iii) be represented on the board of such issuers; (iv) engage in “market-making” of such securities; and (v) act as a paid consultant or adviser to any issuer.
The information contained in any report provided herein may include forward-looking statements within the meaning of US federal securities laws that are subject to risks and uncertainties. Factors that could cause a company's actual results
and financial condition to differ from its expectations include, without limitation: Political uncertainty, changes in economic conditions that adversely affect the level of demand for the company‘s products or services, changes in foreign
exchange markets, changes in international and domestic financial markets, competitive environments and other factors relating to the foregoing. All forward-looking statements contained in this report are qualified in their entirety by this
cautionary statement.
Corporate & Investment Banking
UniCredit Bank AG, Milan Branch
as of 29 May 2013
20
UniCredit Bank AGPuoi anche leggere