RAPPORTO SUL MERCATO DELLE AUTOLINEE A LUNGA PERCORRENZA IN ITALIA | ANNO - 2017 ITALIAN LONG-DISTANCE COACH TRANSPORT MARKET - autobus
←
→
Trascrizione del contenuto della pagina
Se il tuo browser non visualizza correttamente la pagina, ti preghiamo di leggere il contenuto della pagina quaggiù

TRASPOL report 1/18
RAPPORTO SUL MERCATO DELLE AUTOLINEE A LUNGA
PERCORRENZA IN ITALIA | ANNO - 2017
ITALIAN LONG-DISTANCE COACH TRANSPORT MARKET
REPORT | YEAR 2017

                          In collaboration with: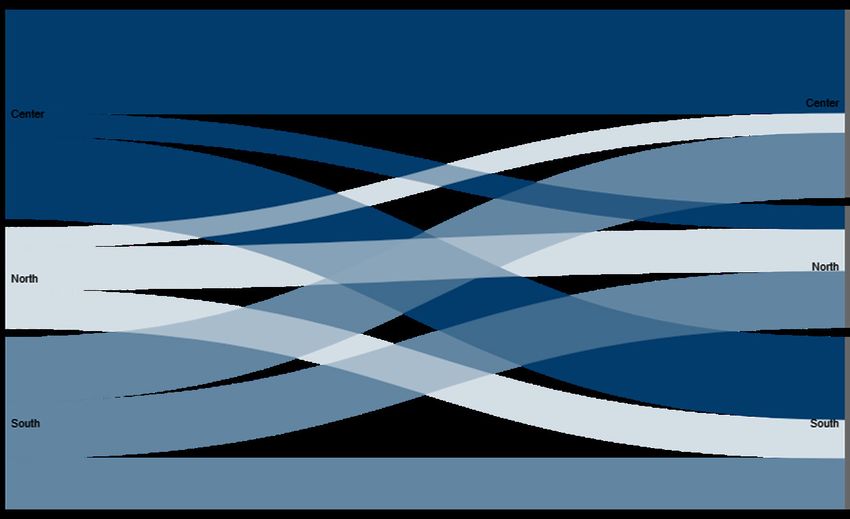
IL MERCATO DELLE AUTOLINEE A LUNGA PERCORRENZA IN ITALIA (Italian long-distance
coach transport market report)
Anno 2017 / year 2017

Autori: Paolo Beria, Dario Nistri

Il presente rapporto viene pubblicato periodicamente in collaborazione con Checkmybus.it, sulla base dei dati
raccolti sulla piattaforma. La collaborazione rientra nelle attività del progetto QUAINT (MIUR rif.:
RBSI14JR1Z), di cui il prof. Paolo Beria è titolare.
The report is published in collaboration with Checkmybus.it based on the data available on Checkmybus.it website. This
partnership is part of the activities foreseen in the project QUAINT (MIUR rif.: RBSI14JR1Z) under the scientific
responsibility of prof. Paolo Beria.

Please quote as follows:
 Beria P., Nistri D. (2018). Rapporto sul Mercato delle Autolinee a Lunga Percorrenza in Italia | Year 2017.
 TRASPOL Report 1/18 & Checkmybus. Milano, Italy.

Photo by Scott Webb on Unsplash

TRASPOL – Laboratorio di Politica dei Trasporti
Dipartimento di Architettura e Studi Urbani, Politecnico di Milano
Via Bonardi 3, 20133, Milano, Italy.
www.traspol.polimi.it
SOMMARIO

1    Introduzione | Introduction .................................................................................................................................... 4
2    FACTS & FIGURES ................................................................................................................................................. 6
3    Overview .................................................................................................................................................................... 7

4    Gli utenti dei bus di lunga percorrenza | Long distance coach users ............................................................... 9

5    Andamento del mercato | Market trends ............................................................................................................ 11

6    La lunghezza del viaggio | Trip Lenght ............................................................................................................... 17
7    La Concorrenza | Competition ............................................................................................................................. 19

8    Indice dei prezzi | Price index ............................................................................................................................... 21

9    Metodologia | Methodology .................................................................................................................................. 26
10   Conclusioni | Final remarks .................................................................................................................................. 28

                                           TRASPOL – Politecnico di Milano ||| Checkmybus.it
                                                                                                                                                                                  3
1 INTRODUZIONE | I NTRODUCTION
Questo rapporto, preparato in collaborazione con Checkmybus.it, è la quarta uscita di una serie di studi
semestrali sull’andamento del mercato degli autobus di lunga percorrenza in Italia. Il rapporto è dedicato
al monitoraggio dell’evoluzione del settore fino al secondo 2017 con un particolare focus sui prezzi.
Il rapporto è disponibile gratuitamente su www.traspol.polimi.it e su www.checkmybus.it ed è basato sul
campione di dati raccolti dalla piattaforma di vendita Checkmybus.it da gennaio 2016 a dicembre 2017. Grazie
a questa base dati è possibile studiare il profilo degli utenti delle autolinee e della piattaforma, i prezzi praticati,
il livello di concentrazione del mercato, le rotte principali.
Tutte le specifiche metodologiche sono raccolte nell’ultimo capitolo.
Approfondimenti / Further material
Per approfondire il settore prima e dopo la liberalizzazione, è possibile scaricare e consultare i
seguenti rapporti, preparati per ANAV:
2011. STUDIO SUL SERVIZIO AUTOBUS DI LUNGA PERCORRENZA IN ITALIA
Beria P., Grimaldi R., Laurino A. (2013). Long distance coach transport in Italy. State of the art and perspectives.
2013. IL TRASPORTO PASSEGGERI SU AUTOBUS PER LE LUNGHE DISTANZE. CONFRONTO
MODALE, ANALISI SPAZIALE E SCENARI DI SVILUPPO
Beria, P. et al. (2014). Spatial and scenario analyses of long distance coach transport in Italy
2015. AUTOLINEE STATALI: GLI EFFETTI DELLA RIFORMA. RISULTATI, OPPORTUNITÀ E
CRITICITÀ DELL’APERTURA DEL MERCATO
Beria P., Laurino A., Bertolin A., Grimaldi R. (2015). Long distance coach services: the effects of the reform. Results,
opportunities and critical aspects following the opening of the market.
RAPPORTO SUL MERCATO DELLE AUTOLINEE A LUNGA PERCORRENZA IN ITALIA.
Beria P., Laurino A. (2016). Italian Long-Distance Coach Transport Market. Report I° semester 2016.
Beria P., Nistri D., Laurino A. (2017). Italian Long-Distance Coach Transport Market. Report full year 2016.
INTERCITY COACH LIBERALISATION. THE CASES OF GERMANY AND ITALY
Grimaldi R., Augustin K., Beria P. (2017). Intercity coach liberalisation. The cases of Germany and Italy.
Transportation Research Procedia, 25, 474-490.
This report, prepared in collaboration with Checkmybus.it, is the fourth of a biannual series of studies on the long-
distance coach market trends in Italy. The current issue summarizes 2017 data and trends that came up as a relatively
liberalized mature market.
The report is aimed at becoming a useful tool to monitor the evolution of the market, both for the companies and the public
regulator.
The report is available for free at www.traspol.polimi.it and www.checkmybus.it. It is based on a sample of data collected
by the Checkmybus.it platform. Thanks to this database, it is possible to study the profile of platform users, the prices,
the level of market concentration, the main routes.
All methodological specifications are given in the last section.
TRASPOL – Politecnico di Milano ||| Checkmybus.it
4Aggiornamento metodologico
Con questa edizione del report, sono state introdotte alcune novità per quanto riguarda la metodologia e le
elaborazioni presentate.
Nei precedenti report, al fine di definire il campione, il dato è stato filtrato secondo una “soglia” mensile minima
di biglietti ricercati per rotta. A partire dal presente report, invece, il valore “soglia” per il filtro è stato impostato
a livello semestrale al fine di garantire una relativa stabilità delle rotte incluse nel campione alla base delle
elaborazioni dello studio.
Sulla base di questa nuova versione del campione, sono stati ricalcolati gli indicatori presentati nei precedenti
report. A campione modificato, tuttavia, il quadro del mercato non ha mostrato variazioni significative (salvo
alcune eccezioni debitamente segnalate e motivate), come emerge anche dai prossimi paragrafi.
Methodology update
The current report introduces two major changes. On one side we adapted the methodology, on the other we included new
elaborations and the results.
First, in the previous reports, we set up a filter accordingly to monthly statistics of routes. In other words, we selected a
sample including “at least” a proper number of tickets researched on a monthly basis.
In order to increase the stability of the sample, starting with the current report, the sample of routes has been extracted
setting up a filter on biannual basis (“at least a proper number of tickets during this semester).
According to the methodology update, we have elaborated our indexes also for the previous semesters. We found out that
(except for punctual changes) there are not significant variation to the panorama depicted from our previous reports.
Secondly, the new releases of this document include:
TRASPOL – Politecnico di Milano ||| Checkmybus.it
52 FACTS & FIGURES
Indice dei Prezzi | Price Index
Variazione media pesata / Average
Weighted Price Change
+8,6%*
Rispetto al semestre precedente /
With respect to the previous semester
+20,2%*
Rispetto allo stesso semestre dell’anno
precedente /With respect to the same
semester in the previous year
Profilo degli utente tipo Viaggi ricercati per origine e destinazione
User profile Researched tickets per origins and destinations
Maschio /femmina
Top 10 città origine e destinazione (Checkmybus 2017) Share compagnia (Checkmybus 2017)
Top10 cities origins and destinations Sample Company Share
Rank Top Domestic origins Top domestic destinations 2017
2017 – II –II
1° Roma Milano
2° Milano Napoli
3° Napoli Bologna
4° Bologna Lamezia Terme
5° Bari Firenze
6° Lamezia Terme Villa San Giovanni
7° Firenze Catania
8° Torino Bari
9° Pescara Pescara
10° Catania Torino
TRASPOL – Politecnico di Milano ||| Checkmybus.it
63 OVERVIEW
Il quadro complessivo: due anni di monitoraggio | The overall picture: two years of monitoring
Come è ormai noto 1, l’apertura del mercato della lunga percorrenza su gomma del 2014 si è rapidamente
tradotta in nuove relazioni servite e/o nell’aumento delle frequenze settimanali, proposta di nuovi modelli di
offerta (intercity, notturno tra grandi città, etc.) ed un marcato utilizzo di tariffe differenziate, soprattutto sulle
tratte in competizione con la ferrovia. Già dopo pochi mesi, il settore ha subito un ulteriore cambiamento, con
l’acquisto da parte di Flixbus di tutte le attività europee di Megabus, compreso il mercato italiano. Nei primi
mesi del 2017, il mercato cambia ancora: Ferrovie dello Stato, compagnia ferroviaria statale dominante,
analogamente a quanto accaduto in altri paesi (Germania, Francia, Austria), ha avviato la propria compagnia di
trasporto passeggeri di lunga percorrenza, Busitalia Fast, fondendosi con l’operatore storico calabrese SIMET. I
dati di due anni di osservazione dei prezzi (raccolti grazie alla piattaforma Checkmybus.it) offrono l’immagine
di un settore che sta facendosi apprezzare e conoscere dall’utenza, ma che dalla parte dell’offerta risulta ancora
in evoluzione. La conferma di questa dinamica è data, al di là delle variazioni stagionali, dalla complessiva
tendenza all’aumento del prezzo medio pesato al km (da 0,038 a 0,058 Euro al km), segno della crescita della
domanda e della fine della fase commerciale più aggressiva. Da segnalare, infine, che il livello di penetrazione
del mercato della piattaforma Checkmybus.it è sempre più consistente, garantendo al dato utilizzato nel
presente rapporto una solidità sempre maggiore.
As it is widely known, the market opening has turned into new routes, increased frequencies and new offer models
(intercity, night services between big cities). Furthermore, it turned out that companies adopted a different strategy when
the competition with railway services occurred. A few months later, the market has changed again since Flixbus acquired
the European business from Megabus, Italian market included. During the first semester of 2017, the market has changed
again. Similarly to what we have seen in other European countries (Germany, France, Austria), FS Italiane (the state-owned
rail company) established a new company, Busitalia Fast-SIMET, a long distance coach passenger service provider. The
new company originates from a merger between Busitalia and SIMET, a historic southern-Italy coach operator. After two
years of price monitoring, based on Checkmybus datasets, the sector proved to be appreciated by an increasing number of
users although the supply side it is still evolving. Such view is supported by a significant average weighted price growth over
the two years (from 0,038 to 0,058 euro/km ). Those figures indicate that there is an increase in patronage and mark the
end of the discounted and promotional fares.
Finally, it is important to note the improved market penetration of Checkmybus that offers a solid background for the
analysis of the current Report.
Il secondo semestre 2017 | The II semester 2017
L’elaborazione del dato del secondo semestre 2017 conferma la tendenza (già presente nel primo semestre) di
un significativo aumento dei prezzi dei servizi di lunga percorrenza rispetto all’anno precedente. In termini di
prezzo medio pesato al km si registra un aumento dell’ordine del 20% rispetto allo stesso semestre dell’anno
precedente. Nell’arco del semestre, l’aumento il prezzo medio al km risulta più marcato nei mesi estivi e meno
pronunciato a partire dai mesi di ottobre/novembre. I valori massimi corrispondono al mese di luglio (0,064
Euro al km), mentre il minimo (0,053 Euro al km) è stato toccato nel mese di ottobre. L’andamento della curva
1
Beria et al. (2015), Autolinee statali: gli effetti della riforma. Risultati, opportunità e criticità dell’apertura del mercato.
Report preparato per ANAV
TRASPOL – Politecnico di Milano ||| Checkmybus.it
7dei prezzi conferma la sensibilità “stagionale” dei prezzi al livello di domanda registrato dalla piattaforma
Checkmybus.it.
Complessivamente il dato semestrale presenta un elevato tasso di variabilità interna, totalizzando un coefficiente
di variazione di 51,83%. In sostanza i prezzi rilevati sono molto dispersi relativamente alla propria media.
In termini di direttrici, gli spostamenti prevalenti sono quelli che si volgono tra Centro e Sud e tra Centro e
Centro. Le ragioni di di natura “storica” di questa preminenza, che continua grazie alla vitalità del mercato
interno al Sud Italia, sono da ricercarsi anche nella scarsa accessibilità ferroviaria per gli spostamenti interni al
Centro.
The data of the second semester 2017 shows that the first semester’s trend still holds. A significant increase in prices of
long distance coach services is registered by the search engine Checkmybus.it, up to 20% with respect to the same semester
of the previous year. In particular, the average weighted price per km growth is stronger during summertime and weaker
in autumn. The maximum price was recorded on July (0.064 euro/km) and the minimum (0.053 euro/km) in October. The
price curve demonstrates a seasonal trend that appears to be influenced by the demand index. Overall, the current semester
dataset shows a high variability rate, with a coefficient of 51.83%. In other words, prices included in the sample are quite
dispersed with respect to the average.
Geographically, trips between Centre and Nord and within Central regions are prevalent. Very likely, on one side the
southern Italy historical market is still lively, while on the other side the railway connections within central regions in Italy
are an historic issue.
TRASPOL – Politecnico di Milano ||| Checkmybus.it
84 GLI UTENTI DEI BUS DI LUNGA PERCORRENZA |
LONG DISTANCE COACH USERS
Il dato del secondo semestre 2017 conferma il dato annuale Among 2017’s second semester Checkmybus.it users
2016 e del primo semestre 2017: la ripartizione del in Italy, women slightly prevail over men (more than
campione per genere già osservata vede la componente 56%) such as in the first semester. This fact shows how
the coach transport is perceived as a safe and secure
femminile prevalere leggermente con il 56% del campione
transport mode.
osservato. Questo dimostra come l’autobus sia considerato
un mezzo sicuro e affidabile.
Gender distribution
(Source: elaborations on CheckMyBus data)
female male
I giovani si confermano (con minime variazioni rispetto al The majority of coach users are young people. Half
passato semestre) i principali utenti dei servizi di lunga of the Checkmybus.it users is concentrated below 34
percorrenza con autobus. Metà degli utenti di years old. They are more used to apps and mobile
ticketing. However, the use of new technologies is
Checkmybus.it, più abituati alle app e ai sistemi di
growing also among older travellers. Coach
TRASPOL – Politecnico di Milano ||| Checkmybus.it
9bigliettazione tramite smartphone, si concentra sotto i 34 transport is a mode for everybody because
anni. Tuttavia, l’uso di tali servizi è in aumento anche tra i guarantees a cheap and comfortable trip, form door
viaggiatori più anziani. Il trasporto su autobus è una to door, even with many luggage.
modalità per tutti poiché garantisce un viaggio economico
e confortevole da porta a porta, anche con molti bagagli.
TRASPOL – Politecnico di Milano ||| Checkmybus.it
105 ANDAMENTO DEL MERCATO | MARKET TRENDS
In termini di biglietti ricercati, continua la crescita del The number of researched tickets in 2017 showed
settore: rispetto al 2016, nel 2017 risultano più evidenti i that the long distance coach market was still lively.
picchi dei periodi vacanzieri sia in primavera, sia nella In particular, with respect to the previous year,
springtime and summertime peaks were more
stagione estiva.
sharpen.
Nel secondo semestre 2017, il numero di biglietti ricercati
During the 2017 second semester, the number of
in valore assoluto (riferiti ai soli servizi di lunga
researched tickets (only long distance coach
percorrenza in tutta Italia) si è mantenuto di gran lunga al services) was 16 times higher than January 2016,
di sopra dei valori di inizio 2016, raggiungendo ad agosto when several companies did not offer their ticket on
le 16 volte le quantità di gennaio 2016, quando molte Checkmybus.it.
compagnie non erano ancora presenti e la piattaforma
stessa era meno nota.
Nella pagina successiva (Grafico 1), si può notare come i In the next page (graph 1), we notice that 2017
second semester peaks were in July, August and
mesi con più ricerche nel secondo semestre 2017 sono
December. Those months are characterized by
luglio, agosto e dicembre. Si tratta di mesi in cui la
summertime and winter holidays, resulting in the
domanda è spinta dal turismo estivo 2 e delle vacanze
index to reach the expected peaks for long distance
natalizie. Il secondo semestre 2017 presenta dunque un services similarly to aviation and rail services.
andamento tipico, analogamente a quanto accade in altri The graph 2 shows the direction of the researched
settori della lunga percorrenza (aereo e ferroviario), al tickets categorized per macroareas: (Center, North,
contrario del secondo semestre 2016 che aveva in ottobre South) on right hand side there are origins, on the
raggiungere il picco annuale. left hand side destinations.
Il Grafico 2 illustra la “direzione” dei viaggi: a sinistra sono First of all, we observe that number of researched
rappresentate le aree di origine e a destra le aree di tickets from center to center is the most relevant in
destinazione. Gli spostamenti fra centro e centro sono fra i the sample. Trips from center to south have a greater
share than the other way around. Similarly, there are
più consistenti, mentre emerge una prevalenza degli
more tickets researched from south to north rather
spostamenti dal centro verso il sud piuttosto che l’inverso.
than north to south.
Analogamente sembrano più forti gli spostamenti sud- That phenomenon may be explained through a
nord piuttosto che i nord-sud. variety of factors. Among them rail service
Questa distribuzione può essere spiegabile attraverso una accessibility. First of all, we notice that strongest
molteplicità di fattori, fra questi l’accessibilità ferroviaria. relationships between macroareas are those where
In prima analisi si ha conferma che le relazioni più forti si the rail service accessibility is poorer. In particular,
individuano dove l’accessibilità ferroviaria è minore. Il the graph of flows show that long distance coach
grafico dei flussi, però, suggerisce che l’autobus a lunga services are more competitive where rail service
accessibility is poor at the origin of the trip. We can
percorrenza sembra offrire una miglior prova dove
infer that the travellers, once boarded, they would
l’accessibilità ferroviaria è minore nell’origine dello
prefer a longer trip, rather facing an interchange stop
spostamento.
with a faster means of transport (eg. High Speed
2
E’ utile ricordare che questa dinamica deriva sostanzialmente da tre fattori: la stagionalità, l’effettiva crescita della
domanda, ma anche l’aumento della penetrazione nel mercato della piattaforma. Questo indicatore non è dunque da
intendersi, in questa fase iniziale, come una misura assoluta della crescita del mercato.
TRASPOL – Politecnico di Milano ||| Checkmybus.it
11Grafico 1
Grafico 2 - Graph made with RAW, by DensityDesign Lab and Calibro
TRASPOL – Politecnico di Milano ||| Checkmybus.it
12Si potrebbe quindi dedurre che l’utenza, una volta sul bus, Train).
preferisca un viaggio più lungo piuttosto che un
interscambio con un mezzo più veloce (il treno) laddove
l’offerta diventi più appealing.
Il Grafico 3 mostra la ripartizione dei biglietti ricercati per
The graph 3 shows the monthly traffic distribution
direttrice (senza considerare la direzione) nel campione per route in percentage. The second semester 2017
analizzato. Il secondo semestre 2017 mostra che le relazioni recorded that trips between macroareas center-south
centro-sud assumono sempre maggior importanza nel achieved a relevant share in the sample. While north-
campione. Le relazioni nord-sud mostrano uno share del south trips approximately held, the other
campione relativamente costante, mentre sembrano connections between macroareas, north-north,
perdere d’importanza relativa le rotte nord-nord, centro- center-north and south-south started a slow relative
nord e sud-sud (tranne la parentesi estiva di luglio e decline (except for July and August). The center-
center routes, instead, during summertime and until
agosto). Le rotte centro-centro, invece, nei mesi estivi e fino
October still held a significant share of the sample.
a ottobre mantengono una quota del campione non
With respect to the seasonality, it is interesting to
trascurabile.
note that the highest share of trips center-center was
Per quanto riguarda l’effetto della stagione sulla reached in July 2017. In December, instead, center-
composizione del dato, è interessante da rilevare che la south trips reached the maximum share (very likely
maggior quota dei viaggi centro-centro sia stata raggiunta for winter holidays), whilst July and August the
a luglio 2017. Nel mese di dicembre, invece, la direttrice effect of holidays was not so powerful.
centro-sud raggiunge i massimi livelli (presumibilmente
per i ritorni di Natale), mentre meno marcato (ma sempre
significativo) è l’effetto delle vacanze estive (luglio e
agosto).
The “monthly traffic index between macroareas”
L’indice per direttrice (Grafico 4) mostra le diverse
(graph 4) shows how different markets evolve
dinamiche relative ai diversi mercati geografici nell’arco dei according to different trends.
due anni analizzati. Coerentemente a quanto già visto nel As aforementioned, the most relevant growth
grafico precedente, nel 2017, la crescita maggiore si ha nelle regarded the centre-south, the Centre-South and the
rotte centro-sud e centro-centro, mentre le altre registrano center-center routes. The other routes, instead, grew
una relativa stabilità. steadily.
Secondo il nuovo dato “depurato”, il mercato storico nord- According to the new methodology, the historical
sud sembra essere più sensibile alle variazione stagionale market north-south appears to be more sensitive to
seasonal effects with respect to the previous year,
rispetto all’anno precedente, mentre il mercato interno al
whilst the north-north market shows smaller
nord mostra variazioni più contenute.
variations.
TRASPOL – Politecnico di Milano ||| Checkmybus.it
13Grafico 3
Grafico 4
Tra le principali origini e destinazioni sono presenti le The main origins and destinations are the main
grandi città e alcuni dei centri intermedi, come già cities as in the previous reports. Similarly, important
evidenziato nei precedenti Report. Non sorprende che missing cities of the Northeast does not appear in the
top 10. Not surprisingly, Rome, Milan and Naples
Roma, Milano e Napoli siano i poli principali per numero
are the main city in terms of researched tickets on the
di biglietti ricercati. Sono confermate le assenze delle città
website. At the end of the list we find some of the
venete per il quarto semestre consecutivo.
main cities of centre and south Italy. Interesting to
TRASPOL – Politecnico di Milano ||| Checkmybus.it
14Nella seconda parte della lista compaiono invece note that Bari improved the position in the list of the
(soprattutto grazie all’ingresso di nuove compagnie) cities of origin of trips, from the 8 to the 5 place.
th th
importanti centri del centro-sud. Da segnalare Bari che nel Bari, instead, was not at all among the top 10
destinations in 2016 and in 2017 resulted in the 6th
primo semestre 2017 ha scalato la classifica dei viaggi
place as a researched destination.
“originati” passando dall’ottavo posto del 2016 al quinto del
Torino, with respect to the previous report,
2017, conferma la propria posizione. La città pugliese non
grounded to the bottom of the list, leaving the high
compariva affatto fra le destinazioni nel 2016. Torino, spaces to Villa San Giovanni, Lamezia Terme e
rispetto al report precedente, perde quota in classifica Catania (for the first time in the top 10).
finendo agli ultimi posti, cedendo il passo ad altre
destinazioni come Villa San Giovanni, Lamezia Terme e
Catania (che appaiono per la prima volta) nella TOP 10.
Rank Top Domestic origins Top domestic
2017 – II destinations 2017 –II
1° Roma Milano
2° Milano Napoli
3° Napoli Bologna
4° Bologna Lamezia Terme
5° Bari Firenze
6° Lamezia Terme Villa San Giovanni
7° Firenze Catania
8° Torino Bari
9° Pescara Pescara
10° Catania Torino
La mappa a pagina successiva mostra la matrice OD The map on the next page shows the OD Matrix
Regione-Regione in termini di peso distribuito sul totale Region-to-Region in terms of share of the researched
del semestre. Le relazioni di gran lunga più presenti sono ticket in the semester. The most OD couples are:
Lazio-Abruzzo, Lazio-Calabria then Campania-
Lazio-Abruzzo, Lazio-Calabria, seguite da Campania-Lazio
Lazio and Puglia-Campania. Between the north-
e Puglia-Campania. La relazione nord-sud più forte è
south ODs, the most important is Lombardia-
Lombardia-Calabria, mentre le rotte interne al nord
Calabria, whilst the northen internal ODs share,
risultano residuali totalizzando complessivamente poco summing all northern regions, is just about 6%.
meno del 6% del campione.
TRASPOL – Politecnico di Milano ||| Checkmybus.it
15TRASPOL – Politecnico di Milano ||| Checkmybus.it
166 LA LUNGHEZZA DEL VIAGGIO | TRIP LENGHT
Per quanto riguarda la lunghezza tipica del viaggio, si Looking at the typical length of the trips, the
osserva una nuova tendenza: nel secondo semestre 2016 e distribution of researched tickets showed a new
nel primo semestre 2017 la distribuzione dei biglietti trend. During the second semester 2016 and the
first semester of 2017, the typical distance was
ricercati mostrava una prevalenza di viaggi di distanza
comprised between 400 and 600 km, whereas in the
compresa fra 400 e 600 km, mentre nel secondo semestre
second semester 2017, the trips beyond 1000 km
2017 la forte crescita dei viaggi con distanze superiori ai
resulted in a dramatic increase. Therefore for the
1000 km porta le categorie fra i 100 e 200 km, tra 400 e 600 second semester 2017, the categories 100-200 and
km ad equivalersi. 400-660 recorded an equivalent share to the
Come per il primo semestre del 2017, i viaggi entro i 100 km category “beyond 1000 km”. Finally, the trips
sono del tutto residuali. below 100 km were not significant.
Nonostante la crescita dei viaggi superiori ai 1000 km Overall, despite the increase of the trips beyond
(storico mercato di riferimento del settore), l’autobus 1000 km (the historical market of this sector), the
long distance coach service records demonstrate
conferma la sua forza nel segmento di distanza
that relatively short distance services /
relativamente breve, tipico delle relazioni interregionali.
interregional service is a lively and robust sub-
market.
TRASPOL – Politecnico di Milano ||| Checkmybus.it
17Sul lato delle relazioni ricercate, il numero è cresciuto nella On the side of the researched trips, the number has
classe entro i 600 km, mentre ha subito una battuta d’arresto increased below 600 km and decreased for those
per i viaggi sopra i 600 km. Interessante da notare che le beyond 600 km. Interesting to note that the
number of researched services beyond 1000 km
relazioni ricercate sopra i 1000 km hanno visto un
increased close to 20% of the services of the second
consistente aumento, quasi a raggiungere il 20% del totale
semester 2017, similarly to the number of tickets
del secondo semestre 2017, in misura (relativa) analoga al
researched for that distance segment.
numero di biglietti cercati per quel segmento di distanza.
Nel complesso, per entrambi gli indicatori, si può dire che Globally, for both indexes, in 2017 second semester,
con il secondo semestre 2017 le relazioni molto lunghe the very long connections acquired more
(oltre i 1000 km) acquistano peso rispetto alle medie e alle importance with respect to the medium short ones.
brevi. Queste ultime (sotto i 400 km) in termini di biglietti The latter connections (below 400 km) kept their
cercati mantengono una certa importanza (quasi il 25 % importance (about 25% of the share) in terms of
tickets, whereas in terms of routes they faced a
dello share), mentre in termini di relazioni osservano una
reduction. On the opposite, despite an increase of
riduzione. Fenomeno opposto caratterizza le rotte fra i 400
routes searched between 400 and 600 km (with
e i 600 km: ad un aumento di relazioni rispetto al primo
respect to the first semester 2017), there was not
semestre 2017 non corrisponde un aumento di biglietti any increase in tickets.
cercati.
TRASPOL – Politecnico di Milano ||| Checkmybus.it
187 LA CONCORRENZA | COMPETITION
In termini competitivi, il mercato italiano nel secondo In terms of competitiveness, the Italian market in the
semestre del 2017 ha visto una situazione di relativa second semester 2017 has proved to be quite stable.
tranquillità. Il mercato sembra aver già assorbito sia The market seems to have internalized both
Megabus withdrew from the market (whilst Flixbus
l’effetto dell’acquisizione nel 2016 delle rotte di Megabus
acquired the routes) and the merger Busitalia-Simet
da parte di Flixbus (i “new entrant”), sia la fusione
into Busitalia Fast (May 2017). Globally, the market
Busitalia – Simet (Busitalia Fast) che ha visto la nuova
share held by the merging operators was not wide
compagnia debuttare nel maggio 2017 (con risultati enough to influence the HHI.
interessanti). Le quote di marcato di tali operatori non si
sono rivelate tali da modificare visibilmente l’HHI
attraverso la fusione, almeno a livello complessivo.
Nelle figure seguenti valutiamo la concentrazione del The following graphs show the concentration in
settore in termini di transazioni su www.checkmybus.it, terms of transactions on Checkmybus.it, through the
attraverso l’Herfindal-Hirshman Index (HHI), tra le Herfindal-Hirshman Index (HHI among the various
routes considered.
diverse direttrici prese in considerazione.
L’Herfindal-Hirshman Index (HHI) considera le quote di mercato degli operatori in termini di click su www.checkmybus.it sulle diverse rotte e
risulta pari ad 1 se il mercato è concentrato e monopolistico, mentre assume valori minori in presenza di più operatori in competizione. 2016-17
datasets
The Herfindal-Hirshman Index (HHI) considers market shares of the producers in terms of click on www.checkmybus.it on each route and it is
equal to 1 if the market is concentrated and monopolistic, while falls towards 0 if the market is equally fragmented. 2016-17 datasets
La comparazione fra primo e secondo semestre 2017 The differences between first and second semester of
mostra una lieve riduzione del livello di concentrazione 2017 results show a slight reduction of concentration
del mercato. Particolarmente spiccato risulta l’effetto di that is not particularly disruptive, except for South-
TRASPOL – Politecnico di Milano ||| Checkmybus.it
19riduzione della concentrazione sulle rotte sud-sud e più South. It is important to note that for north-north
leggero sulle rotte centro-sud. Da segnalare l’assenza di trips the concentration is the same of the previous
riduzione di concentrazione sulle relazioni nord-nord e semester, while for centre-centre trips concentration
has slightly increased. According to the HHI index,
addirittura un lieve aumento sulle rotte centro-centro. Il
the north-north submarket is the more
nuovo mercato del nord-nord, dove prima non c’era
concentrated, either because it is relatively new - it is
offerta, è il più concentrato perché ha riscosso l’interesse
“the new market” in Italy – (there was no service
soprattutto dei gli operatori più grandi. before the liberalization) and because mostly large
newcomers decided to open new routes there.
In ogni caso, in termini assoluti, l’indice per macroaree è Overall, the HHI is low. In other words operators
basso. In altre parole gli operatori operano chiaramente su run their services on contiguous and overlapping
mercati intercomunicanti e non più nei rigidi perimenti markets, rather than sticking to their original
delle concessioni. concession agreements.
The results presented are the outcome both of the
Questo risultato è probabilmente determinato sia dal reale
improved competition level and the new
livello di competizione, sia dalla nuova metodologia
methodology introduced in the current report.
introdotta in questo report, che ha ridotto la variabilità del
Indeed, the new methodology effectively reduced the
numero di aziende presenti nel campione. In un certo variability of number of companies included in the
senso, anche se si corre il rischio di sottostimare le sample. From one side, we took the risk to
variazioni dell’HHI, la nuova metodologia ritarda l’effetto underestimate the HHI variation, since a new
di “un aumento del numero di aziende sulla piattaforma”. company will appear only whether their routes sell
Pertanto è probabile che l’HHI misuri un livello di in the semester tickets enough to exceed the
concentrazione più elevato (rispetto al passato). In threshold of the minimum number of tickets. But on
sostanza gli effetti di una riduzione di concentrazione the other side, we give account of reduction of
concentration only if the effect lasts for a while and
saranno visibili se effettivamente duraturi nel tempo.
can be perceived by users.
TRASPOL – Politecnico di Milano ||| Checkmybus.it
208 INDICE DEI PREZZI | P RICE INDEX
Il dato elaborato con la nuova metodologia ha richiesto di The new dataset obtained through the new
ricalcolare i prezzi al km osservati nei semestri analizzati methodology required to recalculate the prices per
precedentemente, che riportiamo per poter dare una lettura km observed in the last 2 years. We include here the
new values, in order to make clear the development
della dinamica degli ultimi 2 anni.
of the market.
Long distance services Average price €/km Average weighted price €/km
I semester 2016 0,038 0,038
II semester 2016 0,049 0,048
I semester 2017 0,054 0,053
II semester 2017 0,058 0,058
Esaminando le curve del prezzo medio ponderato mensile In details, the curve of average weighted price per km of
2017 (graph in the next page) clearly appears higher than
del 2016 e del 2017 (grafico pagina seguente) si può notare
that of 2016 in the corresponding observed month for the
che nel 2017 i prezzi medi pesati al km registrati sono whole year. Despite at the beginning of the year the two
decisamente più elevati rispetto ai corrispondenti mesi curves appear similar, the 2017 one “anticipate” the price
dell’anno precedente. Inoltre, benché nei primi mesi le due increase in April (bank holidays). Similarly it happens in
curve mostrino un andamento analogo, la curva 2017 summertime. In November only, there is a downward
change of average weighted prices that bring the curve
“anticipa” lo scalino dell’aumento dei prezzi ad aprile (a
2017 closer to 2016 one.
causa delle festività). In modo similare “l’anticipo” della
crescita dei prezzi avviene anche per quanto riguarda i mesi
estivi. Soltanto a novembre 2017 si può intravvedere una
.
riduzione più marcata dei prezzi medi pesati al km che li
avvicina a quelli registrati a fine 2016.
TRASPOL – Politecnico di Milano ||| Checkmybus.it
21Nel complesso, si può ragionevolmente affermare, la Globally, we can reasonably affirm that the
liberalizzazione non ha condotto ad una strenua liberalization did not lead to a strenuous price
competizione di prezzo fra operatori, quanto un competition between companies, rather to an
increase of the quantities and multiplicity of the
ampliamento della varietà e della quantità dell’offerta.
offers.
Dal Grafico 5 nella pagina successiva è infatti possibile
From the graph 5 in the next page, we notice that in
notare come soltanto le rotte sud-sud nel secondo semestre the second semester 2017 only south-south routes
2017 abbiano subito una sensibile flessione dei prezzi medi reported a decrease in average weighted price per
ponderati. km. On the contrary, the center-north routes were
Al contrario le rotte centro-nord sono quelle che hanno those that always increased their prices achieving an
sempre visto una crescita dei prezzi, raggiungendo un average weighted price of 0,070 euro/km. Similarly,
valore semestrale di medio di oltre 0,070 euro/km. Un center-center routes reached an average weighted
andamento analogo caratterizza le rotte centro-centro con price of 0,069 euro/km.
North-South routes, instead, reached the minimum
un prezzo medio semestrale di 0,069 euro/km.
average weighted price per km for every kind of
Le rotte nord-sud, invece, nel primo semestre 2017 hanno
routes in 18 months during the first semester 2017
visto una riduzione di prezzo fino alla media dei prezzi
(0,039 euro/km). During the second semester,
medi ponderati a livello semestrale di 0,039 Euro/km. Si however, they started rising up to 0,049 euro/km.
tratta del livello minimo per tutte le tipologie di relazione.
Nel semestre corrente, invece, i prezzi sono tornati a salire
fino ai 0,049 Euro/ km.
TRASPOL – Politecnico di Milano ||| Checkmybus.it
22Grafico 5
Ogni cerchio rappresenta una relazione origine-destinazione. La dimensione del punto dipende dal numero di biglietti ricercati sulla piattaforma
Checkmybus.it.
Each circle represents one origin-destination relation. The dimension of the dot depends on the number of researched tickets via Checkmybus.it.
TRASPOL – Politecnico di Milano ||| Checkmybus.it
23Analizzando i prezzi chilometrici medi per rotta in We analysed the average price per km, route by
funzione della distanza del II semestre 2017, si può route in the second semester 2017. It can be noticed
osservare come i prezzi medi osservati decrescano con la how average prices decrease with distance but in a
smoother downward trend respect to 2016 and to
distanza, ma in modo meno marcato rispetto ai due
first semester 2017. In other words the average price
semestri precedenti. In sostanza il livello dei prezzi del II
level of the second semester 2017 is the highest of the
semestre 2017 risulta il più elevato degli ultimi 18 mesi,
last 18 months. However the shape of the curve looks
tuttavia conserva lo stesso andamento dei precedenti. In the same.
particolare è possibile rilevare che i valori medi più How it is possible to observe up to 800 km prices
contenuti si manifestano nello scaglione dei viaggi converge. Already beyond 800 km the prices of
compresi fra 600 km e 800 km. A differenze dei semestri second semester 2017 increased above all the others,
precedenti che vedevano una crescita dei prezzi oltre i 1000 while first semester 2017 and second semester 2016
km, nel secondo semestre 2017 i prezzi riprendono a salire prices raised only for trips beyond 1000 km.
già fra gli 800 e i 1000 km.
That outcome confirms the results of the previous
Questo conferma quanto già risulta dai precedenti report:
reports: on average on average, shorter and more
in media le relazioni più brevi e frequenti, totalizzano
frequent connections, recorded the highest prices
prezzi medi al km fra i più elevati in assoluto e con una per km of the sample with a significant aptitude to
variabilità dei prezzi significativa. Fra queste, le relazioni vary. In particular, North-South connections scored
Nord – Sud registrano il prezzo medio al km più basso in the lowest average price/km (0.034 €/km) whilst the
assoluto (0,034 €/km), mentre il prezzo assoluto più alto è highest price was that of the trips north-north in July
registrato nel mercato interno al nord nel mese di luglio 2017 that reached an average price of 0,085 euro/km.
(0,085 euro/km). All’interno di questo trend generale, però, Overall, the routes beyond 1000 km are more
le rotte con distanze maggiori di 1000 km sono expensive likely because the competition level (intra
and intermodal) in weaker.
relativamente più costose perché il livello di concorrenza
(inter e intramodale) è complessivamente più debole.
TRASPOL – Politecnico di Milano ||| Checkmybus.it
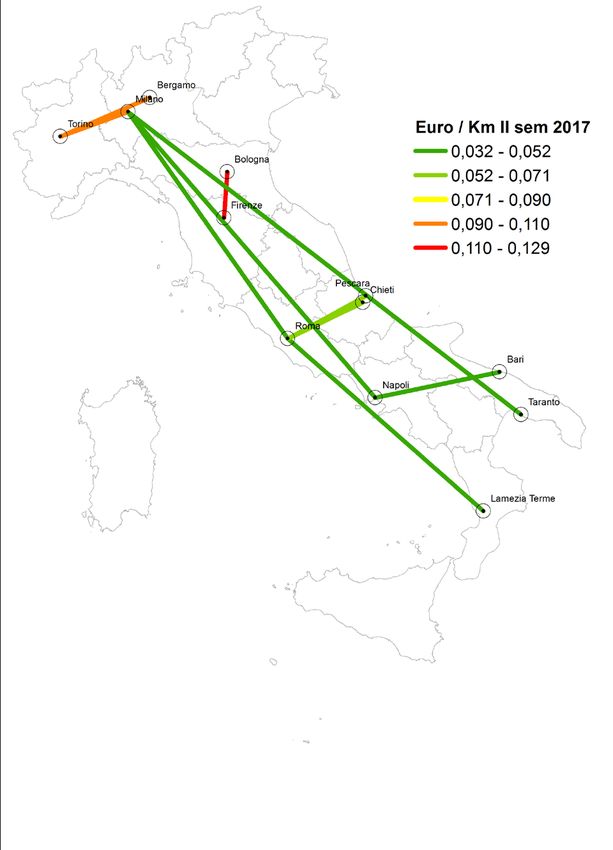
24Infine, la mappa rappresenta le prime dieci relazioni di
lunga percorrenza in termini di biglietti ricercati su
Checkmybus.it e il loro prezzo medio.
Le prime tre rotte (quelle più ricercate) appartengono
alle relazioni nord-nord e centro-nord e totalizzano
prezzi al km fra i più costosi del dataset: Torino-Milano
(0,092 euro / km), Firenze – Bologna (0,129 euro /km)
e Torino - Bergamo (0,94 euro / km). I prezzi di queste
rotte sono in parte influenzate dalla competizione con
l’alta velocità ferroviaria (che mediamente offre prezzi
al km più elevati), dalla distanza medio-breve, e in parte
influenzate dalla presenza di servizi aeroportuali che
contribuiscono a renderle fra le più costose del
panorama.
Le altre rotte della top10 fanno parte del mercato
storico nord-sud (quelle più lunghe ed economiche) -
ad esempio la Napoli – Milano - e di un mercato storico
interno al centro Italia (Roma-Pescara) che essendo più
corte e prive di reale competizione ferroviaria offrono
prezzi più sostenuti.
The map represents the top-ten long distance routes in terms
of researched tickets on chekmybus.it and their average
price. The top-three routes belong to north-north and
centre-north connections. They score the highest prices of
the dataset: Torino- Milano (0,092 euro/km), Firenze –
Bologna (0,129 euro/km) e Torino - Bergamo (0,94
euro/km). Prices are influenced by higher train fares (high
speed trains) and intermodal competition, by the short
distance and by airport link services (the most expensive in
the dataset).
The other routes included in the top-ten belong to the
historical market north-south (the longest and cheaper),
such as Napoli-Milano and the historical market of middle
Italy (with higher prices).
TRASPOL – Politecnico di Milano ||| Checkmybus.it
259 METODOLOGIA | METHODOLOGY
Le elaborazioni presentate in questo documento sono state The elaborations presented in this document have
sviluppate a partire dal database mensile fornito da been developed starting from the monthly database
Checkmybus.it. Il dato si riferisce ai “click” (biglietti provided by Checkmybus.it. The data refer to the
“clicks” (researched tickets) made on the website
ricercati) effettuati sul motore di ricerca Checkmybus.it
Checkmybus.it every month, which are then
ogni mese e reindirizzati verso i siti dei singoli operatori che
redirected towards the website of the single
forniscono il servizio. Comunemente al click corrisponde
operators serving the route. Usually the process ends
un acquisto. Nel dettaglio il database contiene: with the purchase of the ticket. In detail, the database
includes:
- Nome della rotta tra città e città - City to city route name
- Operatori attivi sulla rotta - Operators serving the route
- Numero di biglietti ricercati attraverso Checkmybus.it - Number of researched ticket on
per rotta, nel mese Checkmybus.com per route, per month
- Average price paid, per route and company
- Prezzo medio, per rotta o operatore
Product Operator Quantity Total revenues Average price Month Year
Venice – Istanbul OrientExpress 100 8000,00 80,00 3 2016
Per le analisi sulla concentrazione, i click relativi a reseller In order to perform concentration analysis, we have
sono stati ricodificati associandoli alla compagnia che coded and assigned the resellers’ records to the
opera effettivamente la tratta. 3 actual companies that really operates the route.
Starting from these data, we built another database
A partire da questi dati è stato costruito un ulteriore
containing other attributes that allows different
database contenente altri attributi tali da consentire
analysis. The new database includes records which
differenti analisi. Il nuovo database contiene record
routes exceed the “minimum threshold” of tickets
“filtrati” secondo una “soglia minima” di biglietti sold/researched in the semester.
cercati/venduti per semestre. In particular, each record in the database has
In particolare, ad ogni record nel database sono state information on:
attribuite informazioni su:
- Zip code of the origin and destinations cities
- Codice ISTAT delle città di origine e destinazione - Name of the origin and destination regions
- Nome delle regioni di origine e destinazione - Areas of the country the service is provided (i.e.
North – South, North – North, etc.)
Area del paese tra cui viene offerto il servizio (es. Nord
- Identification of airport services
– Sud, Nord – Nord, etc.)
- Types of services (routes not in Italy, routes
- Individuazione dei servizi aeroportuali
from/to Italy, domestic routes, regional routes)
- Tipi di servizi (cioè rotte fuori dall’ Italia, rotte da/per - Distance between cities (built from the matrix of
l’Italia, rotte domestiche, rotte regionali) distances among municipalities provided by the
Italian National Institute of Statistics)
3
ad es., i biglietti venduti da Ibus-Marino per Marino sono stati attribuiti a Marino.
TRASPOL – Politecnico di Milano ||| Checkmybus.it
26- Distanze tra città (costruito a partire dalla matrice delle - Price per km for each route
distanze tra comuni fornita dall’ISTAT) - Typology of operators divided between non-
- Prezzo al chilometro per ogni rotta Italian bus companies, Italian bus companies or
reseller
- Tipi di operatori suddivisi tra aziende non italiane,
aziende italiane e piattaforme di rivendita di biglietti.
TRASPOL – Politecnico di Milano ||| Checkmybus.it
2710 CONCLUSIONI | FINAL REMARKS
Questo rapporto, preparato in collaborazione con www.checkmybus.it, raccoglie e analizza l’andamento del
mercato degli autobus di lunga percorrenza in Italia nel secondo semestre 2017. Il rapporto è basato sul
campione di prezzi raccolti dalla piattaforma di vendita e descrive il profilo degli utenti delle autolinee, i prezzi
praticati, il livello di concentrazione del mercato, le rotte domestiche principali.
A due anni dall’avvio del monitoraggio è possibile tracciare un quadro che consente di mettere a fuoco alcune
caratteristiche fondamentali di questo mercato. Il primo semestre 2016 si è caratterizzato per la dinamicità del
mercato con l’apertura di nuove rotte, l’entrata di operatori e l’affermarsi di nuove logiche commerciali e di
marketing. Il secondo semestre del 2016 ha mostrato alcuni segnali verso una possibile stabilizzazione e
consolidamento del mercato, pur ancora in espansione. Il primo semestre 2017 ha confermato alcuni trend
dell’anno precedente, mostrando però un aumento generalizzato dei prezzi e per una stagionalità anticipata nel
mese di aprile, che lo hanno reso più simile ad un mese estivo che ad uno primaverile. Nel secondo semestre
2017, i prezzi sono ulteriormente aumentati con un picco estivo e un rallentamento nel mese di novembre.
In sintesi, è possibile evidenziare alcuni fatti principali:
Nel secondo semestre del 2017, il numero di transazioni registrate si è mantenuto di gran lunga al di
sopra rispetto all’inizio del 2016. La variazione di importanza relativa dei singoli sotto-mercati
geografici è dovuto principalmente a un effetto stagionale, ma anche all’espansione del mercato e a
una maggiore penetrazione della piattaforma Checkmybus.it.
Milano, Roma e Napoli sono i tre poli che disegnano la cartina delle ricerche a livello nazionale.
Milano e Roma sono le due metropoli origine e destinazione del maggior numero di ricerche su
Chekmybus.it. Tra le rotte più cercate, la Torino-Milano e la Firenze - Bologna, in diretta
competizione con i servizi ferroviari e la Torino-Bergamo, sostenuta dalla domanda aeroportuale.
Rispetto all’anno precedente, il dato del secondo semestre 2017 presenta una lieve riduzione del
livello di concentrazione in quasi tutti i sotto-mercati. La riduzione è più marcata per le rotte sud-
sud, meno importante sulle altre direttrici, assente sulle rotte nord-nord e centro-centro.
L’indice dei prezzi calcolato sul campione del II semestre 2017 è di 0.058 €/km sull’anno, con
una tendenza all’aumento (la media registrata nel I semestre 2017 è stata 0,053 €/km). In particolare
la dinamica di crescita dei prezzi si è manifestata nel periodo Luglio-Novembre 2017, con una punta
di 0,07 €/km di prezzo medio ponderato sulle rotte centro-centro. Complessivamente si tratta del
quarto semestre in aumento.
L’andamento dei prezzi in funzione della distanza della relazione è decrescente fino a 800 km.
Oltre questa soglia si notano differenze interessanti tra il secondo semestre 2017, il primo del 2017 e
il secondo 2016. I prezzi del secondo semestre 2017, oltre gli 800 km sono più elevati rispetto agli altri
due semestri (anche rispetto al secondo semestre 2016).
In conclusione, due anni di monitoraggio hanno dimostrato che la liberalizzazione non si è tradotta in una mera
concorrenza di prezzo. Al contrario: i prezzi sono cresciuti in due anni di oltre il 50%. Infatti:
• Il mercato si è ristrutturato più volte dimostrandosi vivace. Acquisizioni, fusioni, nuove entrate e uscite
dal mercato hanno segnato l’evoluzione di un settore nel quale anche gli operatori piccoli e medi hanno
dimostrato di essere in grado di competere con gli operatori storici o i newcomers di grandi dimensioni.
TRASPOL – Politecnico di Milano ||| Checkmybus.it
28• L’offerta si è riqualificata e la domanda è cresciuta. Il numero di rotte offerte e il numero di destinazioni
si è ampliato, facendo probabilmente emergere domanda inespressa.
Pertanto secondo le nostre elaborazioni, la liberalizzazione del settore avrebbe condotto ad importanti effetti
positivi sia per gli utenti sia dal punto di vista del settore industriale.
This report, prepared in collaboration with Checkmybus.it, summarizes and analyses the market trend of the long-
distance coach market in Italy in the second semester 2017. The report is based on the sample of prices collected by the
meta-engine platform and describes the profile of the users of these services, the prices, the level of market
concentration, and the main domestic routes.
Thanks to about two years of monitoring, it is possible to draw an overview that defines the main features of this market
sector. A lively market characterized the first semester 2016, with the opening of new routes, the entry of operators and
the rise of new business logic and marketing. The second semester of 2016 showed a trend towards a possible stabilization
of the market even though not steady. The first semester 2017 data showed a similar trend to the previous year, modified
by a general price increase and an anticipated seasonal effect in April (so April data looks like a summer time records). The
second semester 2017 prices grew again with a summertime peak and a slight decline in November.
In summary, it is possible to highlight some facts about the current semester:
In the second semester 2017, the number of transactions on the website has increased with respect to the
beginning of 2016. Furthermore, the importance of the geographical submarkets has changed, depending either
on a seasonal effect, an expansion of the overall market and an increasing penetration of Checkmybus.it.
Milan, Rome and Naples are the three poles that determine the map of researches at nationwide level. Milan and
Naples are the main origin and destination in terms of researched tickets on Checkmybus.it. Among the most
researched routes appears Milan- Turin, Florence - Bologna, although there is a competition with rail services and
Turin – Bergamo due to airport link demand.
The second semester 2017 data on researched tickets shows a slight reduction of market concentration between
types of sub-markets. The reduction is strong on south-south connections, lighter on other connections and absent
on north-north and center-center routes.
The price index calculated on the whole sample (2017) is 0,058 €/km, with a clear growing trend (it was 0.053
€/km in the first semester). In particular, during the period July-November 2017, the price increase appears even
stronger, hitting of 0.07 €/km of average weighted price on center-center routes. Overall is the fourth semester
with a price increase.
The average price trend decreases as the distance increases up to 800 km. Beyond that threshold, the average
price per km of the second semester 2017 significantly diverges by the second semester of 2016 and the first
2017. Prices of the second semester 2017, beyond 800 km are higher with respect to the past.
In conclusion, the two years of monitoring has demonstrated that the liberalization has not turned into a price war.
Instead prices have grown more than 50%. Indeed:
• The market has changed, even radically. Merger, newcomers and new strategies by old companies contributed to
renew a sector. Overall it is demonstrated that the small and large companies can coexist on the same market.
• The supply side has renewed the offer that now is wider than in the past. A “new network” composed by different
routes and destination is offered by various companies to possible users and customers.
Therefore according to our elaborations, the liberalization of long distance coach services brought positive effects both for
users and industrial side.
TRASPOL – Politecnico di Milano ||| Checkmybus.it
29Puoi anche leggere