Metodologia di Exposure Assessment MED HISS - Stefano Bande, Stefania Ghigo Arpa Piemonte
←
→
Trascrizione del contenuto della pagina
Se il tuo browser non visualizza correttamente la pagina, ti preghiamo di leggere il contenuto della pagina quaggiù
Metodologia di Exposure Assessment MED HISS

                     Stefano Bande, Stefania  Ghigo
                                       Arpa Piemonte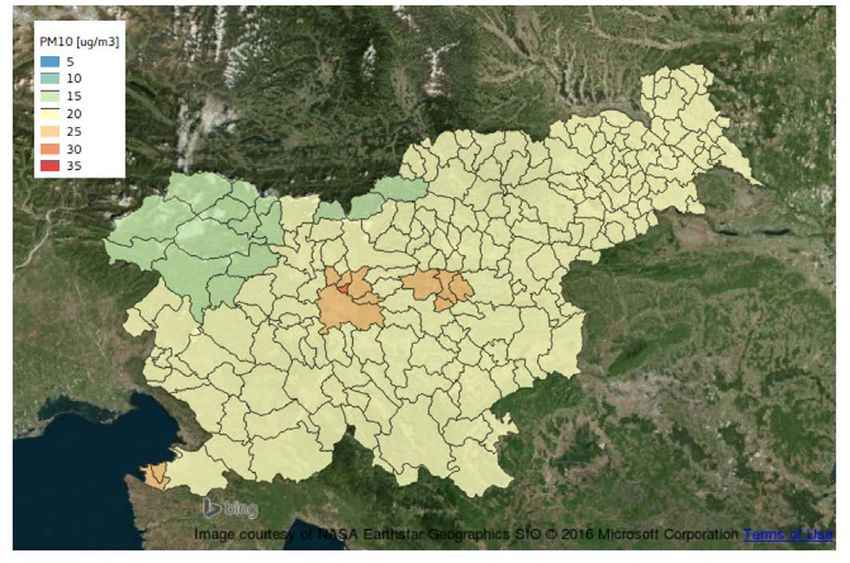
MED HISS, Action B1 Pollutant data mapping
L'obiettivo di questa azione è quello di costruire una mappa dell'inquinamento
atmosferico a livello comunale per ognuno dei paesi partner del progetto MED
HISS utilizzando le due fonti di informazione generalmente disponibili allo stato
dell'arte:
 ➢
  I modelli di simulazione numerica di qualità
 dell'aria
 ➢
     Le reti di monitoraggio di qualità dell'aria

La metodologia adottata fa riferimento a quanto stabilito dalla 2008/50/CE (e D.lgs
155/2010) ed è utilizzata operativamente da ARPA a supporto della valutazione e
previsione della qualità dell'aria, adattata alle specificità progettuali.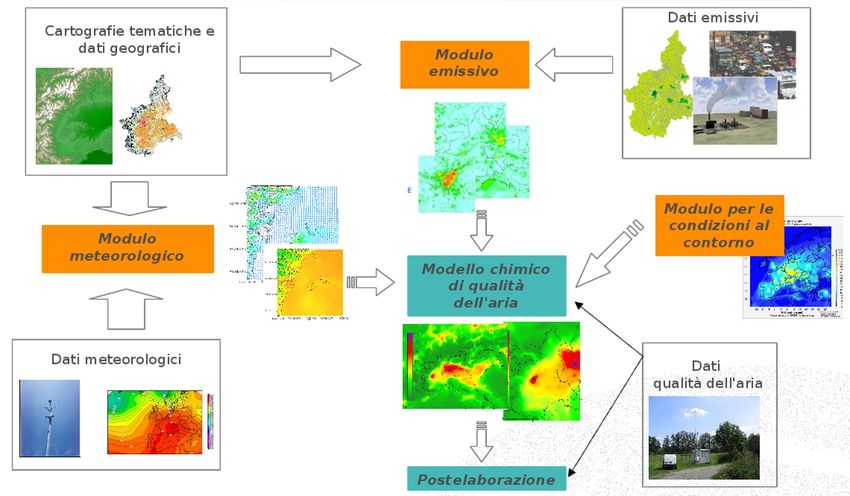
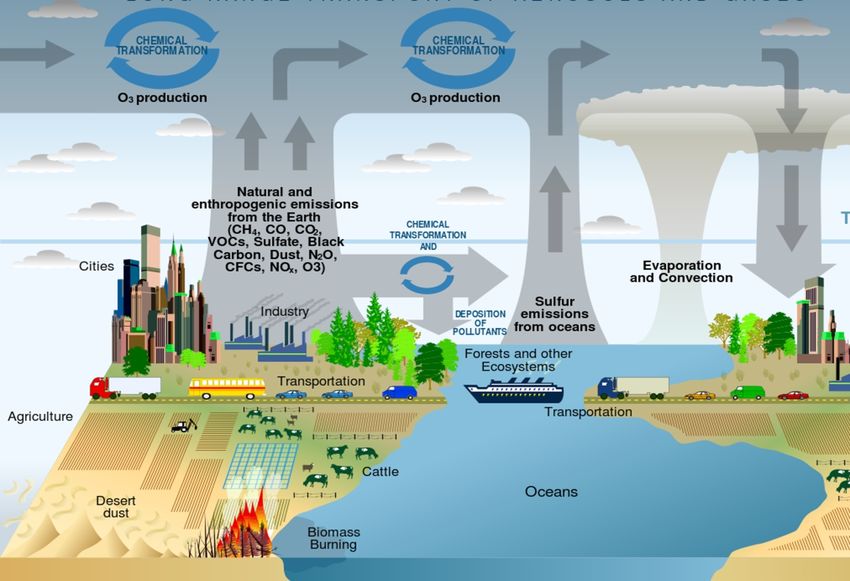
I modelli di chimica e trasporto (CTM)
Modelli matematici che riproducono l'evoluzione degli inquinanti atmosferici emessi in atmosfera
dalle diversi sorgenti antropiche e naturali. Le concentrazioni degli inquinanti sono calcolate in
funzione del tenpo sul dominio di studio considerando i processi chimico-fisici che avvengono in
atmosfera.

Local Event LIFE+ MEDHISS, Torino 07/07/2016

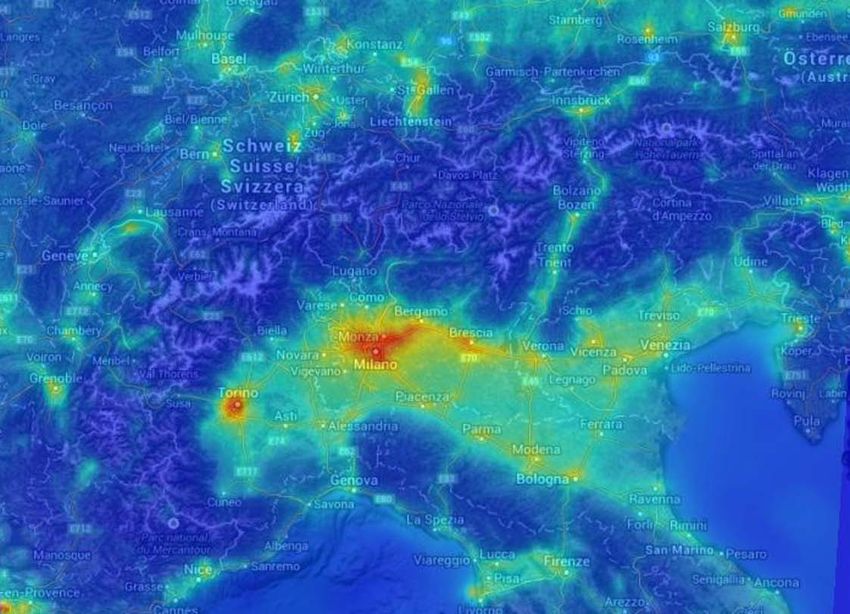
I modelli di chimica e trasporto (CTM)
I modelli di chimica e trasporto (CTM)

NO2, media annua 2012
NO2, media anno 2012

Available data - SPAIN
CALIOPE project (CALIdad del aire Operacional Para España,
http://www.bsc.es/caliope/es) developed and distributed by BSC-CNS
(Departamento de Ciencias de la Tierra del Barcelona Supercomputing Center -
Centro Nacional de Supercomputación )
Simulation domain including the whole of Spain
with 4.4 km of horizontal resolution
CTM model : CMAQ
Pollutant emission: HERMES model
Meteorology: WRF model
Annual mean concentration fields of PM10,
PM2.5, NO2, O3 for years 2009, 2010, 2011, 2012,
2013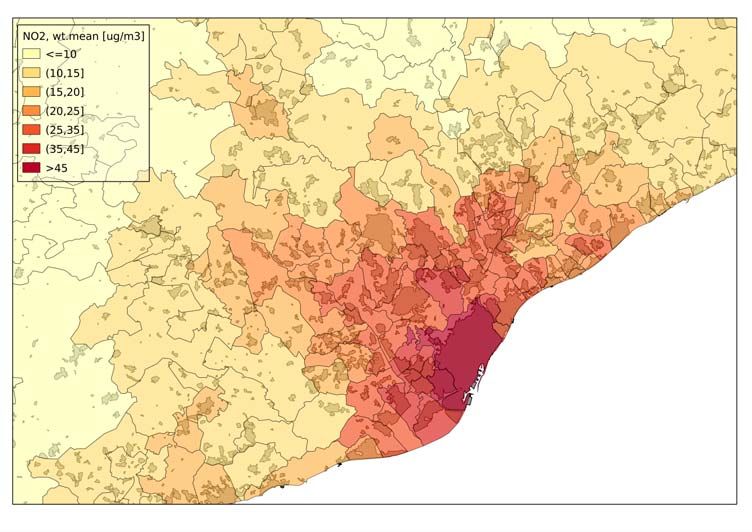
Available data - SPAIN

                                                     NO2     PM10     PM25   O3
Air quality data (monthly and annual         2009    153      94       32    163
mean) of PM10, PM2.5, NO2, O3 for years      2010    172      105      27    175
2009, 2010, 2011, 2012, 2013 provided        2011    178      106      31    179
by BSC-CNS                                   2012    177      108      32    179
                                             2013    168      94       30    171

                                           Only background stations

Cartographic data: municipality boundaries, small area boundaries and
built-up area provided by CREAL
Available data - ITALY
The atmospheric modeling system of MINNI project (National Integrated
Modeling system for International Negotiation on atmospheric pollution,
www.minni.org) developed and distributed by ENEA and MATTM
Simulation domain including the whole of Italy
with 4 km of horizontal resolution
CTM model : FARM
Pollutant emission: EMMA processor
Meteorology: RAMS model
Annual mean concentration fields of PM10,
PM2.5, NO2, O3 for years 1999, 2003, 2005,
2007, 2010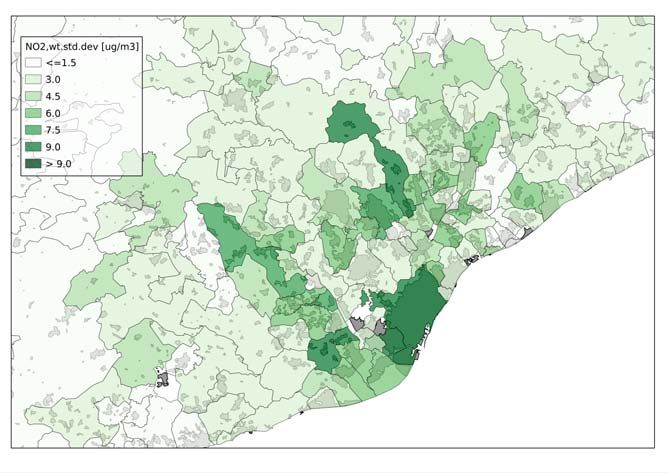
Available data - ITALY

                                                      NO2     PM10    PM25   O3
Air quality data (monthly and annual
                                              1999     43      9       -     32
mean) of PM10, PM2.5, NO2, O3 for years
                                              2003    104      53      -     65
1999, 2003, 2005, 2007, 2010 coming
                                              2005    137      94      1     92
from BRACE database (ISPRA), AirBase
                                              2007    196      136     13    139
database (EEA) and ARPAs database
                                              2010    231      187     80    202

                                           Only background stations

Cartographic data: municipality boundaries and built-up area from ISTAT
(2011) and CORINE LAND COVER
Available data - SLOVENIA

CAMx modeling system developed at the same time of MED HISS project; PM10
annual mean concentration fields at Slovenian grid and municipality level
produced during 2016.

Air quality data (monthly and annual mean) of              NO2       PM10   PM25   O3

PM10, PM2.5, NO2, O3 for years 2011, 2012 and      2011          5     10      3        9

2013 provided by Slovenian environmental           2012          5     12      3        9

agency.                                            2013          6     12      3        9
                                                Only background stations

Cartographic data: municipality boundaries and built-up area provided by
Slovenian environmental agency.
Integrazione tra modelli e misure EEA Tech,10/2011, The application of models under the European Union's Air Quality Directive: A technical reference guide ETC/ACM Tech. 2011/15, Guide on modelling Nitrogen Dioxide (NO2) for air quality assessment and planning FAIRMODE (Forum for AIR quality MODelling in Europe), Working Group 1 Assessment, http://fairmode.jrc.ec.europa.eu/wg1.html
Integrazione tra modelli e misure, data fusion
Italian data fusion: Kriging with external drift (KED)1
In order to provide more reliable data to be used in MED HISS project two different
data fusion methods were tested best performance with the geostatistical
approach Kriging with external drift.
Kriging is applied on the observed data and the external drift is constituted by the
MINNI concentrations fields.
For every site si the corrected concentrations value yi
y ( si ) =μ ( si ) +w ( s i ) +ε i
where:
μ(si) is the deterministic trend component,
w(si) is a spatial zero-mean stationary Gaussian random process with spatial
correlation function ρ,
εi is the error term with variance τ2 (nugget).
(1) Van de Kassteele J, Stein A, Dekkers A, Velders G. (2009), External drift kriging of NOx concentrations with dispersion model output in a reduced air quality,
monitoring network. Environmental and Ecological Statistics; 16 (3): 321-339.ITALIA- data fusion
I dati di qualità dell'aria sono stati integrati nel modello MINNI utilizzando il Kriging in
deriva esterna (KED).
PM10, NO2 per gli anni 2003,2005,2007,2010.
Sono stati utilizzati solo i dati provenienti
da stazioni classificate come fondo
(rappresentative della risoluzione del
modello, 4km)
Nella procedura di kriging è stata
introdotta l'orografia come covariata
aggiuntiva per tenere conto della
complessità orografica del territorio
Il KDE è stato applicato su tre differenti
domini (Italia, centro-nord e centro sud)
Cross-validazione leave-one-out per
valutare i risultatiItalian data fusion: KED results
NO2 scatter-plots for years 2007 and
2010
PM10 scatter-plots for years 2007 and
2010
Blue filled circle: leave-one-out cross-
validation results at monitoring
station locations
Red filled circle: MINNI output at
monitoring station locationsItalian data fusion: KED results
NO2 bar-plots for
years 2005 and
2007
Annual mean
partitioned by
number of
municipality
inhabitants
PM10 bar-plots for
years 2005 and
2007Dalla griglia di simulazione al territorio comunale La concentrazione simulata rappresenta il Nelle valutazioni della qualità dell'aria valore medio dell'inquinante sulla cella del spesso ci si deve riferire a unità territoriali grigliato di calcolo e/o amministrative.
Dalla griglia di simulazione al territorio comunale
Si attribuisce al comune un valore di concentrazione che dipende sia dai valore
simulati nelle celle di calcolo sia dalle caratteristiche del territorio comunale che
ricade nelle celle in esame.

                                    La concentrazione media è calcolata come media pesata
                                    dei valori simulati sulle npi celle che interessano il
                                    comune in esame

                                    Ed i pesi sono dati dalla percentuale di area edificata in
                                    ogni cella rispetto al totale di superfice comunale edificata
ITALIA- exposure assessment NO2 media annuale KED su griglia (2010) NO2 media annuale KED a livello comunale (2010)
ITALIA- exposure assessment
PM10 media annuale KED su griglia (2010),   PM10 media annuale KED a livello comunale
Nord Italia                                 (2010), Nord Italia
Remarks
Summarizing:
- these dispersion modeling systems correctly reproduces concentration mean levels
typical of urban background stations, consistent with the adopted resolution (4 km),
- the systems underestimate observed levels at traffic stations, that are phenomena
occurring at scales that can not be solved at the adopted spatial resolution (not
even with a geo-statistical post-processing),
- up-scaling from gridded data to municipality level produces a datum consistent with
the starting one but it amplifies the inability to capture spatial variations of small
scale possible exposure misclassification given the large within-city contrasts (it
is necessary to pay attention to plane sensitivity analyses within the
epidemiological study in order to verify the presence of bias),
- these results are consistent with those reported in literature on the use of air quality
dispersion models for epidemiological purpose3.
(3) Aguilera I., Basagana X., Pay M.T., Agis D., Bouso L., Foraster M., Rivera M., Baldasano J.M., Kunzli N. (2013), Evaluation of the CALIOPE
air quality forecasting system for epidemiological research: The example of NO2 in the province of Girona (Spain). Atmospheric Environment;
72: 134-141.Kick Off meeting LIFE+ Roma – 8 Novembre 2013 – Sala dell’Aranciera di San Sisto
Spanish pollutant data
CALIOPE model outputs provided by
CREAL were already integrated with
air quality monitoring data.

In this talk we show a brief analysis using
annualCALIOPE
           scores model     outputs provided
                    of background       stations by CREAL are already assimilated.
only, In   this talk
       following  theweair show    an exploratory
                            pollution  mapping      analysis using annual scores of
       background
protocol             stations
            established        only,
                          during     following
                                    MED    HISSthe air pollution mapping protocol.
project.

Note     that  comparison       between
observations and dispersion model
outputs were done extrapolating values
from CALIOPE concentration fields at the
same coordinates of monitoring sites.

Final Conference LIFE+ MED HISS, Torino September 13th, 2016
Spanish pollutant data
NO2 scatter-plots for years 2010 and
2013
PM10 scatter-plots for years 2010 and
2013
Final Conference LIFE+ MED HISS, Torino September 13th, 2016Spanish pollutant data
NO2 bar-plots for
years 2011 and
2012
Annual mean
partitioned by
number of
municipality
inhabitants
PM10 bar-plots for
years 2011 and
2012
Final Conference LIFE+ MED HISS, Torino September 13th, 2016Spanish pollutant data: NO2 exposure assessment on small areas
NO2 Barcelona small area, year 2013
n wt.mean wt.sd min Q1 Q2 Q3 max mean sd
14 45.9 7.68 30.3 33.4 38.1 43.6 59.3 40.1 8.43
Final Conference LIFE+ MED HISS, Torino September 13th, 2016Italian pollutant data: PM10 exposure assessment PM10 concentrations at grid level on northern PM10 concentrations up-scaled at municipality Italy domain (2010) level (2010) Final Conference LIFE+ MED HISS, Torino September 13th, 2016
Slovenian pollutant data: PM10 exposure assessment

                Slovenian PM10 concentrations up-scaled at municipality level (2011)

Final Conference LIFE+ MED HISS, Torino September 13th, 2016
Puoi anche leggere