Il termometro dei mercati finanziari (12 Luglio 2019) - FinRiskAlert
←
→
Trascrizione del contenuto della pagina
Se il tuo browser non visualizza correttamente la pagina, ti preghiamo di leggere il contenuto della pagina quaggiù
13/07/2019 | 28/Newsletter

Il termometro dei mercati                                                 calcolata sulle opzioni at-the-money sull’indice Eurostoxx a
                                                                          scadenza 3 mesi;

finanziari (12 Luglio 2019)                                               Rendimento borsa ITA/Europa: differenza tra il rendimento
                                                                          settimanale della borsa italiana e quello delle borse
a cura di Emilio Barucci e Daniele Marazzina                              europee, calcolato sugli indici FTSEMIB e Eurostoxx;
                                                                          Spread ITA/GER: differenza tra i tassi di interesse italiani e
13/07/2019 10:01
                                                                          tedeschi a 10 anni;
                                                                          Spread EU/GER: differenza media tra i tassi di interesse dei
                                                                          principali paesi europei (Francia, Belgio, Spagna, Italia,
                                                                          Olanda) e quelli tedeschi a 10 anni;
L’iniziativa di Finriskalert.it “Il termometro dei mercati
                                                                          Euro/dollaro: tasso di cambio euro/dollaro;
finanziari” vuole presentare un indicatore settimanale sul grado
di turbolenza/tensione dei mercati finanziari, con particolare            Spread US/GER 10Y: spread tra i tassi di interesse degli
attenzione all’Italia.                                                    Stati Uniti e quelli tedeschi con scadenza 10 anni;
                                                                          Prezzo Oro: quotazione dell’oro (in USD)
                                                                          Spread 10Y/2Y Euro Swap Curve: differenza del tasso della
                                                                          curva EURO ZONE IRS 3M a 10Y e 2Y;
                                                                          Euribor 6M: tasso euribor a 6 mesi.

                                                                     I colori sono assegnati in un’ottica VaR: se il valore riportato è
                                                                     superiore (inferiore) al quantile al 15%, il colore utilizzato è
                                                                     l’arancione. Se il valore riportato è superiore (inferiore) al
                                                                     quantile al 5% il colore utilizzato è il rosso. La banda (verso l’alto
                                                                     o verso il basso) viene selezionata, a seconda dell’indicatore,
                                                                     nella direzione dell’instabilità del mercato. I quantili vengono
                                                                     ricostruiti prendendo la serie storica di un anno di osservazioni:
                                                                     ad esempio, un valore in una casella rossa significa che
                                                                     appartiene al 5% dei valori meno positivi riscontrati nell’ultimo
                                                                     anno. Per le prime tre voci della sezione “Politica Monetaria”, le
                                                                     bande per definire il colore sono simmetriche (valori in positivo e
                                                                     in negativo). I dati riportati provengono dal database Thomson
Significato degli indicatori                                         Reuters. Infine, la tendenza mostra la dinamica in atto e viene
                                                                     rappresentata dalle frecce: ↑,↓, ↔ indicano rispettivamente
     Rendimento borsa italiana: rendimento settimanale               miglioramento, peggioramento, stabilità rispetto alla rilevazione
     dell’indice della borsa italiana FTSEMIB;                       precedente.
     Volatilità implicita borsa italiana: volatilità implicita       Disclaimer: Le informazioni contenute in questa pagina sono
     calcolata considerando le opzioni at-the-money sul FTSEMIB      esclusivamente a scopo informativo e per uso personale. Le
     a 3 mesi;                                                       informazioni possono essere modificate da finriskalert.it in
     Future borsa italiana: valore del future sul FTSEMIB;           qualsiasi momento e senza preavviso. Finriskalert.it non può
     CDS principali banche 10Ysub: CDS medio delle                   fornire alcuna garanzia in merito all’affidabilità, completezza,
     obbligazioni subordinate a 10 anni delle principali banche      esattezza ed attualità dei dati riportati e, pertanto, non assume
     italiane (Unicredit, Intesa San Paolo, MPS, Banco BPM);         alcuna responsabilità per qualsiasi danno legato all’uso, proprio
                                                                     o improprio delle informazioni contenute in questa pagina. I
     Tasso di interesse ITA 2Y: tasso di interesse costruito sulla
                                                                     contenuti presenti in questa pagina non devono in alcun modo
     curva dei BTP con scadenza a due anni;
                                                                     essere intesi come consigli finanziari, economici, giuridici, fiscali
     Spread ITA 10Y/2Y : differenza del tasso di interesse dei       o di altra natura e nessuna decisione d’investimento o qualsiasi
     BTP a 10 anni e a 2 anni;                                       altra decisione deve essere presa unicamente sulla base di questi
     Rendimento borsa europea: rendimento settimanale                dati.
     dell’indice delle borse europee Eurostoxx;
     Volatilità implicita borsa europea: volatilità implicita

© 2019 www.finriskalert.it - Tutti i diritti riservati.                                                                       Pagina 1
Il termometro dei mercati                                                  tedeschi a 10 anni;
                                                                           Spread EU/GER: differenza media tra i tassi di interesse dei
finanziari (5 Luglio 2019)                                                 principali paesi europei (Francia, Belgio, Spagna, Italia,
                                                                           Olanda) e quelli tedeschi a 10 anni;
a cura di Emilio Barucci e Daniele Marazzina
                                                                           Euro/dollaro: tasso di cambio euro/dollaro;

06/07/2019 08:34                                                           Spread US/GER 10Y: spread tra i tassi di interesse degli
                                                                           Stati Uniti e quelli tedeschi con scadenza 10 anni;
                                                                           Prezzo Oro: quotazione dell’oro (in USD)
                                                                           Spread 10Y/2Y Euro Swap Curve: differenza del tasso della
L’iniziativa di Finriskalert.it “Il termometro dei mercati                 curva EURO ZONE IRS 3M a 10Y e 2Y;
finanziari” vuole presentare un indicatore settimanale sul grado           Euribor 6M: tasso euribor a 6 mesi.
di turbolenza/tensione dei mercati finanziari, con particolare
attenzione all’Italia.
                                                                      Il termometro dei mercati
                                                                      finanziari (28 Giugno 2019)
                                                                      a cura di Emilio Barucci e Daniele Marazzina

                                                                      30/06/2019 17:21

                                                                      L’iniziativa di Finriskalert.it “Il termometro dei mercati
                                                                      finanziari” vuole presentare un indicatore settimanale sul grado
                                                                      di turbolenza/tensione dei mercati finanziari, con particolare
                                                                      attenzione all’Italia.

Significato degli indicatori

     Rendimento borsa italiana: rendimento settimanale
     dell’indice della borsa italiana FTSEMIB;
     Volatilità implicita borsa italiana: volatilità implicita
     calcolata considerando le opzioni at-the-money sul FTSEMIB
     a 3 mesi;
     Future borsa italiana: valore del future sul FTSEMIB;
     CDS principali banche 10Ysub: CDS medio delle
     obbligazioni subordinate a 10 anni delle principali banche
     italiane (Unicredit, Intesa San Paolo, MPS, Banco BPM);
     Tasso di interesse ITA 2Y: tasso di interesse costruito sulla
     curva dei BTP con scadenza a due anni;
                                                                      Significato degli indicatori
     Spread ITA 10Y/2Y : differenza del tasso di interesse dei
     BTP a 10 anni e a 2 anni;                                             Rendimento borsa italiana: rendimento settimanale
     Rendimento borsa europea: rendimento settimanale                      dell’indice della borsa italiana FTSEMIB;
     dell’indice delle borse europee Eurostoxx;                            Volatilità implicita borsa italiana: volatilità implicita
     Volatilità implicita borsa europea: volatilità implicita              calcolata considerando le opzioni at-the-money sul FTSEMIB
     calcolata sulle opzioni at-the-money sull’indice Eurostoxx a          a 3 mesi;
     scadenza 3 mesi;                                                      Future borsa italiana: valore del future sul FTSEMIB;
     Rendimento borsa ITA/Europa: differenza tra il rendimento             CDS principali banche 10Ysub: CDS medio delle
     settimanale della borsa italiana e quello delle borse                 obbligazioni subordinate a 10 anni delle principali banche
     europee, calcolato sugli indici FTSEMIB e Eurostoxx;                  italiane (Unicredit, Intesa San Paolo, MPS, Banco BPM);
     Spread ITA/GER: differenza tra i tassi di interesse italiani e        Tasso di interesse ITA 2Y: tasso di interesse costruito sulla

© 2019 www.finriskalert.it - Tutti i diritti riservati.                                                                      Pagina 2
curva dei BTP con scadenza a due anni;
                                                                         a cura di Emilio Barucci e Daniele Marazzina
     Spread ITA 10Y/2Y : differenza del tasso di interesse dei
     BTP a 10 anni e a 2 anni;                                           22/06/2019 10:49

     Rendimento borsa europea: rendimento settimanale
     dell’indice delle borse europee Eurostoxx;
     Volatilità implicita borsa europea: volatilità implicita
     calcolata sulle opzioni at-the-money sull’indice Eurostoxx a        L’iniziativa di Finriskalert.it “Il termometro dei mercati
     scadenza 3 mesi;                                                    finanziari” vuole presentare un indicatore settimanale sul grado
     Rendimento borsa ITA/Europa: differenza tra il rendimento           di turbolenza/tensione dei mercati finanziari, con particolare
     settimanale della borsa italiana e quello delle borse               attenzione all’Italia.
     europee, calcolato sugli indici FTSEMIB e Eurostoxx;
     Spread ITA/GER: differenza tra i tassi di interesse italiani e
     tedeschi a 10 anni;
     Spread EU/GER: differenza media tra i tassi di interesse dei
     principali paesi europei (Francia, Belgio, Spagna, Italia,
     Olanda) e quelli tedeschi a 10 anni;
     Euro/dollaro: tasso di cambio euro/dollaro;
     Spread US/GER 10Y: spread tra i tassi di interesse degli
     Stati Uniti e quelli tedeschi con scadenza 10 anni;
     Prezzo Oro: quotazione dell’oro (in USD)
     Spread 10Y/2Y Euro Swap Curve: differenza del tasso della
     curva EURO ZONE IRS 3M a 10Y e 2Y;
     Euribor 6M: tasso euribor a 6 mesi.

I colori sono assegnati in un’ottica VaR: se il valore riportato è
superiore (inferiore) al quantile al 15%, il colore utilizzato è
l’arancione. Se il valore riportato è superiore (inferiore) al
quantile al 5% il colore utilizzato è il rosso. La banda (verso l’alto   Significato degli indicatori
o verso il basso) viene selezionata, a seconda dell’indicatore,
nella direzione dell’instabilità del mercato. I quantili vengono              Rendimento borsa italiana: rendimento settimanale
ricostruiti prendendo la serie storica di un anno di osservazioni:            dell’indice della borsa italiana FTSEMIB;
ad esempio, un valore in una casella rossa significa che                      Volatilità implicita borsa italiana: volatilità implicita
appartiene al 5% dei valori meno positivi riscontrati nell’ultimo             calcolata considerando le opzioni at-the-money sul FTSEMIB
anno. Per le prime tre voci della sezione “Politica Monetaria”, le            a 3 mesi;
bande per definire il colore sono simmetriche (valori in positivo e           Future borsa italiana: valore del future sul FTSEMIB;
in negativo). I dati riportati provengono dal database Thomson
                                                                              CDS principali banche 10Ysub: CDS medio delle
Reuters. Infine, la tendenza mostra la dinamica in atto e viene
                                                                              obbligazioni subordinate a 10 anni delle principali banche
rappresentata dalle frecce: ↑,↓, ↔ indicano rispettivamente
                                                                              italiane (Unicredit, Intesa San Paolo, MPS, Banco BPM);
miglioramento, peggioramento, stabilità rispetto alla rilevazione
precedente.                                                                   Tasso di interesse ITA 2Y: tasso di interesse costruito sulla
                                                                              curva dei BTP con scadenza a due anni;
Disclaimer: Le informazioni contenute in questa pagina sono
                                                                              Spread ITA 10Y/2Y : differenza del tasso di interesse dei
esclusivamente a scopo informativo e per uso personale. Le
                                                                              BTP a 10 anni e a 2 anni;
informazioni possono essere modificate da finriskalert.it in
qualsiasi momento e senza preavviso. Finriskalert.it non può                  Rendimento borsa europea: rendimento settimanale
fornire alcuna garanzia in merito all’affidabilità, completezza,              dell’indice delle borse europee Eurostoxx;
esattezza ed attualità dei dati riportati e, pertanto, non assume             Volatilità implicita borsa europea: volatilità implicita
alcuna responsabilità per qualsiasi danno legato all’uso, proprio             calcolata sulle opzioni at-the-money sull’indice Eurostoxx a
o improprio delle informazioni contenute in questa pagina. I                  scadenza 3 mesi;
contenuti presenti in questa pagina non devono in alcun modo
                                                                              Rendimento borsa ITA/Europa: differenza tra il rendimento
essere intesi come consigli finanziari, economici, giuridici, fiscali
                                                                              settimanale della borsa italiana e quello delle borse
o di altra natura e nessuna decisione d’investimento o qualsiasi
                                                                              europee, calcolato sugli indici FTSEMIB e Eurostoxx;
altra decisione deve essere presa unicamente sulla base di questi
dati.                                                                         Spread ITA/GER: differenza tra i tassi di interesse italiani e
                                                                              tedeschi a 10 anni;

Il termometro dei mercati                                                     Spread EU/GER: differenza media tra i tassi di interesse dei
                                                                              principali paesi europei (Francia, Belgio, Spagna, Italia,
finanziari (21 Giugno 2019)                                                   Olanda) e quelli tedeschi a 10 anni;

© 2019 www.finriskalert.it - Tutti i diritti riservati.                                                                         Pagina 3
Euro/dollaro: tasso di cambio euro/dollaro;
     Spread US/GER 10Y: spread tra i tassi di interesse degli
     Stati Uniti e quelli tedeschi con scadenza 10 anni;
     Prezzo Oro: quotazione dell’oro (in USD)
     Spread 10Y/2Y Euro Swap Curve: differenza del tasso della
     curva EURO ZONE IRS 3M a 10Y e 2Y;
     Euribor 6M: tasso euribor a 6 mesi.

I colori sono assegnati in un’ottica VaR: se il valore riportato è
superiore (inferiore) al quantile al 15%, il colore utilizzato è
l’arancione. Se il valore riportato è superiore (inferiore) al
quantile al 5% il colore utilizzato è il rosso. La banda (verso l’alto
o verso il basso) viene selezionata, a seconda dell’indicatore,
nella direzione dell’instabilità del mercato. I quantili vengono
ricostruiti prendendo la serie storica di un anno di osservazioni:
ad esempio, un valore in una casella rossa significa che
appartiene al 5% dei valori meno positivi riscontrati nell’ultimo
anno. Per le prime tre voci della sezione “Politica Monetaria”, le       Significato degli indicatori
bande per definire il colore sono simmetriche (valori in positivo e
in negativo). I dati riportati provengono dal database Thomson                Rendimento borsa italiana: rendimento settimanale
Reuters. Infine, la tendenza mostra la dinamica in atto e viene               dell’indice della borsa italiana FTSEMIB;
rappresentata dalle frecce: ↑,↓, ↔ indicano rispettivamente                   Volatilità implicita borsa italiana: volatilità implicita
miglioramento, peggioramento, stabilità rispetto alla rilevazione             calcolata considerando le opzioni at-the-money sul FTSEMIB
precedente.                                                                   a 3 mesi;

Disclaimer: Le informazioni contenute in questa pagina sono                   Future borsa italiana: valore del future sul FTSEMIB;
esclusivamente a scopo informativo e per uso personale. Le                    CDS principali banche 10Ysub: CDS medio delle
informazioni possono essere modificate da finriskalert.it in                  obbligazioni subordinate a 10 anni delle principali banche
qualsiasi momento e senza preavviso. Finriskalert.it non può                  italiane (Unicredit, Intesa San Paolo, MPS, Banco BPM);
fornire alcuna garanzia in merito all’affidabilità, completezza,
                                                                              Tasso di interesse ITA 2Y: tasso di interesse costruito sulla
esattezza ed attualità dei dati riportati e, pertanto, non assume
                                                                              curva dei BTP con scadenza a due anni;
alcuna responsabilità per qualsiasi danno legato all’uso, proprio
o improprio delle informazioni contenute in questa pagina. I                  Spread ITA 10Y/2Y : differenza del tasso di interesse dei
contenuti presenti in questa pagina non devono in alcun modo                  BTP a 10 anni e a 2 anni;
essere intesi come consigli finanziari, economici, giuridici, fiscali         Rendimento borsa europea: rendimento settimanale
o di altra natura e nessuna decisione d’investimento o qualsiasi              dell’indice delle borse europee Eurostoxx;
altra decisione deve essere presa unicamente sulla base di questi             Volatilità implicita borsa europea: volatilità implicita
dati.                                                                         calcolata sulle opzioni at-the-money sull’indice Eurostoxx a
                                                                              scadenza 3 mesi;
Il termometro dei mercati                                                     Rendimento borsa ITA/Europa: differenza tra il rendimento

finanziari (14 Giugno 2019)                                                   settimanale della borsa italiana e quello delle borse
                                                                              europee, calcolato sugli indici FTSEMIB e Eurostoxx;
a cura di Emilio Barucci e Daniele Marazzina                                  Spread ITA/GER: differenza tra i tassi di interesse italiani e
                                                                              tedeschi a 10 anni;
15/06/2019 15:03
                                                                              Spread EU/GER: differenza media tra i tassi di interesse dei
                                                                              principali paesi europei (Francia, Belgio, Spagna, Italia,
                                                                              Olanda) e quelli tedeschi a 10 anni;
                                                                              Euro/dollaro: tasso di cambio euro/dollaro;
L’iniziativa di Finriskalert.it “Il termometro dei mercati                    Spread US/GER 10Y: spread tra i tassi di interesse degli
finanziari” vuole presentare un indicatore settimanale sul grado              Stati Uniti e quelli tedeschi con scadenza 10 anni;
di turbolenza/tensione dei mercati finanziari, con particolare
                                                                              Prezzo Oro: quotazione dell’oro (in USD)
attenzione all’Italia.
                                                                              Spread 10Y/2Y Euro Swap Curve: differenza del tasso della
                                                                              curva EURO ZONE IRS 3M a 10Y e 2Y;
                                                                              Euribor 6M: tasso euribor a 6 mesi.

                                                                         I colori sono assegnati in un’ottica VaR: se il valore riportato è
                                                                         superiore (inferiore) al quantile al 15%, il colore utilizzato è
                                                                         l’arancione. Se il valore riportato è superiore (inferiore) al

© 2019 www.finriskalert.it - Tutti i diritti riservati.                                                                            Pagina 4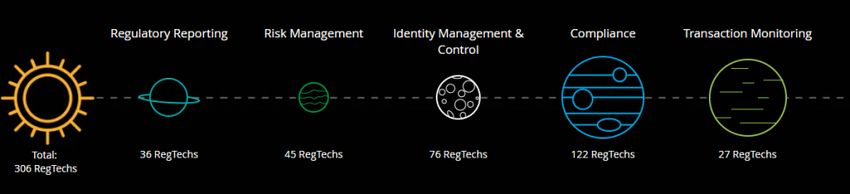
quantile al 5% il colore utilizzato è il rosso. La banda (verso l’alto   Significato degli indicatori
o verso il basso) viene selezionata, a seconda dell’indicatore,
nella direzione dell’instabilità del mercato. I quantili vengono              Rendimento borsa italiana: rendimento settimanale
ricostruiti prendendo la serie storica di un anno di osservazioni:            dell’indice della borsa italiana FTSEMIB;
ad esempio, un valore in una casella rossa significa che                      Volatilità implicita borsa italiana: volatilità implicita
appartiene al 5% dei valori meno positivi riscontrati nell’ultimo             calcolata considerando le opzioni at-the-money sul FTSEMIB
anno. Per le prime tre voci della sezione “Politica Monetaria”, le            a 3 mesi;
bande per definire il colore sono simmetriche (valori in positivo e
                                                                              Future borsa italiana: valore del future sul FTSEMIB;
in negativo). I dati riportati provengono dal database Thomson
Reuters. Infine, la tendenza mostra la dinamica in atto e viene               CDS principali banche 10Ysub: CDS medio delle
rappresentata dalle frecce: ↑,↓, ↔ indicano rispettivamente                   obbligazioni subordinate a 10 anni delle principali banche
miglioramento, peggioramento, stabilità rispetto alla rilevazione             italiane (Unicredit, Intesa San Paolo, MPS, Banco BPM);
precedente.                                                                   Tasso di interesse ITA 2Y: tasso di interesse costruito sulla
                                                                              curva dei BTP con scadenza a due anni;
Disclaimer: Le informazioni contenute in questa pagina sono
esclusivamente a scopo informativo e per uso personale. Le                    Spread ITA 10Y/2Y : differenza del tasso di interesse dei
informazioni possono essere modificate da finriskalert.it in                  BTP a 10 anni e a 2 anni;
qualsiasi momento e senza preavviso. Finriskalert.it non può                  Rendimento borsa europea: rendimento settimanale
fornire alcuna garanzia in merito all’affidabilità, completezza,              dell’indice delle borse europee Eurostoxx;
esattezza ed attualità dei dati riportati e, pertanto, non assume
                                                                              Volatilità implicita borsa europea: volatilità implicita
alcuna responsabilità per qualsiasi danno legato all’uso, proprio
                                                                              calcolata sulle opzioni at-the-money sull’indice Eurostoxx a
o improprio delle informazioni contenute in questa pagina. I
                                                                              scadenza 3 mesi;
contenuti presenti in questa pagina non devono in alcun modo
essere intesi come consigli finanziari, economici, giuridici, fiscali         Rendimento borsa ITA/Europa: differenza tra il rendimento
o di altra natura e nessuna decisione d’investimento o qualsiasi              settimanale della borsa italiana e quello delle borse
altra decisione deve essere presa unicamente sulla base di questi             europee, calcolato sugli indici FTSEMIB e Eurostoxx;
dati.                                                                         Spread ITA/GER: differenza tra i tassi di interesse italiani e
                                                                              tedeschi a 10 anni;

Il termometro dei mercati                                                     Spread EU/GER: differenza media tra i tassi di interesse dei
                                                                              principali paesi europei (Francia, Belgio, Spagna, Italia,
finanziari (7 Giugno 2019)                                                    Olanda) e quelli tedeschi a 10 anni;

a cura di Emilio Barucci e Daniele Marazzina                                  Euro/dollaro: tasso di cambio euro/dollaro;
                                                                              Spread US/GER 10Y: spread tra i tassi di interesse degli
08/06/2019 10:38                                                              Stati Uniti e quelli tedeschi con scadenza 10 anni;
                                                                              Prezzo Oro: quotazione dell’oro (in USD)
                                                                              Spread 10Y/2Y Euro Swap Curve: differenza del tasso della
                                                                              curva EURO ZONE IRS 3M a 10Y e 2Y;
L’iniziativa di Finriskalert.it “Il termometro dei mercati                    Euribor 6M: tasso euribor a 6 mesi.
finanziari” vuole presentare un indicatore settimanale sul grado
di turbolenza/tensione dei mercati finanziari, con particolare           I colori sono assegnati in un’ottica VaR: se il valore riportato è
attenzione all’Italia.                                                   superiore (inferiore) al quantile al 15%, il colore utilizzato è
                                                                         l’arancione. Se il valore riportato è superiore (inferiore) al
                                                                         quantile al 5% il colore utilizzato è il rosso. La banda (verso l’alto
                                                                         o verso il basso) viene selezionata, a seconda dell’indicatore,
                                                                         nella direzione dell’instabilità del mercato. I quantili vengono
                                                                         ricostruiti prendendo la serie storica di un anno di osservazioni:
                                                                         ad esempio, un valore in una casella rossa significa che
                                                                         appartiene al 5% dei valori meno positivi riscontrati nell’ultimo
                                                                         anno. Per le prime tre voci della sezione “Politica Monetaria”, le
                                                                         bande per definire il colore sono simmetriche (valori in positivo e
                                                                         in negativo). I dati riportati provengono dal database Thomson
                                                                         Reuters. Infine, la tendenza mostra la dinamica in atto e viene
                                                                         rappresentata dalle frecce: ↑,↓, ↔ indicano rispettivamente
                                                                         miglioramento, peggioramento, stabilità rispetto alla rilevazione
                                                                         precedente.

                                                                         Disclaimer: Le informazioni contenute in questa pagina sono
                                                                         esclusivamente a scopo informativo e per uso personale. Le
                                                                         informazioni possono essere modificate da finriskalert.it in
                                                                         qualsiasi momento e senza preavviso. Finriskalert.it non può

© 2019 www.finriskalert.it - Tutti i diritti riservati.                                                                           Pagina 5
fornire alcuna garanzia in merito all’affidabilità, completezza,
esattezza ed attualità dei dati riportati e, pertanto, non assume
alcuna responsabilità per qualsiasi danno legato all’uso, proprio
o improprio delle informazioni contenute in questa pagina. I
contenuti presenti in questa pagina non devono in alcun modo
essere intesi come consigli finanziari, economici, giuridici, fiscali
o di altra natura e nessuna decisione d’investimento o qualsiasi
altra decisione deve essere presa unicamente sulla base di questi
dati.
Does the identikit of
European banks tend to
underestimate the model Chart 1. Incidence of active derivatives
Source: CER calculations on Mediobanca Data
risk? Deutsche Bank is the bank with the greatest presence of L2 and
a cura di Fabiano Salvio L3 in its portfolio: in 2014, around 51% of total assets, to then
decrease in 2017 to 44%, a level that is still on the increase
12/07/2019 11:22 compared to the previous year (chart2). Barclays and RBS follow.
Italian banks are not particularly inclined to invest in L2 and L3
European banks are still experiencing a difficult situation, also instruments. Both Unicredit and Intesa-San Paolo hold a
dictated by the political-economic tone we are experiencing percentage of the total assets among the lowest in the sample.
recently, the CER has focused on the problem in its Banking
Report N.1 2018, based on 2014–2016 data, however in this From the Mediobanca data relating to 2016 it appears that the
article the analysis compared to the report it was also extended L3 instruments consist almost 30% of derivative securities,
to 2017. 24.5% of equity securities and mutual funds, 20% of debt
securities, 13.7% of loans and 12 .1% from other assets.
Analyzing a sample proposed by Mediobanca, consisting of about
20 larger European banks, we can see which are the business
models that characterize the banks of the old continent and the
composition of their assets in the portfolio. The analysis was
carried out over the 2014–2017 four-year period. The total
average assets of the sample amounted to 1,070 billion euros in
2017. The largest banking group is HSBC, with total assets of
2,192 billion euros. Overall, the 21 banking institutions hold
assets of 1,900 trillion euros. The average ROE in the four-year
period considered was 4.2%.
The German banks (25%), Nordea (24%) and Barclays (22%) are
the ones that show the highest values(chart 1). The heaviest
incidences are observed for Unicredit, Groupe BPCE and ING
Group. The two Italian groups considered in the number, namely
Unicredit and Intesa-San Paolo, have taken an incidence of 6%
and 7%. Chart 2. Incidence of 2nd and 3rd level assets
Source: CER calculations on Mediobanca Data
Even more interesting and third level. These financial
instruments are illiquid and opaque, having complex structures
and prices that are difficult to recognize. These parameters are
not compatible with the standards. To take account of these
valuation uncertainties, the accounting rules impose greater
provisions and deductions from capital (additional valuation
adjustments, AVA) for these instruments. However, adjustments
are not calculated at the individual instrument level.
Furthermore, the L3 instruments are more disadvantaged than
the L2 ones, it is an incentive to hold this second form of activity.
© 2019 www.finriskalert.it - Tutti i diritti riservati. Pagina 6Chart 3. Incidence of Loans
Source: CER calculations on Mediobanca Data
Ultimately, analyzing the incidence of riskier assets shows a
particularly heterogeneous situation. German and French banks
have invested heavily in L2 and L3 instruments. Another group of
banks, including the Italian ones, seems to suffer due to
non-performing loans. Anglo-Saxon banks, on the other hand,
operate in a framework in which both impaired loans and more Chart.5 Systemic risk, complex financial assets and NPL
complex financial assets are present in their financial (data for the 2014–2017 period)
statements. Finally, the remaining part of the institutions Notes: sample of the top 20 significant banks in Europe. RISK
appears to have particularly prudent asset management, as expressed in% of the total sample.
evidenced by the low incidence of riskier assets. Source: CER calculations on Mediobanca Data
Possible impacts of business choices on systemic risk The relationship between the share of the L2 and L3 instruments
and that of systemic risk is strictly positive, which confirms that
The economic and financial debate today is very focused on the the impact of an eventual collapse of an institution, caused by
possible systemic impacts, in this regard the Mediobanca problems deriving from excessive financial risks assumed, can
database has been integrated with the information provided by have a serious impact on the whole market, jeopardizing its
the New York University Ster Volatility Lab. Specifically, the stability.
SRISK has been considered, indicator expresses the quantity of
systemic risk connected with each listed company. The On the other hand, the relationship between the share of NPLs
percentage share of SRISK with respect to the total of the sample and that of systemic risk is slightly negative, highlighting that
was therefore calculated for each bank. credit risk has no significant impact on global financial stability.
From the data of the NYU Stern Volatility Lab emerges as the The undervaluation of market risk could have significant effects
banks with the greatest systemic impact, in 2017, are Bnp on the financial system. In fact, there does not appear to be a
Paribas, with a share of systemic risk of 14%, and Deutsche Bank relationship between the SRISK share and the CET 1 ratio, a sign
(13% chart.4). that the greater systemic risk does not push bank managers to
hold more capital for the purposes of complying with the Basel
This is followed by Barclays, Crédit Agricole and Société requirements (chart 6). The fact that systemic risk is not
Generale. Unicredit and Intesa San Paolo account for 3.9% and adequately computed among the risks managed by European
3% of the largest banks respectively. banks can be observed by looking at the relationship with the
ratio between CET1 and total assets (an improper leverage
ratio). In this case the relationship is even negative: those with
more systemic risk have a lower proportion of good quality
capital than the total assets. This implies that if the financial
markets slow down significantly, the banks most exposed to the
L2 and L3 instruments would quickly exhaust their capital
endowment.
Chart 4. Incidence of systemic risk in systemically Chart.6 Systemic risk and capital endowment (data for the
important European banks period 2014–2017)
Source: CER calculations on Mediobanca Data Notes: sample of the top 20 significant banks in Europe. RISK
Overall, the systemic risk of European banks attributable to expressed in% of the total sample.
French banks is 39%, 19% for the British, 16% for the German, Source: CER calculations on Mediobanca Data
8% for the Spanish 7% for the Italian, 5% for the Swiss. This theme is strongly in line with the modern economic debate
The same percentage share of the total of the sample was and recently the hypothesis of a possible merger between
calculated for the most risk activities that characterize the Unicredit and Commerzbank was born (the first hypothesis that
business model based on credit and finance, or NPL, on the one the merger between Deutsche Bank and Commerzbank was
hand, and L2 and L3 instruments, on the other. By relating this avoided), but the merger between high banks impact (in Italy for
information to that relating to systemic risk, for the period Unicredit and on a large scale for Commerzbank) and with
2014–2017, there are important indications (chart 5). different business models (Commerzbank has a strong presence
on its balance sheet levels 2 and fully concentrates its business
model on finance, Unicredit instead on credit) is a solution to be
© 2019 www.finriskalert.it - Tutti i diritti riservati. Pagina 7adopted? Managing Regulators: Respond to regulatory
requirements with timeliness, protecting both the brand and
However, the regulatory authorities do not seem to worry about
reputation;
this, taking advantage of the concept “too big to fail”
Compliance Strategy: Lead the strategic decision-making
At 2017, for Commerzbank the percentage of derivatives on total process from a regulatory compliance standpoint;
assets stood at 20%, while for Unicredit the share was much
Compliance Operations: Reduce compliance costs by
lower (6%). For second and third level activities (highly opaque
promoting transparency and managing inefficiencies in
and with a very high degree of risk), the percentage of total
paper-driven processes;
assets at 2017 was 16% for Commerzbank and 8% for Unicredit.
The dynamics is completely reversed, while if we consider the Consumer Protection: Implement new solutions to
NPLs, on the total loans the Unicredit share at 2017 was 4% enhance customers’ protection.
(down compared to 2014 8%), for the German group instead, the
Current compliance tools used by financial institutions are
value barely touched the 1%.
gradually reducing the capability to meet regulatory demands.
Can be seen from the previous analysis, the 2 and 3 level Therefore, in order to gather, analyze and compute all the
activities have a very different systemic impact, compared to the required data, financial institutions are using a variety of IT
NPL systems and are increasing manual processes and the related
operational risks.
Concluding:
A key issue is clearly arising: “how can a financial institution
The regulatory authorities should have a very strong role in the
address compliance in a more efficient and less
hypothetical merger between these two groups, and in particular
resource-consuming manner while improving the quality of data
to understand if the merger will have positive returns or if
reported to regulatory supervisory authorities?” Within FinTech
instead we only risk creating a “systemic giant”.
ecosystem there are a group of companies focused on meeting
The following analysis shows how the potential stresses facing regulatory demands through innovative technologies: the
the banks should not be underestimated, in fact in this regard RegTech Universe.
the EBA introduced the benchmark models for the 2018 stress
RegTech Universe
test to verify the consistency of the results obtained by the
institutes from their assessments internal. The EBA has not gone
“RegTech (Regulatory Technology) is a subset of FinTech that
as the Federal Reserve to establish homogeneous parameters for
focuses on technologies that may facilitate the delivery of
all banks, but uses these models only to highlight anomalies.
regulatory requirements more efficiently and effectively than
However, the benchmark models will be used to estimate credit
existing capabilities”.
risk, thus leaving open the possibility of manipulating market
risk.
References:
1. Banca d’Italia, Relazione annuale per il 2017, maggio 2018;
Banca d’Italia, “Risks and challenges of complex financial
instruments: an analysis of SSM banks”;
Deloitte is constantly mapping the FinTech ecosystem and has
Mediobanca R&S;
created the RegTech Universe where we are compiling a list of
RegTech companies along with the technologies and solutions
NY Stern Volatility Lab;
they are offering:
Rapporto Banche n.1 2018. https://www2.deloitte.com/lu/en/pages/technology/articles/regtec
h-companies-compliance.html
RegTech: Get Onboarding Deloitte research on the RegTech Universe is an ongoing
exercise where we classify the regTech solutions in 5 key areas:
The challenges of 1. Regulatory Reporting: Enable automated data distribution
compliance and regulatory reporting through big data analysis, real
time and cloud reports.
a cura di Deloitte
2. Risk Management: Detect regulatory and compliance
06/07/2019 08:29 risks, assess exposure to risk and anticipate future threats.
3. Identity Management & Control: Facilitate counterparty
The regulatory context is constantly changing: since 2012, over due diligence and Know Your Customer (KYC) procedures.
50,000 regulations have been published throughout the G20. AML and anti-fraud screening and detection. .
In this regulatory landscape, compliance functions are facing 4. Compliance: Real time monitoring and tracking of current
some key challenges: state of compliance and upcoming regulations
© 2019 www.finriskalert.it - Tutti i diritti riservati. Pagina 85. Transaction Monitoring: Solutions for real time High integration costs
transaction monitoring and auditing. Long and uncertain maintenance times
Regulatory Pressures
Increasingly frequent inspections by Supervisory Authority
More sophisticated control techniques
Analytical tools capable of identifying compliance risks
Considering the 5 key areas of RegTech Universe, Deloitte has (including RegTech tools)
developed a RegTech platform, exploiting the knowledge and
Confusing Vendor Landscape
expertise on technological enablers, gained through the EMEA
Deloitte’s Centers of Excellence:
Too many vendors cause confusion
1. RPA: Application of programmed software to perform Financial institutions struggle to identify suitable partners
repetitive and rule-based tasks;
Data and Analytics
2. Artificial Intelligence: Technology that reproduces logical
thinking normally requiring human intelligence; Inappropriate data management
3. Blockchain: Technologies used to track and speed up the Interpretation of increasingly complex data
transaction lifecycle;
4. Big data & analytics: Tools and real time techniques that Reporting
improve decision-making processes, starting from
Localized reports, unsuccessful handling of
heterogeneous data;
centrally-managed reports
5. IoT: Technologies that allow the internet connection of
different types of devices in order to monitor, control and Manual Processes
transfer information, and then perform subsequent actions.
Complicated manual procedures increase the possibility of
Through the abovementioned enablers, RegTech introduces for error
the first time the following elements:
People are encouraged to ignore controls
Agility: Cluttered and intertwined data sets can be
The ability to cope with these issues is mandatory and RegTech
de-coupled and organized through ETL (Extract, Transfer,
companies may help Financial Institutions: the key success factor
Load) technologies;
of RegTech versus “traditional solutions” is agility. The activities
Speed: Reports can be configured and generated quickly; and processes covered by RegTech solutions go beyond
Integration: Short timeframes to get solution up and regulatory reporting and is constantly increasing (e.g. see 5
running; RegTech Universe areas) and they all have one feature in
common: the targeting of a very specific niche.
Analytics: RegTech uses analytic tools to intelligently mine
existing “big data” data sets and unlock their true potential Digital onboarding for financial services
e.g. using the same data for multiple purposes.
“Identity Management and control” is one of the categories in
the “RegTech Universe” which horizontally contains all the
issues considered.
Digital onboarding enables a new and personalized customer
experience by simplifying the access to financial services while
reducing processing time and cost for financial institutions due
to optimized procedures:
Improved Customer Experience
Create faster and more flexible access to banking
services
Be perceived as innovative and reinforce brand image
Regtech: Niche solution
Reduce document loss
Regtech companies are therefore trying to exploit technological Reduce paper usage
innovation to meet regulatory demands whilst complexity
Reduced Cost/Income Ratio
Financial Institutions have to manage is increasing:
Reduce cost-to-serve
Digitalization
Improve sales effectiveness
Complex IT Architecture Reduce failed client acquisitions
© 2019 www.finriskalert.it - Tutti i diritti riservati. Pagina 9Automate and accelerate processes to enhance Authorities) and the NCBs (National Central Banks).
operational efficiency and to reduce operational costs
Because of the integrated reported approach, Data Quality (DQ)
Three key reasons for Financial Institutions to invest on digital is crucial in any data management process: data reported by the
customer onboarding: insurance undertakings are used by both NSAs in the review
process, whose outcome is then submitted to EIOPA, and by most
1. Customer expectations in a mobile-first era. Consumers NCBs to fill in the insurance corporation statistics, delivered to
are increasingly mobile-first and have already set the bar the ECB. This leads to a need of a common understanding of the
high in terms of their expectations as regards speed, minimum level of DQ required.
convenience, and security. To win in this competitive
By agreeing on common minimum standards, all authorities have
landscape Financial Institutions must offer top class UX
aligned their expectations for the minimum acceptable level of
combined with robust evidence that security and privacy are
DQ for the purposes of the different uses of data. The common
paramount.
minimum standards specify:
2. Meeting regulatory requirements. As fraud becomes
more and more sophisticated Financial Institutions may The request of revision
leverage RegTech solutions such as Digital ID to meet D
The synchronization
verification regulation.
The timeliness
3. Benefits in ROI and Operational Cost Savings.
The explanatory notes and notices
Digitisation of KYC capabilities may generate tangible cost
savings for financial institutions, due to a significant The need for historical revision
reduction in manual verification processes.
[1] The common minimum standards should not prevent stricter
Curently there are several “niche solutions” in RegTech practices from being applied at national level: the NSAs/NCBs
ecosystem that offer both complete solutions (covering the still have the responsibility and the power to request that
customer’s entire onboarding process) and partial solutions financial institutions revise data when necessary. As the XBRL
(specific to a part of the process, i.e. Mifid). validations cannot cover all DQ issues, it may happen that, after
deeper controls carried out by the insurance undertakings
Key findings themselves, data may be occasionally submitted a second time.
Resubmissions are divided into (a) “revisions” (if data points
RegTech providers/solutions may help Financial Institution in
have changed) and (b) “duplications” (if there are no changes in
meeting compliance adherence in an “agile way”. These tech —
the data points, but duplications have been fixed).
enabled solutions will deliver transformation of Regulatory
Operations but in order to reach the full potential Financial [2] The synchronisation states that the same data have to be
Institutions must have the capabilities: available at all levels (i.e. financial institutions, NSAs/NCBs,
EIOPA, ECB) at all times: it is important to keep consistency
to scan the ecosystem and choose the solution that best fits between EIOPA’s Central Repository, the ECB’s statistical
with their specific needs; databases and NSA/NCB databases. Any revision of data should
to fully integrate the solution into the their organization be carried out at all levels of the transmission chain so that all
(processes and IT systems). parties involved have the same data. Data should not be
unilaterally modified at the NCB or NCA level, unless in
Autori: exceptional cases (identification of wrong data and impossibility
to fix them by the financial institution due to time restrictions).
Piovan Diego– Partner Deloitte Risk Advisory
[3] NSAs and NCBs shall send the revisions respectively to
Pirondini David – Partner Deloitte Risk Advisory
EIOPA and the ECB in a timely manner, reducing time pressure
Vidussi Alessandro – Partner Deloitte Consulting for business users who need high-quality and stable data on
specific dates. Specifically:
Common minimum NSAs shall send the data to EIOPA within 1 week from the
standards on DQ agreed by receiving or according to established schedules, but at least
once per month.
EIOPA, ECB, NSAs and NCBs shall send the data to ECB as quickly as possible and
at maximum before the closing of the next production
NCBs period
a cura di Silvia Dell’Acqua
[4] NSAs and NCBs shall send a note explaining what trigger the
revision of aggregated data in case of all non-routine revisions
30/06/2019 17:11
and significant routine revisions. In case of DQ issues reported
by individual entities, the NSAs shall either use the erroneous
Last 13.06.2019 EIOPA (European Insurance and Occupational
flag available in the XML metadata file of the EIOPA Central
Pensions Authority) and ECB (European Central Bank) published
Repository Specification or email EIOPA to informing of the need
the Common Minimum Standards for Data Revisions agreed
for revision.
between themselves, the NSAs (National Supervisory
© 2019 www.finriskalert.it - Tutti i diritti riservati. Pagina 10[5] Back data should be revised at least as far back as technically Liability Value Adjustment (LLVA). The latter quantity is
possible, given the operational limitations of the data collection somehow similar to the more common Debit Value Adjustment
infrastructure, where an issue is identified and supposed to lead (DVA), in that it affects the value of the contract in the opposite
to significant revisions, which could also affect the past. direction than the CVA; nonetheless it cannot be considered as
equivalent to the DVA for many reasons that we thoroughly
Ә%
discuss in Castagna [3].
Advances in Incremental Only the value of a contract can be incremental. The concept of
incremental price is meaningless, because the price cannot
Valuation of Financial include all the incremental valuations referring to the parties
involved in the transaction, or two generic parties that would
Contracts and Definition of trade in that contract if the price is only a quote not yet dealt.
Clearly we are not saying here that the two parties do not
the Economic Meaning of consider their own incremental value when bargaining before
the Capital Value closing the deal at the agreed price: on the contrary, they will try
to push the price as near as possible to the (likely diverging)
Adjustment ( KVA ) — Part I values they assign to the contract. The effectiveness of this effort
depends on the relative bargaining strength existing between the
a cura di Antonio Castagna two parties.
The reference system, with respect to which the bank evaluates
22/06/2019 14:30
the incremental impact of the new contract it trades, should be
We extend the analysis we sketched in Castagna [4] and we the economic value of the bank to its shareholders. In fact,
provide an application of the framework we introduced to shareholders are the last claimants on the residual value of the
incrementally evaluate financial contracts within a financial assets, so that the value to them clashes with the ultimate value
institution’s balance sheet. of the bank, after having considered the payment of all the other
stakeholders that have a higher grade in the claimants’ order.
1 Introduction The only way to compute this value is to jointly evaluate all the
assets and liabilities (investments, securities, contracts, etc.),
In Castagna [4] we sketched a framework to evaluate a contract taking into account the limited liability that is granted to the
inserted within the balance sheet of a financial institution. The shareholders, to come up with the net wealth of the bank. We
main result of that work is the importance to assess the impact would like to stress the fact that if the shareholders directly, or
that the contract’s insertion in the bank’s books causes in terms (as it is usually the case) the bank’s management indirectly,
of changes of the value of the bank. This is tantamount to saying miximise the bank’s value, they are also acting in the best
that a contract has a value to the bank that equals its interest of all other senior claimants to the assets’ value (e.g.:
incremental (or marginal) contribution to the total net value of bond holders, depositors, etc.). The present work is a two-part
the bank. article. In the current first part, we will lay out a general
The first consequence of this approach is that the (incremental) framework to calculate the bank’s value. The framework allows
value to the bank is a subjective quantity that does not need to to shed some light also on the economic meaning of the Capital
be that same as the price quoted and dealt in the market. The Value Adjustment (KVA) of a contract.
difference between price and value of a contract is a concept that In the second part of the article, we will show how to apply the
we stressed in Castagna [3] and [2]: For an evaluator that is a framework to the evaluation of a contract that is inserted in the
hedger/replicator, the price of a (derivative) contract is just the existing bank’s balance sheet and how to properly compute the
payment terms that both parties agree upon when closing the xVAs quantities. Finally, we will see how to conciliate the
deal; the value of the same (derivative) contract is the present apparently theoretical unsound market practices to evaluate
value of the costs paid to replicate the intermediate and final derivative contracts, and the nowadays standard results of the
pay-off until the expiry, which in turn is the incremental change modern financial theory, namely the Modigliani-Miller (MM)
in the total hedger/replicator’s net value. theorem (see Modigliani and Miller, [9]).
The second consequence is that the valuation should be correctly The analytical details of the results presented below can be
operated by considering the existing balance sheet structure. found in an extended version of this work, available at
The main result from the analysis in Castagna [3] is that, if the www.iasonltd.com in the research section.
contract is sufficiently small so that it does not alter (for practical
purposes) the probability of default of the evaluator (bank), then 2 A Continuous-Time Setting for Incremental Valuation of
the approximated value can be fairly considered as the Financial Contracts
equivalent to the algebraic sum of the value of i) an otherwise
identical risk-free contract (the “pure” value”), ii) the Credit In order to generalise the discrete-time setting sketched in
Value Adjustment CVA and iii) the Funding Value Adjustment Castagna [3], we needto work in a general equilibrium
FVA referring to the same contract. If the contract has a large framework, since it is not generally possible to determine a
notional so that it changes the evaluator’s default probability, single equivalent probability measure based on a no-arbitrage
then the value has to be determined in a more precise fashion by argument that relies on a dynamic replication. We will refer to
algebraically adding to the sum above the term iv) Limited that one outlined in Cox, Ingersoll and Ross (CIR, [5]), although
© 2019 www.finriskalert.it - Tutti i diritti riservati. Pagina 11we relax some of its assumptions. Namely, we will work in an free rate r as it is typically the case when the expectation is
economy where a single good is produced by means of N taken under the risk neutral measure Q.
production technologies whose transformation process is
i.e.: when the dynamics of the risk factors are risk neutral. To
governed by a system of stochastic processes.
account for the error made in discounting with the risk free rate
Each technology is affected by K state variables Yk (with k= pay-offs that depend on real world dynamics of the risk factors,
{1.….K} ), whose evolution too is governed by a system of we add an adjustment equal to the risk-premia for all risk factors,
stochastic variables. referring to each contingent claim in the assets and in the
liabilities of the bank’s balance sheet.
There is a single interest rate r at which a fixed number of
economic agents may borrow or lend but, differently from CIR We have now to examine two possible cases when the banks buys
[5], we allow for the default of the borrower, which means that an assets, or issue debt.
the terminal pay-off of a loan includes the expected losses due to
the borrowers’ default. Finally, another assumption of CIR [5] we The Bank is Price Taker
relax is that all economic agents have an identical utility function
Let us assume that the bank buys all assets in the market and it
à la Neumann-Morgenstern: we consider a specific utility
has no greater bargaining power than any other agent. In this
function for each economic agent and a general utility function
case, the bank must accept the prices set by the market for all
that can be seen as a sort of average of the single agents’ utility
the assets it buys. The bank funds the purchase of the assets by
functions.
issuing debt claims whose price is also set by the creditors, and it
The possibility to have different utility functions allows the passively has to accept it since it has no bargaining power. This
presence of different risk-premia over the risk free rate r within assumption implies that the drift of each asset is determined by
the expected yield of the contingent claims possibly traded in the the market with no possibility for the bank to affect it. The same
economy, whose pay-offs may depend on the K state variable and reasoning can be applied also to debt claims in the liabilities.
the wealth of a single agent, or of the entire economy aggregate
wealth. The relaxing of the assumptions of the CIR [5] setting are
necessary to distinguish between the fair (objective) price of a
contract (contingent claim) and its (subjective) value.
Let us consider the value of the bank to shareholders at time t,
VB(t): assuming that in the banks’ balance sheet there are I
assets Ai(t), cash B(t) and J liabilities (debt) Lj(t), the evolution of
the value of the bank can be written as:
The dynamics of all three components is stochastic. As such, the
dynamics of the bank value can be described by a general SDE:
In conclusion, when the bank has to issue debt claims whose
price is set by the market, it will pay twice the risk-premium: the
risk-premium embedded in the price required by the buyers
(creditors of the bank), and the risk-premium that the bank has
Assuming that any financial contract depend on the K risk factors
not been able to include in the price. While for the assets the
and that the cash is invested at the risk-free rate r, which is a
market’s and bank’s risk-premia are affecting the total bank
variable that depends on the stochastic factors as well, it can be
value only for the net difference, for the liabilities the difference
shown[1] that
is actually a sum of two risk-premia (since they must have
opposite signs) and as such acting on an aggregated basis on the
bank value.
The Bank is Price Maker
Let us assume that the bank is able to set the price when buying
assets and when issuing new debt. In this circumstances, the
price should be such that it embed a risk-premium such that the
bank value at least does not decline after the inclusion of the new
Some comments are in order: the expectation in Equation (4) is asset, or new liability, in the bank’s balance sheet.
taken under the real world measure P , which means that all the
drifts of the risk factors Yk are those of the real world dynamics.
It should be noted that the discounting is operated with the risk
© 2019 www.finriskalert.it - Tutti i diritti riservati. Pagina 12consistently derived within an equilibrium framework such as the
one above). When one wants to compute the bank’s value under
the risk-neutral measure, the inclusion of the KVA is not
consistent, unless the adjustment includes only the difference
between the bank’s and the market’s risk-premia, in which case
Equation (4) becomes:
2.1 An Interpretation of the KVA
The Capital Value Adjustment (KVA) is the most recent item of
the list of adjustments to the “pure” value of a contract, and it
has been analysed by several authors: for an excellent review of
the matter, and the regulatory and managerial concerns that
originate the need for such adjustment, we refer to Prampolini • the remuneration of the Economic Capital is given by only the
and Morini [10] and the bibliography therein, which contains all risk-premia embedded in the assets, cash (bank account) and
the relevant literature at the time of writing. liabilities, either set by the market or by the bank depending on
the bank’s bargaining power in each case. This result in in
striking contrast with all the literature publicly available at the
time of writing (see the point above), where the remuneration
encompasses the entire return on the contracts in the balance
sheet. This will produce a double counting of the risk-free rate
within the calculation of the bank’s value, which will also imply a
wrong adjustment if the bank is able to set a contract’s price.
Our result descends from the general equilibrium framework and
is valid in the case the value is computed under the real-world
measure, otherwise the inclusion of the KVA adjustment is quite
untenabale;
• the risk-premium of the equity capital is a weighted average of
the risk-premia of the different items of the balance-sheet: when
the bank has pricing power, it can require a premium
proportional to the risk of the contract and the incremental
Economic Capital needed to preserve the same probability of
default of the bank. Pricing based on RAROC criteria are
common choices, lately suggested also in Prampolini and Morini
[10] and Brigo et al.[1];
The framework that we have sketched above can be used in
practice to evaluate the impact of a new contract inserted in the
bank’s balance sheet, or: the incremental value of the contract to
the bank. We will show how to do that in the second part of the
article.
It is the adjustment in the evaluation formula (4) when the equity References
capital is set in such a way that it matches the Economic Capital
[1] D. Brigo, M. Francischello, and A. Pallavicini. An indifference
as defined above. Some considerations are in order:
approach to the cost of capital constraints: Kva and beyond.
• the definition of Economic Capital given above can be applied available at arxiv.org, 2017.
both to risk-based measure (e.g.: simulation models applied to
[2] A. Castagna. On the dynamic replication of the DVA: Do banks
the bank’s balance sheet) and non-risk-based measures (e.g.:
hedge their debit value adjustment or their destroying value
regulatory formulae): for a discussion of both types of measures,
adjustment? Iason research paper. Available at
see Prampolini and Morini [10];
http://iasonltd.com/resources.php, 2012.
• the KVA is consistently computed only under the real-world
[3] A. Castagna. Pricing of derivatives contracts under collateral
measure P and it is discounted with the risk-free rate: these are
agreements: Liquidity and funding value adjustments. Iason
not assumptions or choices arbitrarily made, but both are
research paper. Available at http://iasonltd.com/resources.php,
naturally derived from the framework sketched above (different
2012.
discount factors can be found in Prampolini and Morini [10],
Kjaer [8], Brigo et al.[1], Green et al. [7]: in some cases the [4] A. Castagna. Towards a theory of internal valuation and
discount factors include the intensity of default of the transfer pricing of products in a bank: Funding, credit risk and
counterparty and of the bank, in any case they are not economic capital. Iason research paper. Available at
© 2019 www.finriskalert.it - Tutti i diritti riservati. Pagina 13Puoi anche leggere