Global Opportunity Team - Cogliere le opportunità, gestendo il rischio - Morgan Stanley
←
→
Trascrizione del contenuto della pagina
Se il tuo browser non visualizza correttamente la pagina, ti preghiamo di leggere il contenuto della pagina quaggiù

Global Opportunity Team
  Cogliere le opportunità, gestendo il rischio

   31 marzo 2020

                                             PLEASE REFER TO THE DISTRIBUTION DISCLOSURES IN RISKS AND DISCLOSURES FOR ADDITIONAL INFORMATION.
CRC 3104661 Exp. 04/30/2021              FOR PROFESSIONAL CLIENTS ONLY. NOT FOR ONWARD DISTRIBUTION. MAY NOT BE USED WITH THE GENERAL PUBLIC.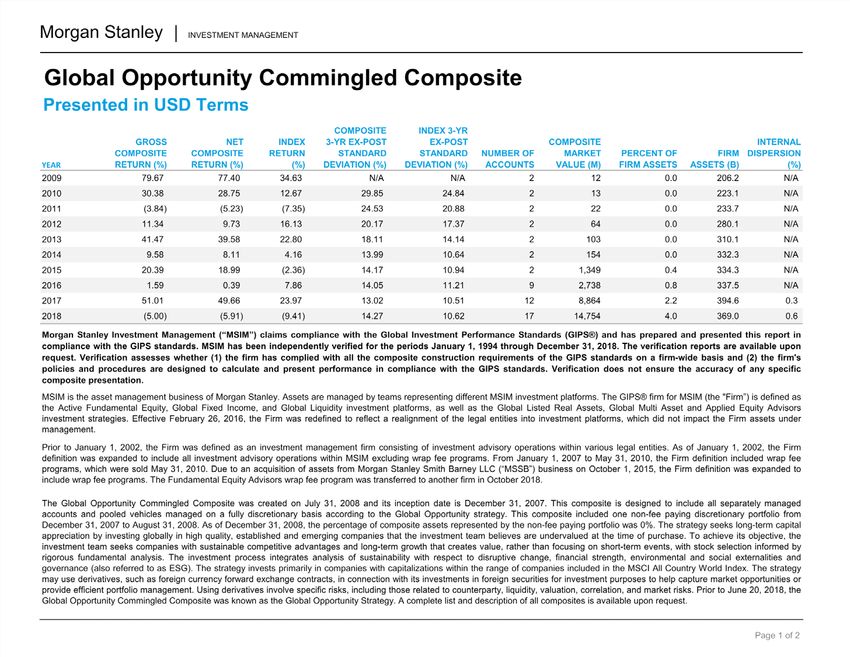
Cogliere le opportunità, gestendo il rischio
Strategia Morgan Stanley Global Opportunity1 – Dati in USD
Performance interessante Periodi rolling di 3 anni dal lancio (30/11/2010) al 31 marzo 2020 – Dati mensili al LORDO dei costi
in termini assoluti e
relativi
40
Buona partecipazione ai rialzi
Global Opportunity Annualized 3-Year Rolling Returns %
in mercati forti
PERIODI ROLLING CON
RENDIMENTI POSITIVI
30
1 mese 59%
1 anno 85%
20
3 anni 100%
PERIODI ROLLING CON 10
RENDIMENTI SUPERIORI
ALL’INDICE
1 mese 63% 0
1 anno 85%
Protezione del capitale
3 anni 100% in mercati deboli
(10)
(10) 0 10 20 30 40
MSCI All Country World Index Annualized 3-Year Rolling Returns %
Source: Morgan Stanley Investment Management.
1.The portfolio returns represent the Global Opportunity Commingled Composite ("Morgan Stanley Global Opportunity Strategy"). Past performance should not be construed as a guarantee of
future performance. Please refer to the complete standardized net of fees performance in this presentation. The strategy results shown are GROSS of investment advisory/management fees,
are quoted in U.S. Dollars and include the reinvestment of dividends and income and therefore had fees, charges, etc. been taken into account, the returns would have been lower. The
performance herein is provided for illustrative purposes only. The comparison index is the MSCI All Country World Index with Net dividends reinvested. The inception date of the Global
Opportunity Strategy is December 31, 2007. Data updated quarterly. Each portfolio may differ due to specific investment guidelines and restrictions. Accordingly, individual results will vary.
GLOBAL OPPORTUNITY 2Nel lungo termine, i rendimenti sono tendenzialmente
determinati dalla selezione dei titoli
Quota stimata di extra rendimento Portafoglio modello della strategia Global
attribuibile all’allocazione fattoriale e alla Opportunity vs. MSCI ACWI Index
selezione dei titoli Selezione dei titoli = 79% of alpha
9.36%
25%
7.42%
75%
75%
25% 1.95%
Short Term Long Term Active Return Stock Specific Factors*
(less than 3 months) (over three years)
Stock Selection Factor Allocation
* Factors include industry, currency, country, world equity, risk indices. Source: Morgan Stanley Investment Management / MSCI Barra. Data as of March 31, 2020.
Estimated share of excess return reflects the views and opinions of the investment team as of the date of the presentation, are subject to change, based on current market conditions, and may not
necessarily come to pass. Past performance is no guarantee of future results. Representative Account data reflects the time period from inception to March 31, 2020. Please refer to the complete
standardized net of fees performance in this presentation. Global Opportunity Strategy Representative Account inception date is 5/30/2008. Global Opportunity data shown for informational
purposes only, should not be construed as historical results for the strategy or a recommendation to invest.
GLOBAL OPPORTUNITY 3Dove sbagliano gli investitori?
I periodi medi di detenzione sono diminuiti1
Anni
10 Mutual Funds NYSE
9
8
7
6
5
4
3
2
1
0
1960 1970 1980 1990 2000 2010
In genere gli analisti si concentrano sugli eventi di breve termine, non sul valore intrinseco
Numero medio di stime degli utili pubblicate dagli analisti2
11 11
10
4
2
FY1 FY2 FY3 FY4 FY5
Market Cap >$1B
1 Source: New York Stock Exchange, Morningstar. Calculated as inverse of turnover ratio. Data as of December 31, 2010.
2 Source: Source: Morgan Stanley Investment Management, calculations based on Bloomberg estimates for 5,656 companies over $1 billion in market capitalization. Data as of January10, 2019.
The views and opinions expressed herein are those of the investment team and do not reflect the opinions of all portfolio managers at MSIM or the views of the Firm as a whole.
GLOBAL OPPORTUNITY 4Il valore intrinseco è principalmente determinato dal
“Terminal Value”
Flusso di cassa
di breve termine Terminal Value
Oltre i 5 anni
Valore Free cash flow dei (prezzo x unità x margine x multiplo)
intrinseco prossimi 5 anni
20% 80%
Note: Near Term Cash Flow equals to next 5 years free cash flow generation all discounted back to today plus net cash balance minus off balance sheet liabilities, adjusted for dilution & fundamental
optionality. Terminal value is also discounted to present.
GLOBAL OPPORTUNITY 5Cos’è l’alta qualità?
Caratteristiche che proteggono il valore di una società
Maggiore probabilità di convertire uno sconto sul valore intrinseco in alpha α
Cambiamento dirompente
Vantaggio
ESG
competitivo
α
Solidità Crescita
finanziaria
The views and opinions expressed herein are those of the portfolio management team.
GLOBAL OPPORTUNITY 6Dove si trova l’alta qualità?
Troviamo società di alta qualità in tutte le regioni, sia nei mercati sviluppati che in via di sviluppo.
Crediamo che tali società siano presenti in misura superiore nelle economie in via di sviluppo
SCREENING IN TERMINI DI ROIC E CRESCITA > US$ 1 MLD SCREENING IN TERMINI DI ROIC E CRESCITA > US$ 1 MLD
(%) (%)
Developing Asia ex Japan 23.7
22.0
economies
Global 16.3
Global 16.3
Europe 12.8
Advanced
12.1
economies
North America 12.3
Sources: FactSet, MSIM. Data as of 13 January 2020. Dataset is 6,141 non-financial companies above US $1 billion market cap. High quality screen is defined by
1) historical three year revenue CAGR above 15% and 2) ROIC above 15%. While representative, regional domicile is not the same as economic exposure in revenue terms.
High quality companies typically have a higher % of sales from outside their home country than the index. For a complete list of financial definitions, please refer to Risks and Disclosures.
GLOBAL OPPORTUNITY 7Troviamo più società di alta qualità nei seguenti settori:
tecnologia, sanità, beni di consumo discrezionali e di prima necessità
SCREENING IN TERMINI DI ROIC E CRESCITA > US$ 1 MLD SCREENING IN TERMINI DI NET CASH TO EQUITY MEDIANO > US$ 1 MLD
(%) (%)
Health Care 23.6 Information Technology 6.4
Information Technology 22.0 Health Care 0.4
Consumer Discretionary 21.1 Consumer Discretionary -12.3
Communication Services 15.5 Consumer Staples -16.7
Consumer Staples 11.4 Communication Services -17.8
Industrials 10.3 Industrials -31.9
Materials 7.4 Energy -33.3
Utilities 5.2 Materials -37.2
Energy 3.8 Utilities -107.2
Sources: FactSet, MSIM. Data as of 13 January 2020. Dataset is 6,141 non-financial companies above US $1 billion market cap.
High quality screen is defined by 1) historical three year revenue CAGR above 15% and 2) ROIC above 15%. For a complete list of financial definitions, please refer to Risks and Disclosures.
GLOBAL OPPORTUNITY 8Strategie competitive ben implementate sono essenziali per
sostenere business di alta qualità…
DIFFERENZIAZIONE
FOCUS DIFFERENZIAZIONE
LEADERSHIP DI COSTO
FOCUS SUI COSTI
EFFETTO NETWORK
… perché portano a forti vantaggi competitivi
The list of competitive strategies are provided for illustrative purposes only and should not be deemed a recommendation to adopt any particular investment strategy. Information is subject to
change without notice.
GLOBAL OPPORTUNITY 9Vogliamo detenere società che generino cambiamenti
dirompenti o che ne siano immuni
La salsa di soia è immune al cambiamento
Andamento del titolo
Le società produttrici di salsa di soia presentano
500 caratteristiche di alta qualità
Cambiamenti dirompenti: è improbabile che l’intelligenza
400
artificiale incida sulla domanda di salsa di soia
300 ESG: forte governance, incentivi e esternalità minime
Solidità finanziaria: ROIC elevato, basso grado di indebitamento
200
Vantaggio competitivo: superiore a quello dei 3 principali
competitor messi assieme
100
Crescita: buon equilibrio tra crescita di prezzi e volumi
0
3/2015 3/2016 3/2017 3/2018 3/2019
Foshan
Soy Haitian
Sauce Company MSCI Asia ex Japan
Share price and index value is rebased on 1 March 2015. Data as of October 10, 2019. Note: The views and opinions expressed herein are those of the investment team and do not reflect the opinions
of all portfolio managers at MSIM or the views of the Firm as a whole. Past performance is no guarantee of future results. Provided for illustrative purposes only and does not imply the strategy held
the security for the entire period shown. Furthermore, the information should not be construed as a recommendation to purchase or sell the security. Holdings are subject to change.
GLOBAL OPPORTUNITY 10I vantaggi competitivi possono subire cambiamenti dirompenti
I costi dell’energia solare stanno diventando più competitivi
Costo equivalente dell’energia solare installata in Cina (centesimi per kWh) Centesimi per kWh
80
Gas 6.7
75.0
70
60 Wind 6.5
50
Solar 5.1
40
35.0 Coal 4.6
30
20 Nuclear 3.2
18.0
10 12.3 11.5
10.0 9.0 Hydro 2.7
6.5 5.7 5.1
0
2007 2008 2009 2010 2011 2012 2013 2014 2015 2016 2017 2018E
Sources: Bernstein analysis and estimates. Data as of January 18, 2019. Estimates/forecasts may or may not come to pass.
GLOBAL OPPORTUNITY 11Quello che i mercati non capiscono sui cambiamenti
dirompenti
Gli incentivi a Wall Street durano meno del ciclo di vita
Orizzonte temporale
dell’innovazione
Nella maggior parte dei casi i cambiamenti dirompenti
Difficile avere successo
non sono remunerativi
I cambiamenti dirompenti che creano un vantaggio
Tipologia di vincitori
competitivo possono crescere in scala
La valutazione è assolutamente critica in TUTTI gli
Valutazioni
investimenti
The views and opinions expressed herein are those of the investment team and do not reflect the opinions of all portfolio managers at MSIM or the views of the Firm as a whole.
GLOBAL OPPORTUNITY 12I bias del mercato e degli investitori possono portare a
errate valutazioni dei prezzi…
“Che si parli di calze o di azioni, preferisco comprare merce di buona qualità quando è a sconto.”
– Warren Buffett
Bias della disponibilità Società sottorappresentate in indici imperfetti, società
uniche e diverse dalle altre
Cercare di spiegare nuove informazioni e situazioni con
Bias del processo decisionale
regole storiche semplicistiche
Utilizzo di indicatori imperfetti e di breve termine come il P/E
Bias di valutazione convenzionale
al posto di misure più complete come i discounted cash flow
Bias di breve termine
Enfasi accentuata sui prossimi eventi rilevanti al posto del
terminal value
… valutazioni errate possono portare a opportunità
The views, opinions, and forecasts expressed herein are those of the portfolio management team, are not necessarily indicative of those of Morgan Stanley, are subject to change based on
market, economic, and other conditions, and may not necessarily come to pass.
GLOBAL OPPORTUNITY 13Filosofia di investimento
I principi d’investimento di Warren Buffett applicati alle società in crescita
Crediamo che: La nostra filosofia enfatizza:
Una solida selezione dei titoli deriva da Mentalità di detenzione nel lungo termine e sviluppo
investimenti di lungo termine effettuati con ampio di approfondimenti
sconto rispetto al valore intrinseco
Focus sull’analisi bottom-up e settoriale
Gli investimenti di lungo termine sono protetti al Concentrazione nelle migliori idee
meglio quando sostenibili in termini di
innovazione, solidità finanziaria ed esternalità ESG1 Evoluzione e innovazione
Gli investimenti di lungo termine sono valorizzati
da forti vantaggi competitivi e da una crescita che
genera valore
1. The team applies what they believe to be investment principles similar to those of Warren Buffett. No representation is being made that the team's investment results will be similar to those
produced by investment portfolios managed by Warren Buffett.
2. Environmental and social externalities and governance (also referred to as ESG)
The views, opinions, and forecasts expressed herein are those of the portfolio management team, are not necessarily indicative of those of Morgan Stanley, are subject to change based on
market, economic, and other conditions, and may not necessarily come to pass. There can be no guarantee that the strategy will achieve its investment objectives or that a portfolio consisting of
the team’s “best ideas” will experience positive performance.
GLOBAL OPPORTUNITY 14Team Global Opportunity - Un ampio ventaglio di opportunità
Il Team gestisce la strategia dal 2006, declinata oggi su quattro aree geografiche per un totale di $ 12.9 mld di AuM
Overview della strategia
La strategia investe in società consolidate ed emergenti di alta qualità giudicate sottovalutate al momento
dell’acquisto. Il team d’investimento punta su società dotate di vantaggi competitivi sostenibili e di un profilo di
crescita nel lungo termine in grado di creare valore, anziché concentrarsi sugli eventi nel breve termine, e attua
una selezione dei titoli basata su una rigorosa analisi fondamentale.
Soluzioni di investimento
Caratteristiche Global Asia Europe Developing
Opportunity Opportunity Opportunity Opportunity
Classe A LU0552385295 LU1378878430 LU1387591305 LU2091680145
ISIN Classe B LU0552385378 LU1378878513 LU1394890559 LU2091680228
Classe C LU0552385451 LU1808492620 LU1394890807 LU2091680491
Data di lancio 30 nov 2010 31 mar 2016 21 apr 2020 20 dic 2019
Benchmark MSCI AC World MSCI AC Asia ex Japan MSCI Europe MSCI Emerging Markets
AuM ($) 10.6 mld 1.8 mld 380 mln 93 mln
Titoli in portafoglio 37 29 24 27
Active Share (%) 90.34 78.14 94.85 81.56
Rating Morningstar1 n/a n/a
Total Fondo 271% 106% 13%
Return Bmk 112% 21% 8%
SI Alpha 159% 85% 5%
.
Source: MSIM. Data as of 30 April 2020. Morningstar Rating for Class Z. Performance as of 31 May 2020.
1. Please refer to the disclosures section for more information about the Morningstar rating. Global Opportunity Class A/B/C Shares: EAA Fund Global Large-Cap Growth Equity. Out
of 1193 Funds. Based on Risk Adjusted Return. 3yr. rating 5 Stars; 5yr. Asia Opportunity Class A/B Shares: EAA Fund Asia ex-Japan Equity Out of 794 Funds. Based on Risk
Adjusted Return. 3yr. rating 5 Stars.
15Strategia Global Opportunity
Dati in USD
Rendimenti annui medi, al LORDO e al NETTO dei costi, al 30 aprile 2020
La data di lancio della strategia Global Opportunity è il 31 dicembre 2007
Percentuale (%)
17.82 16.72 16.61 15.43 17.09 15.72
13.20 13.11 10.71 9.99 12.81 11.47
8.95 4.46 4.37 6.94 3.74
0.42 0.10
-4.96
-12.94
QTD YTD 1 anno 3 anni 5 anni 10 anni Dal lancio (ann.)
Global Opportunity Commingled Composite - Gross Global Opportunity Commingled Composite - Net MSCI All Country World Index
Percentuale (%)
79.67 77.40
51.01 49.66
37.55 36.27 41.47 39.58
30.38 28.75 34.63
26.60 23.97 22.80
20.39 18.99 16.13
7.86 9.58 8.11 11.34 9.73 12.67
1.59 0.39 4.16
-5.00 -5.91 -2.36 -3.84 -5.23-7.35
-9.41
-42.19
-53.09 -53.64
2019 2018 2017 2016 2015 2014 2013 2012 2011 2010 2009 2008
Source: Morgan Stanley Investment Management. Past performance is not a guarantee of future performance. Performance returns reflect the average annual rates of return. Returns less than
one year are cumulative. The Global Opportunity Commingled Composite results shown are GROSS and NET of investment advisory/ management fees, which include performance fees if
applicable, are quoted in US $, and include the reinvestment of dividends and income. The performance herein is provided for illustrative purposes only. Each portfolio may differ due to specific
investment guidelines and restrictions. Accordingly, individual results will vary. Performance returns are compared to those of an unmanaged market index and are considered to be a relevant
comparison to the portfolio. Comparisons of performance assume the reinvestment of all dividends and income.
Please keep in mind that high double-digit returns are highly unusual and cannot be sustained. Investors should also be aware that these returns were primarily achieved during favorable market
conditions.
16Strategia Global Opportunity
Dati in USD
Rendimenti nell’anno solare, al LORDO e al NETTO dei costi, al 30 aprile 2020
La data di lancio della strategia Global Opportunity è il 31 dicembre 2007
Percentuale (%)
34.39 33.18
25.92 24.57
14.16 15.14
9.99 8.95 10.64 9.60 5.06 4.71 3.43
-4.96 -5.66
4/30/2019 - 4/30/2020 4/30/2018 - 4/30/2019 4/30/2017 - 4/30/2018 4/30/2016 - 4/30/2017 4/30/2015 - 4/30/2016
Global Opportunity Commingled Composite - Gross Global Opportunity Commingled Composite - Net MSCI All Country World Index
Source: Morgan Stanley Investment Management. Past performance is not a guarantee of future performance. Performance returns reflect the average annual rates of return. The Global
Opportunity Commingled Composite results shown are GROSS and NET of investment advisory/ management fees, which include performance fees if applicable, are quoted in US $, and include
the reinvestment of dividends and income. The performance herein is provided for illustrative purposes only. Each portfolio may differ due to specific investment guidelines and restrictions.
Accordingly, individual results will vary. Performance returns are compared to those of an unmanaged market index and are considered to be a relevant comparison to the portfolio. Comparisons
of performance assume the reinvestment of all dividends and income.
Please keep in mind that high double-digit returns are highly unusual and cannot be sustained. Investors should also be aware that these returns were primarily achieved during favorable market
conditions.
17Morgan Stanley Investment Funds (MS INVF)
Global Opportunity Fund
Cogliere le opportunità, gestendo il rischio
18Caratteristiche del portafoglio
Portafoglio di alta qualità MS INVF GLOBAL OPPORTUNITY FUND¹
Dati al 31 marzo 2020
MS INVF
Elevato Return on Capital MSCI All Country World
Global Opportunity
Index
Crescita elevata Fund
Bassa leva finanziaria Active Share (%) 91
Concentrazione nelle
Return on Invested Capital (%) 90.2 17.9
migliori idee
Basso turnover, tipicamente Return on Assets (%) 6.5 4.0
nel range tra 20-50%
Crescita EPS a 5 anni (%) 22.2 7.2
Statistiche di volatilità Crescita fatturato a 5 anni (%) 22.0 6.5
Dati storici (3 anni)
Net Cash to Equity Ratio (%) +26 -40
Tracking Error 8.70
Market cap mediana ($mld) 195.4 159.9
Beta azionario 0.92
R quadro 0.72 Numero di titoli 40 3,047
Source: FactSet Research Systems Inc. / Morgan Stanley Investment Management / MSCI Barra risk model. All data as of 31 March 2020. Past performance is not indicative of future results.
Returns may increase or decrease as a result of currency fluctuations. The sources for all performance and Index data is Morgan Stanley Investment Management.
1.Statistical information is subject to change and for informational purposes only.
There is no guarantee that these figures will continue to be substantially similar in the future. For a complete list of financial definitions, please refer to the “Definitions” slide at the back of the
presentation.
GLOBAL OPPORTUNITY 19Allocazione settoriale
Allocazione di alta qualità MS INVF GLOBAL OPPORTUNITY FUND¹
Dati al 31 marzo 2020
I pesi dei settori sono 35 DEFENSIVE SENSITIVE CYCLICAL
determinati dalla selezione
bottom-up delle aziende di 30
alta qualità
25
Sottopeso titoli con leva
elevata, settori con basso
20
ROIC come finanziari, energia,
materiali, telecomunicazioni,
15
utility
10
5
0
Materials
Industrials
Energy
Consumer Discretionary
Real Estate
Utilities
Health Care
Communication Services
Financials
Consumer Staples
Information Technology
MSCI All Country World Index
MS INVF Global Opportunity Fund
1. Source: FactSet Research Systems Inc. / Morgan Stanley Investment Management. For additional information regarding sector classification/definitions please visit
https://www.msci.com/gics. Provided for informational purposes only and should not be deemed as a recommendation to buy or sell securities in the sectors shown above.
GLOBAL OPPORTUNITY 20Prime dieci posizioni
Portafoglio bilanciato, MS INVF GLOBAL OPPORTUNITY FUND¹
posizioni concentrate Prime dieci posizioni, esclusa la liquidità; dati al 31 marzo 2020
Mix of well-known and Società Descrizione Strategia competitiva % portafoglio Paese*
relatively undiscovered high
Amazon E-commerce Cost Leadership 7.5 Stati Uniti
quality companies
Invest in multiple drivers of Mastercard Payment Network Network Effect 6.9 Stati Uniti
competitive advantage
TAL Education Education Differentiation 6.3 Cina
Conviction based
concentration ServiceNow Software Differentiation 5.2 Stati Uniti
Top Ten Holdings average Alphabet Search Network Platform 4.6 Stati Uniti
8 year holding period
Uber Ride Sharing Network Platform 4.6 Stati Uniti
DSV Panalpina A/S Transportation Cost Focus 4.0 Danimarca
Adobe Software Differentiation 3.9 Stati Uniti
Visa Payment Network Network Effect 3.8 Stati Uniti
Facebook Social Network Network Effect 3.6 Stati Uniti
Total 50.4
1. Source: Morgan Stanley Investment Management. These securities and percentage allocations are only for illustrative purposes and do not constitute, and should not be construed as,
investment advice or recommendations with respect to the securities or investments mentioned.
* Note: Offshore China refers to publicly listed Chinese companies that trade on non-Chinese stock exchanges, while China refers to China A share companies that are based in mainland China
and are listed on either the Shanghai or Shenzhen stock exchanges.
GLOBAL OPPORTUNITY 21Ripartizione regionale
L’esposizione economica del portafoglio appare simile alla possibile ponderazione del PIL nel 2030
Dati al 31 dicembre 2019
Titoli per regione di domicilio¹ Esposizione economica del Global Esposizione economica del Global
Opportunity vs. MSCI ACWI per regione2 Opportunity vs. PIL 2030E3
60 58 60 60
56
50 50 50
39 40
40 40 37 38 39 40 37 38
30 30
30 25 30 30
24 24
22 22
19 20
20 20 20
10 10 10
0 0 0
Americas EMEA Asia Americas EMEA Asia Americas EMEA Asia
Global Opportunity MSCI ACWI Global Opportunity MSCI ACWI Global Opportunity MSCI ACWI
1. Source: FactSet , Morgan Stanley Investment Management
2. Source: 10-K Filings, Annual Reports, FactSet, Morgan Stanley estimates. Economic Exposure defined by sales in a given region.
3. Source: 10-K Filings, Annual Reports, FactSet, Morgan Stanley estimates, IMF, Worldbank estimates. Economic Exposure defined by sales in a given region.
Forecasts / estimates are subject to change at any time due to market, economic, or other conditions, and may not necessarily come to pass.
GLOBAL OPPORTUNITY 22MS INVF Global Opportunity Fund
Dati in USD – Azioni di classe A
Rendimenti¹, al NETTO dei costi, al 31 maggio 2020
La data di lancio del MS INVF Global Opportunity Fund è il 30 novembre 2010
Percentuale (%)
21.29 22.19
15.53 16.42 15.83 14.80
7.40 5.19 5.29 7.62
5.43
-9.16
QTD YTD 1 anno 3 anni 5 anni Dal lancio (annualizzata)
MS INVF Global Opportunity Fund - A MSCI All Country World Index
Percentuale (%)
48.44
34.82 38.61
26.60 23.97 22.80
18.62 16.13
7.86 7.40 9.14
4.16
-0.56 -2.36
-7.36 -9.42 -6.47 -7.35
2019 2018 2017 2016 2015 2014 2013 2012 2011
1. Past performance is not a reliable indicator of future results. Returns may increase or decrease as a result of currency fluctuations. All performance data is calculated NAV to NAV, net of
fees, and does not take account of commissions and costs incurred on the issue and redemption of units. The sources for all performance and Index data is Morgan Stanley Investment
Management. Performance returns reflect the average annual rates of return. Performance returns are compared to those of an unmanaged market index and are considered to be a relevant
comparison to the portfolio. Comparisons of performance assume the reinvestment of all dividends and income.
GLOBAL OPPORTUNITY 23MS INVF Global Opportunity Fund
Dati in USD – Azioni di classe A
Rendimenti nell’anno solare, al NETTO dei costi, al 31 maggio 2020
La data di lancio del MS INVF Global Opportunity Fund è il 30 novembre 2010
Percentuale (%)
33.18
26.17
22.19
17.53
11.84
5.43 4.74
-1.29
-3.04
-5.42
5/31/2019 - 5/31/2020 5/31/2018 - 5/31/2019 5/31/2017 - 5/31/2018 5/31/2016 - 5/31/2017 5/31/2015 - 5/31/2016
MS INVF Global Opportunity Fund - A MSCI All Country World Index
1. Past performance is not a reliable indicator of future results. Returns may increase or decrease as a result of currency fluctuations. All performance data is calculated NAV to NAV, net of
fees, and does not take account of commissions and costs incurred on the issue and redemption of units. The sources for all performance and Index data is Morgan Stanley Investment
Management. Performance returns reflect the average annual rates of return. Performance returns are compared to those of an unmanaged market index and are considered to be a relevant
comparison to the portfolio. Comparisons of performance assume the reinvestment of all dividends and income.
GLOBAL OPPORTUNITY 24Contributi: MS INVF Global Opportunity Fund
QTD – Principali contributi positivi/negativi al 31 marzo 2020
Fattori positivi? Principali contributi positivi Principali contributi negativi
Selezione dei titoli nei beni Communications platform 57 pb HDFC Bank Limited -179 pb
di consumo discrezionale
TAL Education 55 Mastercard -156
Sottopeso nel settore
finanziario Amazon.com 37 DSV Panalpina A/S -112
Sottopeso nel settore E-commerce solutions provider 24 Trip.com -81
informatico Entertainment company 19 Alphabet -57
Fattori negativi?
Sottopeso nel settore
sanitario
Sottopeso nel settore dei
beni di consumo primari
Selezione dei titoli
finanziari
Source: Source: FactSet Research Systems Inc. / Morgan Stanley Investment Management. bps refers to a basis point or 1/100 of 1%; i.e. 100 bps is equal to 1%.
Past performance is no guarantee of future results. These securities and percentage allocations are only for illustrative purposes and do not constitute, and should not be construed as,
investment advice or recommendations with respect to the securities or investments mentioned. To obtain the methodology of the return attribution analysis, a list showing every holding’s
contribution to the overall performance during the measurement periods, and/or if you have any questions, please contact your Morgan Stanley representative.
GLOBAL OPPORTUNITY 25Morgan Stanley Investment Funds (MS INVF) Europe Opportunity Fund Cogliere le opportunità, gestendo il rischio GLOBAL OPPORTUNITY 26
Caratteristiche del portafoglio
Portafoglio di alta qualità MS INVF EUROPE OPPORTUNITY FUND¹
Dati al 30 aprile 2020
MS INVF
Elevato Return on Capital
Europe Opportunity MSCI Europe Index
Crescita elevata Fund
Bassa leva finanziaria Active Share (%) 95 -
Concentrazione nelle
Return on Invested Capital (%) 68.4 20.3
migliori idee
Basso turnover, tipicamente Return on Assets (%) 10.4 3.3
nel range tra 20-50%
Crescita EPS a 5 anni (%) 18.5 5.6
Crescita fatturato a 5 anni (%) 15.2 4.2
Net Cash to Equity Ratio (%) +2 -52
Market cap mediana ($mld) 11.4 11.2
Numero di titoli 24 437
Source: FactSet Research Systems Inc. / Morgan Stanley Investment Management / MSCI Barra risk model. All data as of April 30, 2020. Past performance is not indicative of future results.
1.Statistical information is subject to change and for informational purposes only.
There is no guarantee that these figures will continue to be substantially similar in the future. For a complete list of financial definitions, please refer to the “Definitions” slide at the back of the
presentation.
EUROPE OPPORTUNITY 27Allocazione settoriale
Allocazione di alta qualità MS INVF EUROPE OPPORTUNITY FUND¹
Dati al 30 aprile 2020
I pesi dei settori sono
40 DEFENSIVE SENSITIVE CYCLICAL
determinati dalla selezione
bottom-up delle aziende di
alta qualità
30
Sottopeso titoli con leva
elevate, settori con basso
ROIC come finanziari, energia,
20
materiali, real estate, utility
Sovrappeso sui titoli ciclici e
sensibili al ciclo, sottopeso sui 10
titoli difensivi
Sottopeso sul settore sanitario
principalmente a causa delle 0
valutazioni
Information Technology
Energy
Materials
Communication Services
Consumer Staples
Utilities
Industrials
Consumer Discretionary
Health Care
Financials
Real Estate
MSCI Europe Index
MS INVF Europe Opportunity Fund
1. Source: FactSet Research Systems Inc. / Morgan Stanley Investment Management. For additional information regarding sector classification/definitions please visit
https://www.msci.com/gics. Provided for informational purposes only and should not be deemed as a recommendation to buy or sell securities in the sectors shown above.
EUROPE OPPORTUNITY 28Allocazione geografica
MS INVF EUROPE OPPORTUNITY FUND
(%) scomposizione; dati al 30 aprile 2020
Allocazione geografica determinata dalla
selezione bottom-up dei titoli
30
24.27
20.4
20
16.96 17.2
13.2 13.79
10.9
9.9 9.9 9.5
10 8.8 8.7
6.85 6.9 6.4
4.52
3.35 3.6
0
United Kingdom Netherlands Sweden Germany Italy Switzerland Denmark France Other
MS INVF Europe Opportunity Fund MSCI Europe Index
Source: FactSet Research Systems Inc. / Morgan Stanley Investment Management. May not sum to 100% due to rounding.
Subject to change daily. Provided for informational purposes only and should not be deemed as a recommendation to buy or sell securities in the countries shown above.
EUROPE OPPORTUNITY 29Prime dieci posizioni
Portafoglio bilanciato, MS INVF EUROPE OPPORTUNITY FUND¹
posizioni concentrate Prime dieci posizioni, esclusa la liquidità; dati al 30 aprile 2020
Mix di società di alta qualità Società Descrizione Strategia competitiva % portafoglio Paese
conosciute e di altre
DSV Panalpina A/S Transportation Cost Focus 8.7 Danimarca
relativamente poco note
Investe in molteplici driver di Moncler SpA Luxury Brand Differentiation Focus 6.9 Italia
vantaggi competitivi
EPAM Systems Business Services Cost Focus 6.4 Europa dell’Est
Concentrazione giustificata
dall’alta convinzione Adyen Payments Differentiation Focus 5.4 Olanda
Spotify Music Streaming Differentiation 5.0 Svezia
Hermés Luxury Brand Brand Name 4.4 Francia
Farfetch Luxury Retail Network Effect 4.3 Regno Unito
Hello Fresh SE Food Delivery Differentiation Focus 4.3 Germania
Just Eat Takeaway.com Food Delivery Network Effect 4.2 Olanda
Fevertree Drinks Beverages Differentiation Focus 4.0 Regno Unito
Totale 53.5
1. Source: Morgan Stanley Investment Management. These securities and percentage allocations are only for illustrative purposes and do not constitute, and should not be construed as,
investment advice or recommendations with respect to the securities or investments mentioned.
EUROPE OPPORTUNITY 30MS INVF Europe Opportunity Fund
Dati in USD – Azioni di classe A
Rendimenti¹, al NETTO dei costi, al 31 maggio 2020
La data di inizio del team nel MS INVF Europe Opportunity Fund è il 21 aprile 2020.
La data di lancio del MS INVF Europe Opportunity Fund è l’8 aprile 2016.
A partire dal 20 aprile 2020, il Morgan Stanley Investment Funds Eurozone Equity Alpha Fund si è fuso nel Morgan Stanley Investment Funds European Champions Fund. In seguito, a partire dal 20
aprile 2020, il Morgan Stanley Investment Funds European Champions Fund ha cambiato denominazione in Morgan Stanley Investment Funds Europe Opportunity Fund e l'approccio di investimento è
stato modificato.
Percentuale (%)
19.77
16.72
10.76
7.80
4.72 3.40
1.54
-4.14 -1.68
-16.19
QTD YTD 1 anno 3 anni Dal lancio (annualizzata)
16.72 17.00
15.48
3.87 4.83
-4.41 -5.26 -5.17
5/31/2019 - 5/31/2020 5/31/2018 - 5/31/2019 5/31/2017 - 5/31/2018 5/31/2016 - 5/31/2017 5/31/2015 - 5/31/2016
1. Past performance is not a reliable indicator of future results. Returns may increase or decrease as a result of currency fluctuations. All performance data is calculated NAV to NAV, net of
fees, and does not take account of commissions and costs incurred on the issue and redemption of units. The sources for all performance and Index data is Morgan Stanley Investment
Management. Performance returns reflect the average annual rates of return. Performance returns are compared to those of an unmanaged market index and are considered to be a relevant
comparison to the portfolio. Comparisons of performance assume the reinvestment of all dividends and income.
EUROPE OPPORTUNITY 31Performance ipotetica
Componente europea della Strategia Global Opportunity, dati in USD
Esperienza nell’investimento in PERFORMANCE MENSILE IPOTETICA
Europa dal 2007 Componente europea della strategia Global Opportunity, dati al 31 dicembre 2019
Performance ipotetica 350
Indexed to 100 on 12/31/2007
annualizzata (2007-2019):
300
- Componente europea della Strategia
Global Opportunity: 10.2% 250
- MSCI Europe Index: 1.6% 200
150
100
50
0
12/2007 12/2009 12/2011 12/2013 12/2015 12/2017 12/2019
Europe component* of the Global Opportunity Strategy’s representative account
MSCI Europe Index
Returns are based on the Europe component of the Global Opportunity Strategy’s representative account includes only the securities that are located in Europe. Returns are hypothetical, not based
on any actual client account, and presented GROSS of investment advisory / management fee, quoted in U.S. Dollars, and includes the reinvestment of dividends and income, excluding cash. Had
fees been included, returns would be lower. Hypothetical performance is not indicative of future results. There are frequently sharp differences between a hypothetical performance record and the
actual record subsequently achieved. Hypothetical returns shown are compared to a relevant index with net dividends reinvested. Information is provided solely to illustrate the investment team’s
experience and should not be construed as a representation that any Europe Opportunity Strategy will or is likely to achieve a performance record similar to that shown. In addition, the information
provided herein does not constitute an offer or a recommendation to buy or sell any particular security or to adopt any specific investment strategy. Hypothetical performance results have inherent
limitations, some of which are described below. No representation is being made that the Proposed Portfolio will or is likely to achieve a composite performance record similar to that shown. One
of the limitations of a hypothetical performance record is that decisions relating to vehicle selection and asset allocation among those vehicles were made with the benefit of hindsight based upon
the historical rates of return and other characteristics of selected vehicles. Therefore, hypothetical performance records often show positive rates of return. Another inherent limitation is that
allocation decisions reflected in the performance record were not made under actual market conditions and, therefore, cannot completely account for the impact of financial risk in actual trading.
Furthermore, the hypothetical performance record may be distorted because the allocation of assets changes from time to time and these allocation adjustments are not reflected in the
performance record.
EUROPE OPPORTUNITY 32MS INVF Asia Opportunity Fund
Dati in USD – Azioni di classe A
Rendimenti nell’anno solare, al NETTO dei costi, al 31 maggio 2020
La data di lancio del MS INVF Asia Opportunity Fund è il 31 marzo 2016
Percentuale (%)
48.25
31.31 28.08
24.66
17.27
0.01
-8.56 -11.10
5/31/2019 - 5/31/2020 5/31/2018 - 5/31/2019 5/31/2017 - 5/31/2018 5/31/2016 - 5/31/2017
MS INVF Asia Opportunity Fund - A MSCI All Country Asia ex-Japan Net Index (USD)
1. Past performance is not a reliable indicator of future results. Returns may increase or decrease as a result of currency fluctuations. All performance data is calculated NAV to NAV, net of
fees, and does not take account of commissions and costs incurred on the issue and redemption of units. The sources for all performance and Index data is Morgan Stanley Investment
Management. Performance returns reflect the average annual rates of return. Performance returns are compared to those of an unmanaged market index and are considered to be a relevant
comparison to the portfolio. Comparisons of performance assume the reinvestment of all dividends and income.
33Considerazioni sui rischi – Global Opportunity Fund
Il comparto si affida ad altri soggetti ai fini dell'adempimento di determinati servizi, investimenti o
transazioni. Se tali soggetti diventassero insolventi, potrebbero esporre il comparto a perdite finanziarie.
Il numero di acquirenti o venditori potrebbe essere insufficiente e questo potrebbe ripercuotersi sulla
capacità del comparto di acquistare o vendere titoli.
Gli investimenti nelle A-share cinesi tramite i programmi Shanghai- Hong Kong e Shenzen-Hong Kong Stock
Connect possono comportare rischi aggiuntivi quali quelli legati alla proprietà delle azioni.
I mercati emergenti comportano maggiori rischi d'investimento, in quanto i sistemi politici, giuridici e
operativi potrebbero essere meno avanzati di quelli dei mercati sviluppati.
La performance passata non è un indicatore affidabile dei risultati futuri. I rendimenti possono aumentare o
diminuire per effetto delle oscillazioni valutarie. Il valore degli investimenti e i proventi da essi derivanti
possono aumentare come diminuire e gli investitori possono perdere la totalità o una quota consistente del
capitale investito.
Il valore degli investimenti e il reddito da essi derivato possono variare e non è possibile garantire che il
Fondo realizzi i suoi obiettivi d'investimento.
Il patrimonio può essere investito in valute diverse e pertanto i movimenti dei tassi di cambio possono
influire sul valore delle posizioni assunte. Inoltre, il valore degli investimenti può risentire delle fluttuazioni
dei tassi di cambio tra la valuta di riferimento dell'investitore e la valuta di riferimento degli investimenti.
34Considerazioni sui rischi – Europe Opportunity Fund
Il comparto si affida ad altri soggetti ai fini dell'adempimento di determinati servizi, investimenti o
transazioni. Se tali soggetti diventassero insolventi, potrebbero esporre il comparto a perdite finanziarie.
Il numero di acquirenti o venditori potrebbe essere insufficiente e questo potrebbe ripercuotersi sulla
capacità del comparto di acquistare o vendere titoli.
I mercati emergenti comportano maggiori rischi d'investimento, in quanto i sistemi politici, giuridici e
operativi potrebbero essere meno avanzati di quelli dei mercati sviluppati.
La performance passata non è un indicatore affidabile dei risultati futuri. I rendimenti possono aumentare o
diminuire per effetto delle oscillazioni valutarie. Il valore degli investimenti e i proventi da essi derivanti
possono aumentare come diminuire e gli investitori possono perdere la totalità o una quota consistente del
capitale investito.
Il valore degli investimenti e il reddito da essi derivato possono variare e non è possibile garantire che il
Fondo realizzi i suoi obiettivi d'investimento.
Il patrimonio può essere investito in valute diverse e pertanto i movimenti dei tassi di cambio possono
influire sul valore delle posizioni assunte. Inoltre, il valore degli investimenti può risentire delle fluttuazioni
dei tassi di cambio tra la valuta di riferimento dell'investitore e la valuta di riferimento degli investimenti.
35Considerazioni sui rischi – Asia Opportunity Fund
Il comparto si affida ad altri soggetti ai fini dell'adempimento di determinati servizi, investimenti o
transazioni. Se tali soggetti diventassero insolventi, potrebbero esporre il comparto a perdite finanziarie.
Il numero di acquirenti o venditori potrebbe essere insufficiente e questo potrebbe ripercuotersi sulla
capacità del comparto di acquistare o vendere titoli.
L’investimento effettuato nelle azioni cinesi A share attraverso la piattaforma Shanghai-Hong Kong Stock
Connect potrebbe comportare rischi addizionali come quelli collegati alla titolarità delle azioni.
I mercati emergenti comportano maggiori rischi d'investimento, in quanto i sistemi politici, giuridici e
operativi potrebbero essere meno avanzati di quelli dei mercati sviluppati.
La performance passata non è un indicatore affidabile dei risultati futuri. I rendimenti possono aumentare o
diminuire per effetto delle oscillazioni valutarie. Il valore degli investimenti e i proventi da essi derivanti
possono aumentare come diminuire e gli investitori possono perdere la totalità o una quota consistente del
capitale investito.
Il valore degli investimenti e il reddito da essi derivato possono variare e non è possibile garantire che il
Fondo realizzi i suoi obiettivi d'investimento.
Il patrimonio può essere investito in valute diverse e pertanto i movimenti dei tassi di cambio possono
influire sul valore delle posizioni assunte. Inoltre, il valore degli investimenti può risentire delle fluttuazioni
dei tassi di cambio tra la valuta di riferimento dell'investitore e la valuta di riferimento degli investimenti.
3637
38
Definizioni
PRINCIPALI TERMINI FINANZIARI
Active Share: è una misura della percentuale di investimenti azionari nel portafoglio di un gestore che differisce da quella dell’indice (quanto a posizioni e alle rispettive ponderazioni). I
punteggi relativi all’active share sono compresi tra 0% e 100%. Un punteggio di 100% significa che vi è un completo scostamento dal benchmark. Beta: è un indicatore della volatilità di
un comparto rispetto ai movimenti al rialzo o al ribasso del mercato. Un beta maggiore di 1,0 identifica un’emissione o un comparto con movimenti superiori a quelli del mercato,
mentre un beta inferiore a 1,0 identifica un’emissione o un comparto con movimenti inferiori a quelli del mercato Il beta del mercato è sempre pari a 1. Tasso di crescita annuo
composto (CAGR): è il tasso di crescita di un investimento su base annua in un determinato periodo. Modello discounted cash flow (DCF): è un metodo di valutazione utilizzato per
stimare l’attrattiva di un’opportunità d’investimento. Rendimento del free cash flow (FCF) misura il flusso di cassa operativo di un'azienda meno le sue spese in conto capitale, diviso
per la sua capitalizzazione di mercato. Il rapporto di rendimento del free cash flow viene calcolato utilizzando i titoli sottostanti del fondo. Crescita del free cash flow a 5 anni è il tasso
di crescita annuale composto del Free Cash Flow in un periodo di 5 anni. Viene calcolato da [Free Cash Flow(0) / Free Cash Flow(-5)]1/5 – 1. Crescita fatturato a 5 anni è il tasso di crescita
annuale composto delle vendite negli ultimi 5 anni. Viene calcolato da [Vendite (0) / Vendite (-5)] 1/5 – 1. Leva finanziaria: il grado in cui una società utilizza titoli a obbligazionari come
debito e azioni privilegiate. Maggiore il finanziamento tramite debito della società, maggiore è la sua leva finanziaria. Un elevato grado di leva finanziaria implica pagamenti di interessi
elevati, che influiscono negativamente sugli utili per azione della società. Capitalizzazione di mercato: il valore di mercato totale in dollari di tutte le azioni in circolazione di una
società. Price-Earnings (P/E) è il prezzo di un titolo diviso per l'utile per azione degli ultimi 12 mesi. A volte chiamato multiplo, P /E dà agli investitori un'idea di quanto stanno pagando
per il potere di guadagno di una società. Più alto è il P/E, più gli investitori stanno pagando, e quindi più crescita degli utili si aspettano. R quadro: quadrato del coefficiente di
correlazione. La percentuale della variabilità in una serie che può essere spiegata dalla variabilità di una o più altre serie in un modello di regressione. Return on Assets (ROA): misura
della redditività di una società, pari al dividendo degli utili dell'anno fiscale per il totale delle attività, espressa in percentuale. Rendimento del capitale investito (ROIC) rappresenta il
ratio di performance che misura il rendimento percentuale di una società sul capitale investito. Voci del conto economico all'ultimo periodo fiscale dichiarato e voci dello stato
patrimoniale di un periodo precedente. Il ROIC è calcolato dividendo il reddito netto per (Proprietà, Impianti & Attrezzature - Capitale Circolante - Debito a breve termine - Contanti ed
Equivalenti). ROIC ha un tetto massimo del 200% e minimo dello 0%, ex settori finanziari e immobiliari. Net cash to equity: è il rapporto tra le disponibilità liquide di una società e il suo
patrimonio netto totale. Viene calcolato come [(Total Cash and cash equivalents – Total Deabilities) / Shareholder's Equity. Tracking error: è la deviazione standard della differenza tra i
rendimenti di un investimento e il suo benchmark. Capitalizzazione di mercato media ponderata: è una media della capitalizzazione di mercato dei titoli inclusi in un portafoglio o
indice, corretta per la ponderazione di ogni titolo nel portafoglio o indice.

INFORMAZIONI SUGLI INDICI
L’indice MSCI Europe è un indice ponderato per la capitalizzazione di mercato corretta per il flottante e misura la performance dei mercati azionari dei Paesi Sviluppati europei. Il
termine “flottante” è riferito alla quota di azioni in circolazione considerate disponibili per l’acquisto da parte degli investitori sui mercati azionari quotati. La performance dell’indice è
espressa in dollari USA e prevede il reinvestimento dei dividendi netti.

L’Indice MSCI All Country World (ACWI) è un indice ponderato per la capitalizzazione di mercato corretta per il flottante che misura la performance dei mercati azionari sviluppati ed
emergenti. Il termine “flottante” è riferito alla quota di azioni in circolazione considerate disponibili per l’acquisto da parte degli investitori sui mercati azionari pubblici. La performance
dell’Indice è espressa in dollari USA e prevede il reinvestimento dei dividendi netti.

L’indice MSCI All Country Asia ex Japan Index è un indice ponderato per la capitalizzazione di mercato corretta per il flottante che misura la performance dei mercati azionari Asia,
escudendo il Giappone. La performance dell’Indice è espressa in dollari USA e prevede il reinvestimento dei dividendi netti. L’indice non viene gestito attivamente e non comprende le
spese, commissioni o costi di vendita.Non è possibile investire direttamente nell’indice.

                                                                                                                                                                                                   39
Informative legate agli adempimenti di legge
DISTRIBUZIONE
Il presente documento è destinato e sarà distribuito solo ai soggetti residenti nelle giurisdizioni in cui la sua distribuzione o disponibilità non sia vietata dalle leggi e normative
vigenti. In particolare, le Azioni non sono autorizzate alla distribuzione a soggetti statunitensi.
Irlanda: Morgan Stanley Investment Management (Ireland) Limited.Sedelegale:The Observatory, 7-11 Sir John Rogerson’s Quay, Dublino 2, Irlanda.Società registrata in Irlanda con il
numero 616662. Regolamentata dalla Banca Centrale d’Irlanda. Regno Unito: Morgan Stanley Investment Management Limited è autorizzata e regolamentata dalla Financial
ConductAuthority. Registrata in Inghilterra. N. di registrazione: 1981121.Sede legale:25 Cabot Square, Canary Wharf, London E14 4QA. Dubai: Morgan Stanley Investment
Management Limited (Representative Office, Unit Precinct 3-7th Floor-Unit 701 and 702, Level 7, Gate Precinct Building 3, Dubai International Financial Centre, Dubai, 506501, Emirati
Arabi Uniti. Telefono: +97 (0)14 709 7158). Germania: Morgan Stanley Investment Management Limited Niederlassung Deutschland 4th Floor Junghofstrasse 18-26, 60311 Francoforte
sul Meno, Germania (Gattung: Zweigniederlassung (FDI) gem. §53b KWG). Italia: Morgan Stanley Investment Management Limited, Milan Branch (Sede Secondaria di Milano) è una
filiale di Morgan Stanley Investment Management Limited, una società registrata nel Regno Unito, autorizzata e regolamentata dalla Financial Conduct Authority (FCA), e con sede
legale in 25 Cabot Square, Canary Wharf, London, E14 4QA.Morgan Stanley Investment Management Limited Milan Branch (Sede Secondaria di Milano) con sede in Palazzo Serbelloni,
Corso Venezia 16, 20121 Milano, Italia, registrata in Italia con codice fiscale e P. IVA 08829360968. Paesi Bassi: Morgan Stanley Investment Management, Rembrandt Tower, 11th Floor
Amstelplein 1 1096HA, Paesi Bassi.Telefono:31 2-0462-1300.Morgan Stanley Investment Management è una filiale di Morgan Stanley Investment Management Limited. MorganStanley
Investment Management Limited è autorizzata e regolamentata dalla Financial Conduct Authority nel Regno Unito. Svizzera: Morgan Stanley & Co. International plc, London, Zurich
Branch, autorizzata e regolamentata dall’Autorità federale di vigilanza sui mercati finanziari (“FINMA”). Iscritta al Registro di commercio di Zurigo CHE-115.415.770.Sede
legale:Beethovenstrasse 33, 8002 Zurigo, Svizzera, telefono +41 (0) 44 588 1000.Facsimile Fax:+41(0)44 588 1074.
40Informative legate agli adempimenti di legge
INFORMAZIONI IMPORTANTI
EMEA: La presente comunicazione di marketing è stata pubblicata da Morgan Stanley Investment Management Limited (“MSIM”). Società autorizzata e regolamentata dalla
Financial Conduct Authority. Registrata in Inghilterra con il n. 1981121. Sede legale: 25 Cabot Square, Canary Wharf, London E14 4QA.
Il presente documento contiene informazioni relative al comparto (“Comparto”) di Morgan Stanley Investment Funds, una società d'investimento a capitale variabile di diritto
lussemburghese (Société d’Investissement à Capital Variable).Morgan Stanley Investment Funds (la “Società”) è registrata nel Granducato di Lussemburgo come organismo d’investimento
collettivo ai sensi della Parte 1 della Legge del 17 dicembre 2010 e successive modifiche. La Società è un organismo d’investimento collettivo in valori mobiliari (“OICVM”).
Prima dell’adesione al Comparto, gli investitori sono invitati a prendere visione dell’ultima versione del Prospetto informativo, del Documento contenente informazioni chiave per gli
investitori (“KIID”), della Relazione annuale e della Relazione semestrale (i “Documenti di offerta”) o di altri documenti disponibili nella rispettiva giurisdizione, che possono essere richiesti a
titolo gratuito presso la Sede legale della Società all’indirizzo: European Bank and Business Centre, 6B route de Trèves, L-2633 Senningerberg, R.C.S. Lussemburgo B 29 192.Inoltre, gli
investitori italiani sono invitati a prendere visione del “Modulo completo di sottoscrizione” (Extended Application Form), mentre la sezione “Informazioni supplementari per Hong Kong”
(“Additional Information for Hong Kong Investors”) all’interno del Prospetto riguarda specificamente gli investitori di Hong Kong.Copie gratuite in lingua tedesca del Prospetto informativo,
del Documento contenente informazioni chiave per gli investitori, dello Statuto e delle relazioni annuale e semestrale e ulteriori informazioni possono essere ottenute dal rappresentante in
Svizzera.Il rappresentante in Svizzera è Carnegie Fund Services S.A., 11, rue du Général-Dufour, 1204 Ginevra. L’agente pagatore in Svizzera è Banque Cantonale de Genève, 17, quai de l’Ile,
1204 Ginevra. Il documento è stato redatto a solo scopo informativo e non è da intendersi come una raccomandazione o un’offerta per l’acquisto o la vendita di valori mobiliari o l’adozione
di una qualsiasi strategia d’investimento.
Tutti gli indici cui si fa riferimento nel presente documento sono proprietà intellettuale (inclusi i marchi commerciali registrati) dei rispettivi licenzianti. Eventuali prodotti basati su un indice
non sono in alcun modo sponsorizzati, approvati, venduti o promossi dal rispettivo licenziante e il licenziante declina ogni responsabilità in merito.
Tutti gli investimenti comportano dei rischi, tra cui la possibile perdita del capitale. Le informazioni contenute nel presente documento non tengono conto delle circostanze personali del
singolo cliente e non rappresentano una consulenza d’investimento, né sono in alcun modo da interpretarsi quale consulenza fiscale, contabile, legale o normativa. A tal fine, nonché per
conoscere le implicazioni fiscali di eventuali investimenti, si raccomanda agli investitori di rivolgersi a consulenti legali e finanziari indipendenti prima di prendere qualsiasi decisione
d’investimento.
Le opinioni espresse in questa presentazione sono quelle del team di investimento di MSIM e possono variare in base alle condizioni di mercato. Le opinioni espresse non sono
necessariamente quelle degli altri gestori di portafoglio MSIM e potrebbero non trovare riscontro in tutte le strategie e i prodotti offerti dalla Società.
Tabelle e grafici sono forniti a solo scopo illustrativo. Il materiale è stato preparato utilizzando fonti d’informazione generalmente ritenute attendibili, ma non se ne può garantire in alcun
modo la correttezza.
Le informazioni contenute nella presente comunicazione non costituiscono una raccomandazione di ricerca o una “ricerca in materia di investimenti” e sono classificate come
“Comunicazione di marketing” ai sensi delle normative europee o svizzere applicabili. Pertanto, questa comunicazione di marketing (a) non è stata predisposta in conformità ai requisiti di
legge tesi a promuovere l’indipendenza della ricerca in materia di investimenti e (b) non è soggetta ad alcun divieto di negoziazione prima della diffusione della ricerca in materia di
investimenti.
MSIM non ha autorizzato gli intermediari finanziari a utilizzare e distribuire il presente documento, a meno che tale utilizzo e distribuzione avvengano in conformità alle leggi e normative
vigenti. MSIM non può essere ritenuta responsabile e declina ogni responsabilità in merito all’utilizzo proprio o improprio del presente documento da parte degli intermediari finanziari. Per
i soggetti incaricati del collocamento dei comparti di Morgan Stanley Investment Funds, non tutti i comparti e non tutte le azioni dei comparti potrebbero essere disponibili per la
distribuzione. Si invita a consultare il contratto di collocamento per ulteriori dettagli in merito prima di inoltrare informazioni sui comparti ai propri clienti.
Il presente documento non può essere riprodotto, copiato o trasmesso, integralmente o in parte, e i suoi contenuti non possono essere divulgati a terzi senza l’esplicito consenso scritto di
MSIM.
Tutte le informazioni contenute nel presente documento sono proprietarie ed è protetta dalla legge sul copyright.
Il presente documento potrebbe essere stato tradotto in altre lingue. La versione originale in lingua inglese è quella definitiva. In caso di discrepanze tra la versione inglese e quella in altre
lingue del presente documento, farà fede la versione inglese.
41Puoi anche leggere