Approccio algoritmico per l'applicazione degli standard grafici in ambiente BIM - FrancoAngeli
←
→
Trascrizione del contenuto della pagina
Se il tuo browser non visualizza correttamente la pagina, ti preghiamo di leggere il contenuto della pagina quaggiù
42° Convegno Internazionale
                                                             dei Docenti delle Discipline della Rappresentazione
                                                                  Congresso della Unione Italiana per il Disegno

Approccio algoritmico per l’applicazione
degli standard grafici in ambiente BIM
Matteo Del Giudice
Emmanuele Iacono

Abstract

L’innovazione tecnologica sta attualmente cambiando l’industria delle costruzioni, influenzata dal pro-
cesso di digitalizzazione della quarta rivoluzione industriale.
Similmente, ciò influenza la capacità dei domini di dati di consentire connessioni tra informazioni
digitali sull’edificio e la loro rappresentazione, anche con l’uso di numerosi dispositivi IoT.
Una delle innovazioni è lo sviluppo di database digitali basati sulla metodologia BIM, che permette lo
scambio informativo effettuato usando strategie di rappresentazione sia tradizionali che innovative.
Ciò è dovuto alle necessità dell’era della connessione, che richiede modelli basati su rete con un alto
livello di maturità BIM.
Poiché la produzione di contenuti di progetto si affida ancora a standard e convenzioni tradizionali, il
contributo mira a valutare la capacità dei modelli collaborativi BIM di produrre elaborati grafici 2D e
3D, secondo le fasi attuali del processo edilizio.
Considerando la differenza tra viste e disegni, lo studio fornisce un approccio analitico basato su algo-
ritmo che ottimizzi la visualizzazione degli oggetti BIM in base alla scala di rappresentazione associata
al loro livello di dettaglio grafico e alfanumerico.
Le sfide incontrate dal presente lavoro riguardano principalmente i limiti delle tecnologie attuali e il
contrasto tra metodologie BIM e standard grafici, che spingono perciò gli utilizzatori a manipolare
inefficentemente rappresentazioni BIM intelligenti con aggiunte manuali.

Parole chiave
Building Information Modeling; Visual Programming Language; standard grafici; BIM connesso; algoritmi.

                                                                         doi.org/10.3280/oa-548.24
                                     404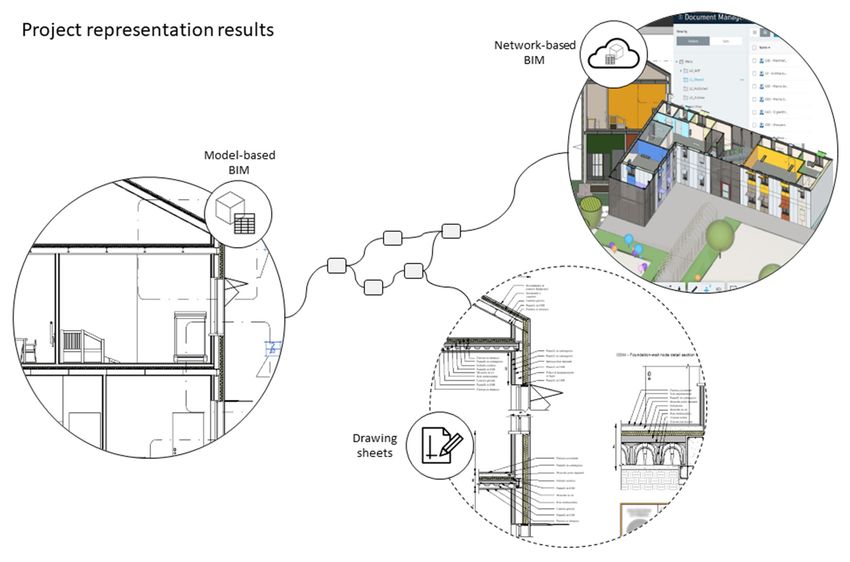
Introduzione

                                Negli ultimi anni, il settore delle costruzioni ha attraversato un processo di digitalizzazio-
                                ne influenzato dalle tecnologie dell’informazione e della comunicazione (TIC) che stanno
                                cambiando il modo di comunicare le idee progettuali. La società contemporanea, guidata
                                dall’innovazione tecnologica, si sta muovendo verso sistemi sempre più complessi e connessi
                                per ottimizzare la gestione dei dati e sviluppare città e società intelligenti.
                                L’introduzione di sensori negli edifici consente di sviluppare modelli innovativi di edificio
                                non solo attraverso i suoi componenti fisici, ma anche attraverso il suo comportamento
                                dinamico. Questi modelli necessitano di interfacce grafiche che devono essere in grado di
                                descrivere la realtà per soddisfare le esigenze degli stakeholder coinvolti.
                                Per questo motivo, la rappresentazione progettuale si sta dirigendo verso la metodologia
                                BIM (Building Information Modeling), basata sull’elaborazione di un modello 3D parametrico,
                                ricco di contenuti grafici e alfanumerici, in grado di ottimizzare la gestione informativa del
                                processo edilizio [Osello 2012].
                                I modelli informativi devono quindi essere organizzati per essere rappresentati non solo at-
                                traverso standard grafici e convenzioni, ma anche in modi innovativi come la realtà virtuale e
                                aumentata (VAR). In questo senso, lo sviluppo di modelli in grado di rappresentare gli edifici
                                e il loro comportamento comporta la generazione di un modello 3D parametrico collegato
                                ai vari sensori che devono essere connessi tra loro per la generazione di un gemello digitale
                                [Mateev 2020].
                                In questa era di connessione [Autodesk 2020], lo sviluppo di modelli BIM connessi dovrebbe
                                basarsi su: 1) set di dati in grado di descrivere le caratteristiche statiche e dinamiche dell’e-
                                dificio; 2) algoritmi in grado di elaborare grandi quantità di dati per conoscere il presente e
                                prevedere il futuro; 3) interfacce intelligenti per facilitare l’interazione uomo-macchina (fig.
                                1). Tutto ciò dovrebbe essere possibile condividendo informazioni tra gli utenti [Ratti et al.
                                2017; Garzino 2011].
                                Attualmente, il concetto di modello BIM collegato è spesso legato allo sviluppo di Common
                                Data Environment (CDE), non collegati tuttavia ad algoritmi che ottimizzino la rappresenta-
                                zione grafica in base ai requisiti di progettazione, non raggiungendo il livello di maturità BIM
                                richiesto per l’Integrated Project Delivery (IPD) [Underwood et al. 2009].
                                In realtà questo tipo di connessione implica, nel migliore dei casi, la possibilità di utilizzare
                                sistemi basati su cloud per la sola visualizzazione. Uno scenario migliore sarebbe quello in
                                cui tutti gli stakeholder possano essere in grado non solo di visualizzare, ma anche di agire
                                direttamente sul modello in avanzamento per i rispettivi settori.
                                Sebbene l’attuale processo BIM generi disegni di progetto significativamente migliori a se-
                                guito di uno schema integrato di modelli, strumenti analitici, Big Data e infrastrutture colla-

Fig. 1. Il concetto alla base
dell’idea del Connected
BIM.

                                                                  405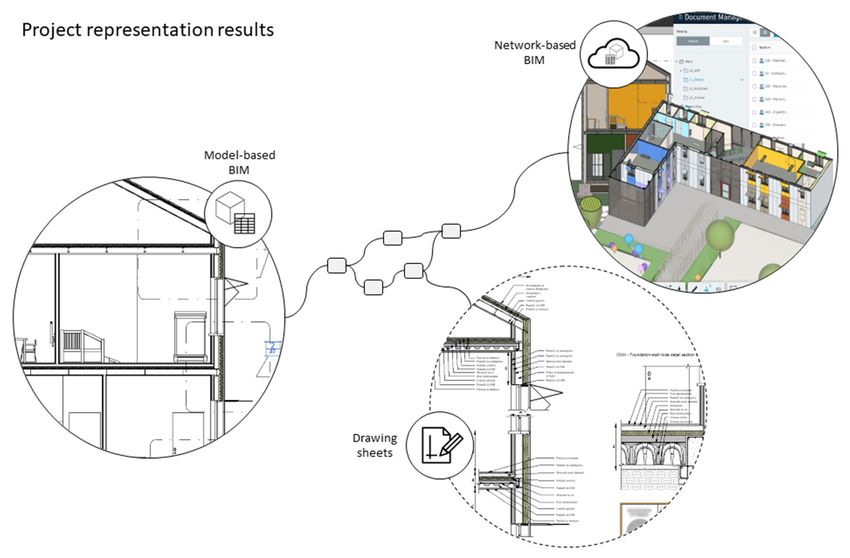
borative, attualmente esiste una deviazione tra la produzione di queste visualizzazioni e le
                           rappresentazioni grafiche che fanno riferimento a standard e convenzioni codificate nella
                           disciplina del disegno.
                           Questo documento presenta un approccio analitico basato su algoritmi finalizzato all’otti-
                           mizzazione della rappresentazione grafica del BIM. L’approccio proposto prevede l’applica-
                           zione automatica delle regole di rappresentazione applicate alle viste del modello BIM per
                           avvicinare i contenuti forniti dalle piattaforme BIM a quelli richiesti dalle norme sul disegno,
                           la cui analisi è stata avviata nell’ambito del corso di disegno tenuto dalla professoressa No-
                           vello presso il Politecnico di Torino.

Fig. 2. Una rappresenta-
zione della transizione
tra modelli File-based e
modelli Network-based.

                           Metodologia

                           Ad oggi, la creazione di un modello BIM correttamente collegato si basa su tre fasi principali:
                           1) definizione dell’input; 2) creazione di modelli 3D parametrici basati su file; 3) produzione
                           degli output. In particolare, lo sviluppo di un modello parametrico 3D parte da requisiti
                           informativi, specifiche sul disegno e convenzioni grafiche come input. Tali specificità devono
                           essere manipolate per ottenere output grafici e alfanumerici in grado di migliorare la comu-
                           nicazione del progetto.
                           Attualmente, il trattamento dei dati si basa su algoritmi strutturati ad-hoc per questo tipo di
                           operazioni di conversione, regolati dagli utenti autorizzati per la loro impostazione in fun-
                           zione di progetti, requisiti e output specifici. Attraverso tale attività, tutte le rappresentazioni
                           del progetto vengono rese conformi agli standard adottati senza ulteriore manipolazione,
                           con un risultante beneficio a livello grafico.
                           L’ottenimento di un modello BIM connesso (fig. 2) implica ad oggi il suo caricamento su una
                           piattaforma in rete per aumentare la condivisione di informazioni. Tale connessione tra il
                           modello su file e il modello in rete potrebbe essere regolata anche da algoritmi.
                           Per unificare le diverse modalità di rappresentazione del progetto, è innanzitutto fondamen-
                           tale considerare sia quelle riguardanti il processo di costruzione sia quelli della metodologia
                           BIM (fig. 3). Per quanto riguarda le prime, nel Codice degli appalti pubblici (D.Lgs. 50/2016)
                           sono indicate alcune macrofasi del processo edilizio, in particolare per quanto riguarda la
                           fase di progettazione. Le fasi prima e dopo di essa sono aggiunte per completare la sequen-
                           za del processo. Dal punto di vista della metodologia BIM, tuttavia, ci sono livelli di sviluppo
                           (LOD), che la legislazione italiana suddivide in sette fasce, che variano l’una dall’altra per
                           contenuti grafici e informativi [De Gregorio 2018] [Novello et al. 2014]. Inoltre, esiste il
                           concetto di Graphic Detail (GraDe), proposto dal AEC (UK) BIM Protocol V2.0, che tuttavia

                                                              406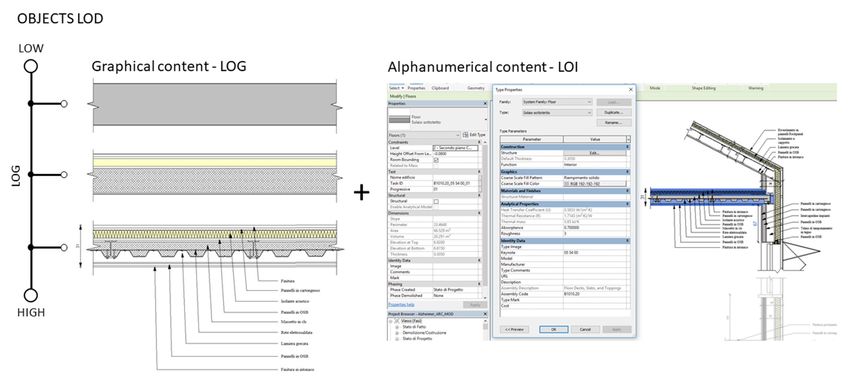
riguarda solo il contenuto grafico dei modelli [Caffi et al. 2017]. Individuando una corrispon-
                                denza tra queste tre diverse espressioni dell’evoluzione del progetto, attraverso le scale di
                                rappresentazione, è possibile tracciare un percorso logico che, a partire dalle esigenze di
                                progettazione e i requisiti della fase corrente del processo, imposti automaticamente rap-
                                presentazioni e contenuti corretti di tale fase.
                                Definiti fase, scala, LOD, e requisiti di progetto, il flusso di lavoro proposto (fig. 4) mostra
                                un algoritmo composto da una serie di matrici in grado di regolare la rappresentazione
                                del progetto di conseguenza. Idealmente, si procede come segue: a seconda della fase del
                                progetto in cui l’utente si trova, vi è una fase corrispondente del processo di costruzione,
                                che sia lo studio di fattibilità, la fase di progettazione definitiva o esecutiva. Questo è un pri-
                                mo input nello schema logico. Un secondo è dato dal LOD, in base al livello di dettaglio da
                                raggiungere nei vari elaborati di progetto e al rispettivo contenuto informativo. La possibilità

Fig. 3. Ipotesi del possibile
collegamento tra fasi del
progetto, LOD e GraDe
attraverso le scale di
rappresentazione.

                                di incrociare la fase del processo edilizio con il LOD, specialmente la componente grafica,
                                stabilisce le scale di rappresentazione corrette (1:500, 1:200, 1:100 ecc.) per soddisfare le
                                richieste iniziali. Dopodiché scala grafica e prodotti da consegnare sono correlati per comu-
                                nicare correttamente il progetto; quest’ultima costituisce il terzo e ultimo input dell’algorit-
                                mo. Il progetto, suddiviso nelle rappresentazioni richieste, incrocia le scale richieste dai primi
                                due input, generando una prima matrice dei documenti necessari per completare la fase
                                corrente del processo. In dettaglio, ogni elemento della matrice deve passare attraverso un
                                cosiddetto Filter, identificato per ogni tipo di vista (ad es. piante 1:200, sezioni 1:100, esecu-
                                tivi 1:50, dettagli 1:20 ecc.). Il filtro è una serie di requisiti di sistema, per i quali esistono una
                                o più impostazioni specifiche all’interno del software in uso (tipi e spessori di linea, tratteggi,
                                profili ecc.). L’operazione migliora la visualizzazione delle varie viste di modello secondo
                                le convenzioni e le norme sul disegno. Un secondo step riguarda ciò che è stato identifi-
                                cato come Enrichment, ossia un’implementazione specifica dei contenuti e delle viste del
                                modello. Ogni oggetto viene analizzato con operazioni che aggiungono elementi specifici
                                a esso attraverso categorie di elementi di dettaglio e linee di dettaglio, nonché operazioni
                                che agiscono sulle viste aggiungendo elementi di categorie di annotazione (cartigli, quote,
                                simboli, tag o testi). Una volta terminata la fase di arricchimento, è possibile produrre disegni

Fig. 4. Flusso
metodologico di un
processo pienamente
automatico per
il miglioramento
degli output di
rappresentazione
dell’edificio.

                                                                    407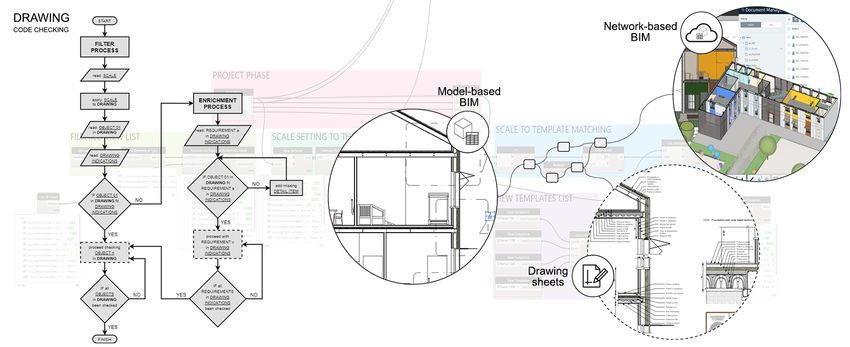
che soddisfano effettivamente i requisiti normativi, siano essi rappresentazioni 2D (piante,
                            prospetti, sezioni, abachi ecc.) o 3D (assonometrie, prospettive, render, VR/AR ecc.). Questi
                            costituiscono l’output finale del processo logico, sul quale è ancora possibile eseguire una va-
                            lidazione, fornendo un responso sulla correttezza dei filtri impostati all’interno del software.
                            Il prodotto di questa complessa serie di operazioni è il miglioramento del Level of Geo-
                            metry (LOG) e l’aggiunta di vari elementi di dettaglio che aiutano a comprendere le fasi di
                            progetto più avanzate, così come il miglioramento del Level of Information (LOI) [Pavan et al.,
                            2017] (fig. 5). A seconda degli strumenti di BIM authoring utilizzati, questa operazione com-

Fig. 5. Esempio di
contenuti grafici e
alfanumerici dei LOD.

                            porta diversi sottoinsiemi di impostazioni di rappresentazione, basati su filtri grafici, aggiunta
                            di componenti, annotazioni, compilazione manuale o automatica di varie proprietà dell’og-
                            getto. Per questo studio, Autodesk Revit è stata scelto come piattaforma BIM authoring per
                            valutare i punti di forza e debolezza del modello informativo. Il livello di automazione è un
                            punto cruciale in questo processo, poiché a seconda della sua incidenza, tale processo di-
                            venta più o meno impegnativo.
                            Il diagramma di flusso (fig. 6) raffigura un’ipotetica sequenza di operazioni per l’algoritmo
                            responsabile della validazione. Per ogni vista del modello, la scala di rappresentazione è data

Fig. 6. A sinistra,
uno schema logico
dell’algoritmo proposto;
a destra, una parte dello
script testato.

                                                               408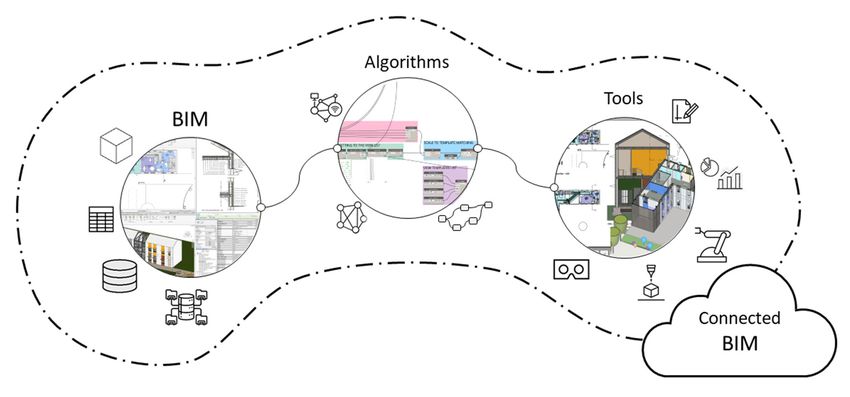
come primo input e immediatamente associata alla vista. Oggetto per oggetto, si verifica la
rispondenza alle norme del disegno. Se la rappresentazione è corretta, l’algoritmo procede
con l’oggetto successivo; in caso contrario, inizia il processo di verifica e arricchimento. Tale
processo considera, per ciascun oggetto, i requisiti specifici e le richieste normative. Per
ognuno di questi, in caso di non conformità alle norme, il passo successivo è l’implementa-
zione dell’oggetto con gli elementi mancanti necessari. Dopodiché, l’algoritmo prosegue con
il requisito successivo, fino al soddisfacimento di ciascuno. A procedura completata, l’oggetto
è considerato conforme alle norme, e l’elaboratore procede a cascata con gli altri oggetti.
Lo schema logico, che rappresenta gli e che devono essere seguiti dalla macchina, è stato
tradotto come Linguaggio di Programmazione Visuale (VPL) eseguibile dalla piattaforma
BIM authoring (fig. 6). Lo script visibile sulla destra è il prototipo testato di una sezione dell’al-
goritmo completo, che deve essere ancora implementato nella sua interezza.
Risultati
Attualmente, la produzione di modelli BIM connessi in grado di rappresentare le informa-
zioni del progetto è un concetto migliorabile per ottenere un processo più efficiente sia
per la rappresentazione dei dati che per il processo IPD. In particolare, per lo sviluppo di un
archivio digitale ottimizzato in grado di raccogliere informazioni grafiche ed alfanumeriche
si deve ancora considerare come input sia i requisiti informativi che le impostazioni grafiche.
Questo contributo evidenzia la bontà dell’introdurre passaggi automatici nel processo edi-
lizio per facilitare la produzione di disegni di progetto, stabilendo una connessione tra input
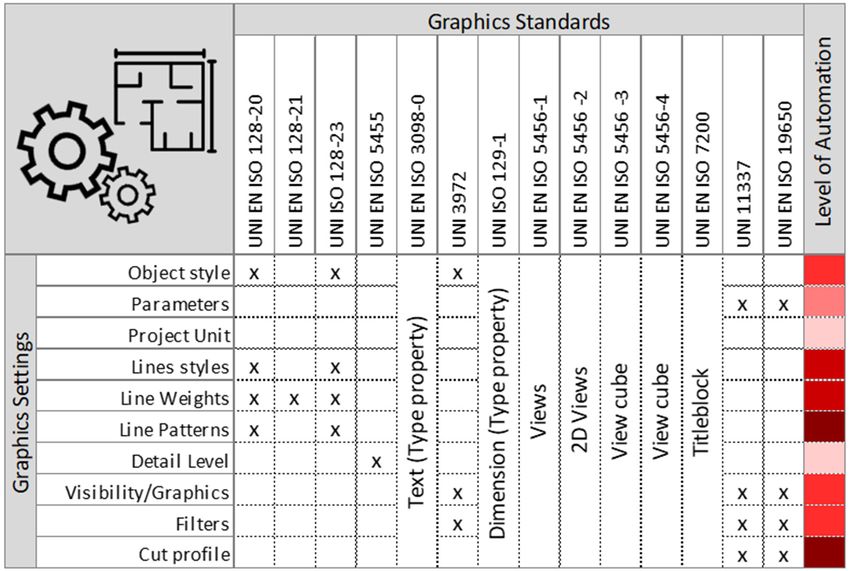
e output attraverso l’uso di standard grafici. Perciò, il livello di automazione necessario per
produrre corretti elaborati è stato valutato attraverso la visualizzazione grafica dello sforzo
necessario (fig. 7), considerando la corrispondenza tra gli standard grafici e le impostazioni
del software. Ad esempio, l’impostazione Detail Level permette di regolare la visibilità dei
vari oggetti del modello in modo più semplice rispetto all’impostazione Cut profile che ri-
chiede uno sforzo maggiore, in quanto deve essere applicata a ogni oggetto.
Quindi, il processo automatico proposto presenta ancora alcune criticità, dovute sia ai limiti
tecnologici attuali sia all’unicità di ogni progetto, per scelte tecniche e costruttive.
Fig. 7. Valutazione del
livello di automazione
relativo alle impostazioni
grafiche con i loro
rispettivi standard grafici.
409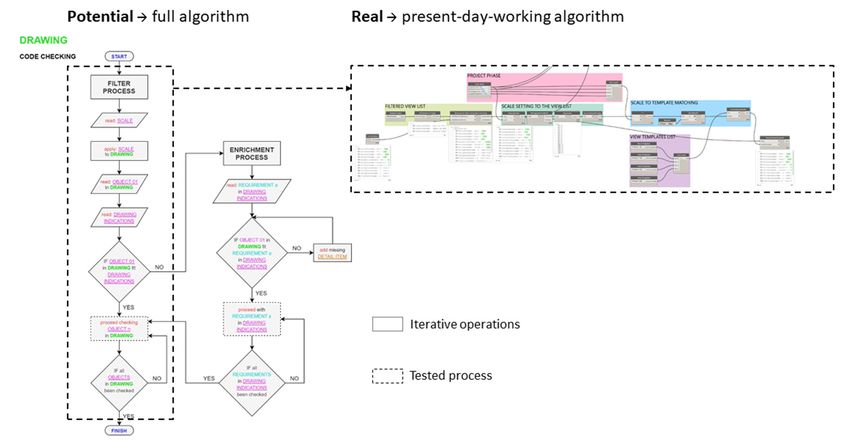
In pratica, è possibile agire sul processo di filtraggio, attraverso impostazioni che possono
                        essere incorporate nei template di progetto modificate tramite script (es. script Dynamo), in
                        base alla scala di rappresentazione impostata per specifiche viste. D’altra parte, la completa
                        automazione della fase di arricchimento è ancora perfettibile, poiché molti elementi di que-
                        sta fase del processo devono essere inseriti singolarmente. Di fatto, lo sviluppo di disegni
                        dai modelli BIM implica anche la collocazione di altri tipi di oggetti, come i Detail Items e le
                        Annotations, che determinano una migliore comunicazione del progetto.
                        Il contributo proposto fa risaltare che lo sforzo necessario per completare i diversi compiti
                        che fanno parte del processo di rappresentazione è differente, a seconda della funzionalità
                        selezionata, attivata o utilizzata in una particolare vista o gruppo di viste.
                        Questo contributo ha indagato anche la congruità delle scale LOD alle fasi di progettazione,
                        cercando di stabilire una corrispondenza con le relative scale rappresentazione. Pertanto, il
                        livello informativo prodotto nelle tavole di progetto deve essere considerato uno dei requi-
                        siti per la definizione dei level of information need definiti dalla ISO 19650.

                        Conclusioni

                        In quest’epoca della connessione, l’industria delle costruzioni è orientata verso l’adozione di
                        un processo BIM basato sull’elaborazione di un modello parametrico che ottimizzi la comu-
                        nicazione tra gli attori coinvolti. Attività come lo sviluppo di prodotti progettuali e l’aggior-
                        namento informativo lungo tutto il ciclo di vita dell’edificio dovrebbero essere basate sullo
                        sviluppo di un modello collegato a banche dati eterogenee per lo sviluppo di una smart city.
                        Per questo motivo, l’automatizzazione del processo di creazione di documenti rispondenti
                        ai requisiti normativi è stata analizzata in questo contributo per colmare il divario attuale
                        tra semplice visualizzazione e corretta rappresentazione (fig. 8). Un ulteriore miglioramento
                        potrebbe essere l’autoregolazione di tali algoritmi in risposta ai dati immessi. In futuro, la
                        definizione dei requisiti dei documenti di progetto potrà essere ulteriormente codificata
                        attraverso sistemi in grado di rielaborare le informazioni raccolte nei vari database, per
                        trasferirle in rappresentazioni finalizzate della realtà.
                        Poiché attualmente la condivisione delle informazioni è molto complessa e limitata, auspi-
                        cabilmente nel prossimo futuro l’innovazione tecnologica favorirà metodi e strumenti per
                        realizzare un modello BIM connesso da utilizzare con diverse interfacce per le molteplici
                        specificità della società.

Fig. 8. Interazione
ideale tra il modello
BIM connesso e le sue
rappresentazioni.

                                                          410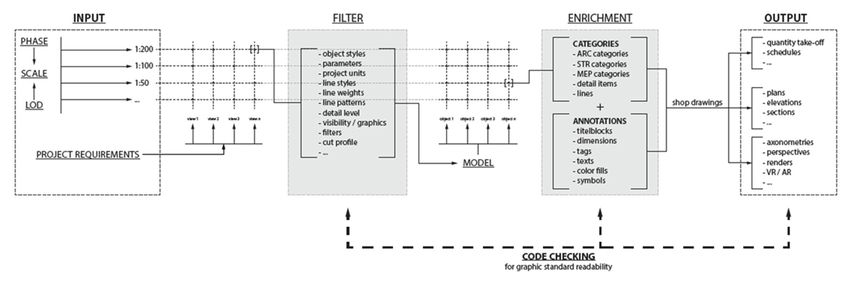
Ringraziamenti

Gli autori concordano sui contenuti, l’approccio metodologico e sulle considerazioni finali presentati in questa ricerca. In
particolare, Matteo Del Giudice ha introdotto il contributo nel primo paragrafo sviluppando l’introduzione. La metodologia è
stata affrontata sia da Matteo Del Giudice che da Emmanuele Iacono. Quest’ultimo si è dedicato ai risultati ottenuti, mentre le
conclusioni vogliono essere una sintesi dei due autori. Si ringrazia la tesista Isabella Dusi per aver acconsentito alla diffusione
di alcuni contenuti sviluppati nella sua tesi di laurea

Riferimenti bibliografici

Autodesk (2020). BIM and the cloud for building design. Improved project insight with connected BIM. Autodesk.comhttps://
www.autodesk.com/solutions/bim/discover-building-design/bim-for-building-design. Retrieved Februray 19th, 2020.

De Gregorio Marco (2018). BIM: la normazione nel futuro dell’edilizia. In U&C Dossier UNI, 8, pp. 19-34.

Caffi Vittorio et al. (2017). Il BIM e gli standard di modellazione e rappresentazione. Il processo edilizio supportato dal BIM: l’ap-
proccio INNOVance. Roma: Edilstampa.

Garzino Giorgio (2011). Disegno (e) in_formazione. Disegno politecnico. Segrate (MI): Politecnica, Maggioli Editore.

Mateev Michael (2020). Industry 4.0 and the digital twin for building industry. In International Scientific Journals of Scientific
Technical Union of Mechanical Engineering “Industry 4.0”, Issue 1, vol. 5, pp. 29-32.

Novello Giuseppa, Lo Turco Massimiliano (2014). Linee guida per la modellazione dei componenti in ambiente BIM. Torino: Po-
litecnico di Torino.
Osello Anna (2012). Il futuro del disegno con il BIM per Ingegneri e Architetti. Roma: Gangemi Editore.

Pavan Alberto, Mirarchi Claudio, Giani Matteo (2017). BIM: metodi e strumenti. Progettare, costruire e gestire nell’era digitale.
Milano: Tecniche Nuove.

Ratti Carlo, Claudel Matthew (2017). La città di domani. Come le reti stanno cambiando il futuro urbano. Torino: Einaudi.

Succar Bilal (2009). Building Information Modelling Maturity Matrix. In Underwood Jason, Isikdag Umit. Handbook of Research on
Building Information Modelling and Construction Informatics: Concepts and Technologies, pp. 65-103. Information Science Reference,
IGI Publishing.

Autori
Matteo Del Giudice, Politecnico di Torino, matteo.delgiudice@polito.it
Emmanuele Iacono, Università del Piemonte, emmanuele.iacono@uniupo.it

Per citare questo capitolo: Del Giudice Matteo, Iacono Emmanuele (2020). Approccio algoritmico per l’applicazione degli standard grafici in
ambiente BIM/Algorithmic approach for the application of graphic standards in the BIM environment. In Arena A., Arena M., Brandolino R.G.,
Colistra D., Ginex G., Mediati D., Nucifora S., Raffa P. (a cura di). Connettere. Un disegno per annodare e tessere. Atti del 42° Convegno Internazionale
dei Docenti delle Discipline della Rappresentazione/Connecting. Drawing for weaving relationships. Proceedings of the 42th International Conference of
Representation Disciplines Teachers. Milano: FrancoAngeli, pp. 404-419.

Copyright © 2020 by FrancoAngeli s.r.l. Milano, Italy                                                                           Isbn 9788835104490

                                                      411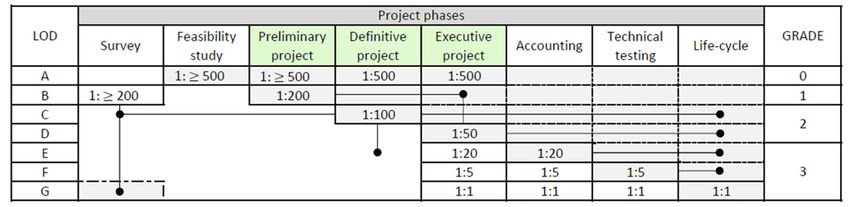
42th International Conference
                                                                       of Representation Disciplines Teachers
                                                                    Congress of Unione Italiana per il Disegno

Algorithmic Approach for the Application
of Graphic Standards in the BIM
Environment
Matteo Del Giudice
Emmanuele Iacono

Abstract

Technology and innovation are currently changing the building industry, influenced by the digitization
process of the 4th industrial revolution.
Likewise, this growth affects the capability of data domains to enable connections between digital
building information and representation collected over its entire lifecycle with several IoT devices.
One of the innovations is the development of digital repositories based on the Building Information
Modeling (BIM) methodology, which allows information delivery using both traditional and innovative
representation strategies, as this era of connection requires network-based models with high BIM
maturity level.
Since the production of project material still relies on traditional drawing standards, the paper aims to
assess the ability of collaborative BIM models to deliver 2D and 3D graphical production, according
to the building process phases.
Considering the difference between views and drawings, the contribution provides an algorithm-ba-
sed analytical approach capable of optimizing the BIM objects visualization, according to the scale of
representation associated with their level of graphical and alphanumerical detail.
The challenges found by the present study are mainly issues concerning the limits of current techno-
logy and the contrast between object-based methodologies and sign-based standards, which force
users to inefficiently manipulate smart BIM representations with manual additions.

Keywords
Building Information Modeling; Visual Programming Language; graphic standards; connected BIM;
algorithms.

                                                                       doi.org/10.3280/oa-548.24
                                     412
Introduction

                             In recent years, the construction sector has been going through a digitization process in-
                             fluenced by Information and Communication Technologies (ICTs) that are changing the way
                             to communicate design ideas. Contemporary society, led by technology innovation, is mo-
                             ving towards increasingly complex and connected systems to optimize data management
                             and develop smart cities and smart societies.
                             The introduction of building sensor networks allows developing innovative building models
                             not only through its physical components, but also through its dynamic behavior. These mo-
                             dels therefore need graphical interfaces that must be able to describe reality to fulfill the
                             needs of the stakeholders involved.
                             For this reason, the design representation is heading towards the Building Information Mo-
                             delling (BIM) methodology, based on the elaboration of a parametric 3D model, rich of
                             graphical and alphanumerical contents, able to optimize the information management of the
                             building process [Osello 2012].
                             The informative models must then be organized in order to be represented not only throu-
                             gh graphical standards and conventions but also in innovative ways such as Virtual and Aug-
                             mented Reality (VAR). In this sense, the development of models able to represent physical
                             buildings and their behavior involves the generation of a parametric 3D model linked to the
                             various sensors that must be connected to each other for the generation of a digital twin
                             [Mateev 2020].
                             In this era of connection [Autodesk 2020], the development of connected BIM models
                             should be based on: 1) datasets capable of describing static and dynamic building characte-
                             ristics; 2) algorithms capable of processing large amounts of data to know the present and
                             predict the future; 3) smart interfaces to facilitate human-machine interaction (fig. 1). All of
                             this should be possible by sharing information among users [Ratti et al. 2017; Garzino 2011].
                             Currently, the concept of connected BIM model is often linked to the development of Com-
                             mon Data Environments (CDEs), which however, are not linked with algorithms capable of
                             optimizing the graphical representation according to the design requirement, not reaching
                             the proper BIM maturity level required for Integrated Project Delivery (IPD) [Underwood
                             et al. 2009].
                             The reality is also that this type of connection means, at best, the possibility of using cloud-ba-
                             sed systems for the sole visualization of these models. A best scenario would be one in whi-
                             ch all the stakeholders could be able not only to just visualize but also to act directly on the
                             work-in-progress model for what their respective field of work is concerned.
                             Although the current BIM process generates significantly improved design drawings as a
                             result of an integrated scheme of models, analytical tools, Big Data, and collaborative in-

Fig. 1. The concept behind
the Connected BIM idea.

                                                                413
frastructures, there is currently a deviation between the production of these visualizations
and the graphical representations that refer to standards and conventions encoded in the
drawing discipline.
This paper presents an algorithm-based analytical approach aimed at optimizing the BIM-ba-
sed graphical representation. The proposed approach involves the automatic application of
the representation rules applied to BIM model views to bring the contents provided by
the BIM platforms closer to those required by drawing regulation, of which the analysis has
begun in the context of the drawing course held by prof. Novello at Politecnico di Torino.
Fig. 2. A representation of
the transition between
File-based models and
Network-based model.
Methodology
Currently, the creation of a proper connected BIM model is based on three main steps: 1)
input definition; 2) 3D parametric file-based model creation; 3) outputs production. In par-
ticular, the development of a 3D parametric model starts from information requirements,
drawing specifications and graphical conventions as an input. These have to be manipulated
to achieve graphical and alphanumerical outputs able to improve the communication of the
project.
The manipulation process is currently based on algorithms that are structured ad-hoc for
these kinds of conversion operations, and which are regulated by the users allowed to set
them for the specific project, requirements and outputs. This way, all the project represen-
tations are made compliant to the adopted standards without further manipulation, with a
resulting benefit on the representation level.
At the present day, the achievement of a connected BIM model (fig. 2) implies its upload
into a network-based platform to increase the level of information sharing. This kind of
connection between the file-based model and the network model could be regulated by
algorithms as well.
To unify the different modes of project representation, it is first of all fundamental to con-
sider both those concerning the building process itself and those of the BIM methodology
(fig. 3). Regarding the former, the Public Contracts Code (Legislative Decree 50/2016),
some macro-phases of the building process are indicated, in particular concerning the de-
sign phase. The phases before and after the design ones are added to complete the pro-
cess sequence. On the BIM methodology side, however, there are Levels of Development
(LOD), which the Italian legislation splits in seven bands, varying from one another in both
graphical and informative contents [De Gregorio 2018] [Novello et al. 2014]. Moreover,
there is the concept of Graphic Detail (GraDe), proposed by the AEC (UK) BIM Protocol
414V2.0, which however only concerns the graphic content of the models [Caffi et al. 2017]. By
identifying a correspondence between these three different expressions of the project evo-
lution, through the scales of representation, it is possible to trace a logical path that allows,
starting from the design needs and requirements of the current phase of the process, to set
automatically the correct representations and contents of such phase.
Once the phase, scale, LOD, as well as the project requirements are laid out, the proposed
workflow (fig. 4) shows an algorithm made by a series of matrices able to set the project
representation accordingly. Ideally, it goes as follows: depending on the moment of the
project in which the user is, there is a corresponding phase of the building process, be it the
feasibility study, the definitive design phase, or the executive design phase.This is a first input
into the logical scheme. A second one is given by the LOD, according to the level of detail
to be achieved in the various project elaborations, and the respective information content.
Fig. 3. Hypothesis of the
possible linking between
design phases, LOD
and GraDe through
representation scales.
The possibility to cross the phase of the building process with the LOD, in particular with
the graphic component related to the LOD, establishes what the correct representation
scales are (i.e. 1:500, 1:200, 1:100 etc.) to fulfill the project requests. Immediately following
this there is the correlation between the scale of representation and the products to be
delivered in order to correctly communicate the project; the latter also constitutes the third
and final input given to the algorithm. The project, divided into its required representations,
crosses the scales required by the first two inputs, generating a first matrix of the documen-
ts necessary in order to complete the phase of the process in which the designer is working.
More in detail, each element of this matrix must be passed through a so-called ‘Filter’, iden-
tified for each type of view (i.e. 1:200 plans, 1:100 sections, 1:50 executive drawings, 1:20
details etc.). The filter is a series of system requirements, for which there is one or more
specific settings within the software used (line thicknesses, line types, hatches, profiles etc.).
This operation should optimize the visualization of the various views of the model according
to the conventions and regulations on drawing and representation. A second step concerns
what has been identified with the term ‘Enrichment’, that being a specific implementation of
the contents and views of the model. Each model object is evaluated with operations that
add specific elements to those objects through categories of detail elements and detail lines,
Fig. 4. Methodological
workflow of a fully
automatic process for the
improvement of building
representation outputs.
415as well as operations that act on the views by adding annotation categories elements (i.e.
title blocks, dimensions, symbols, tags or texts). Once the enrichment step is finished, shop
drawings that actually meet the regulatory requirements can be produced, whether they
are 2D (plans, elevations, sections, schedules etc.) or 3D representations (axonometric, per-
spective, render,VR/AR etc.).These establish the final output of the logical process, on which
it is still possible to carry out a code checking, providing a feedback on the correctness of
the filters set within the software.
The product of this set of complex operations is the improvement of the Level of Geome-
try (LOG) and the addition of various Detail Items helping to understand the more advan-
Fig. 5. Sample of graphical
and alphanumerical
content of LODs.
ced design stages, as well as the improvement of the Level of Information (LOI) [Pavan et al.
2017] (fig. 5). This operation involves, depending on the BIM authoring tools used, different
sub-sets of representation settings, based on graphical filters, components addition, annota-
tions, manual or automatic compilation of various object properties. For this study, Autodesk
Revit was selected as the BIM authoring platform to evaluate strengths and weaknesses of
the model. The level of automation is a crucial point in this process, since the less automa-
tion there is, the more effort-intensive the process becomes.
A flow chart (fig. 6) depicts a hypothetical operation sequence for the algorithm responsi-
ble for the code checking. For each view of the model, the drawing scale is initially given as
Fig. 6. On the left, a logical
scheme of the proposed
algorithm; on the right, a
part of the tested script.
416a first input and immediately associated to the view. Then, object by object, the standards
compliance of its representation is verified. If the representation is correct, the algorithm
proceeds with checking the next object; otherwise, the verification and enrichment process
starts. This process considers, for the object to be verified, the individual requirements and
regulatory requests. For each of these requirements, if there is not a correct compliance
with the standards, then the next step is the implementation of the object with the missing
elements necessary to satisfy the request. Subsequently, the algorithm goes on with the next
requirement, until each of them is satisfied. Once the procedure is complete, the object
is considered compliant with the standards, and the machine proceeds with the following
object in the model.
The logical scheme, which represents the expression of the steps that have to be followed
by the machine, was translated as Visual Programming Language (VPL) to be executed by
the authoring BIM platform (fig. 6). In fact, the script visible on the right is the tested pro-
totype of a section of the full algorithm, which still needs to be implemented in its entirety.
Results
Currently, the production of connected BIM models able to represent the project informa-
tion is a concept that has to be improved in order to obtain a more efficient process both
for data representation and for IPD. In particular, the development of an optimal model
repository able to collect graphical and alphanumerical information still needs to consider
as an input both information requirements and graphical settings.
This contribution underlines the goodness of introducing automatic steps to facilitate the
production of project drawings establishing a connection between input and outputs throu-
gh the use of graphical standards. An evaluation of the level of automation necessary to pro-
duce the proper outputs, considering the correspondence between graphical standards and
the software settings, displays the amount of effort needed (fig. 7). For example, the Detail
Level setting allows to regulate the visibility of various model objects more straightforwardly
compared to the Cut profile setting, which needs more effort since it works as a one by one
operation.
Fig. 7. Evaluation of the
level of automation
related to the graphical
settings with their
respective graphical
standards.
417Moreover, this proposed automatic process still presents some flaws, due to both the limits
of current technology and the uniqueness of some features of each project, in terms of
technical and construction choices.
What can already be done is the filtering process, through settings that can be embedded
in project templates interchanged through scripts (i.e. Dynamo scripts), based on the re-
presentation scale that is set to be in specific views. On the other hand, a full automation
on the enrichment side is still to be perfected, since many elements of this process phase
need to be singularly manipulated. Indeed, the development of drawings implies also the
placement of other kinds of objects, such as Detail Items and Annotations, which provide a
better project communication.
What emerges from this study is that the effort needed to complete the different tasks that
are part of the representation process is different, depending on the feature that needs to
be used, engaged, or added in a particular view or set of views.
This contribution investigated also the suitability of LOD ranges to the design phases, trying
to establish a correspondence with the related view scales. Therefore, the information level
produced in the design sheets has to be considered also one of the requirements for the
level of information need definition defined by ISO 19650.
Conclusions
In this current age of connection, the building industry is oriented towards the adoption of
a BIM process based on the elaboration of a parametric model which optimizes communi-
cation between the actors involved. Activities such as the production of project deliverables
and the updating of information throughout the building life cycle should be based on the
development of a model connected to heterogeneous datasets for the evolution of a smart
city. The automation of the process of creating documents that meet the regulatory require-
ments has been analyzed in this contribution to bridge the gap between simple visualization
and correct representation (fig. 8). A further improvement would be such algorithms being
able to self-regulate in response to the given inputs. In the future, the definition of project
documents requirements can be further codified through systems able to re-process the
information contained in the various databases in order to transfer it into codified represen-
tations of reality.
Since information sharing is currently highly complex and limited, hopefully in the near future
technological innovation will favor methods and tools for achieving a connected BIM model
that can be used through different interfaces for the different specificities of society.
Fig. 8. Ideal interaction
between the connected
BIM model with its
representations.
418Acknowledgements
The authors agree on the contents, the methodological approach and on the final considerations presented in this research. In
particular, Matteo Del Giudice introduced the contribution in the introduction paragraph. The methodology was investigated
by both Matteo Del Giudice and Emmanuele Iacono. Moreover, the latter explained the obtained results, while the conclusions
are meant to be a synthesis of both the authors. The authors would like to thank the student Isabella Dusi for giving us the
permission of diffusing a part of the content of her thesis.
References
Autodesk (2020). BIM and the cloud for building design. Improved project insight with connected BIM. Autodesk.comhttps://
www.autodesk.com/solutions/bim/discover-building-design/bim-for-building-design. Retrieved Februray 19th, 2020.
De Gregorio Marco (2018). BIM: la normazione nel futuro dell’edilizia. In U&C Dossier UNI, 8, pp. 19-34.
Caffi Vittorio et al. (2017). Il BIM e gli standard di modellazione e rappresentazione. Il processo edilizio supportato dal BIM: l’ap-
proccio INNOVance. Roma: Edilstampa.
Garzino Giorgio (2011). Disegno (e) in_formazione. Disegno politecnico. Segrate (MI): Politecnica, Maggioli Editore.
Mateev Michael (2020). Industry 4.0 and the digital twin for building industry. In International Scientific Journals of Scientific
Technical Union of Mechanical Engineering “Industry 4.0”, Issue 1, vol. 5, pp. 29-32.
Novello Giuseppa, Lo Turco Massimiliano (2014). Linee guida per la modellazione dei componenti in ambiente BIM. Torino: Po-
litecnico di Torino.
Osello Anna (2012). Il futuro del disegno con il BIM per Ingegneri e Architetti. Roma: Gangemi Editore.
Pavan Alberto, Mirarchi Claudio, Giani Matteo (2017). BIM: metodi e strumenti. Progettare, costruire e gestire nell’era digitale.
Milano: Tecniche Nuove.
Ratti Carlo, Claudel Matthew (2017). La città di domani. Come le reti stanno cambiando il futuro urbano. Torino: Einaudi.
Succar Bilal (2009). Building Information Modelling Maturity Matrix. In Underwood Jason, Isikdag Umit. Handbook of Research on
Building Information Modelling and Construction Informatics: Concepts and Technologies, pp. 65-103. Information Science Reference,
IGI Publishing.
Authors
Matteo Del Giudice, Politecnico di Torino, matteo.delgiudice@polito.it
Emmanuele Iacono, Università del Piemonte Orientale, emmanuele.iacono@uniupo.it
To cite this chapter: Del Giudice Matteo, Iacono Emmanuele (2020). Approccio algoritmico per l’applicazione degli standard grafici in ambiente
BIM/Algorithmic approach for the application of graphic standards in the BIM environment. In Arena A., Arena M., Brandolino R.G., Colistra D.,
Ginex G., Mediati D., Nucifora S., Raffa P. (a cura di). Connettere. Un disegno per annodare e tessere. Atti del 42° Convegno Internazionale dei Docenti
delle Discipline della Rappresentazione/Connecting. Drawing for weaving relationships. Proceedings of the 42th International Conference of Representa-
tion Disciplines Teachers. Milano: FrancoAngeli, pp. 404-419.
Copyright © 2020 by FrancoAngeli s.r.l. Milano, Italy Isbn 9788835104490
419Puoi anche leggere