RAPPORTO SUL MERCATO DELLE AUTOLINEE A LUNGA PERCORRENZA IN ITALIA | ANNO 2021 ITALIAN LONG-DISTANCE COACH TRANSPORT MARKET
←
→
Trascrizione del contenuto della pagina
Se il tuo browser non visualizza correttamente la pagina, ti preghiamo di leggere il contenuto della pagina quaggiù

TRASPOL report 1/22
RAPPORTO SUL M ERCATO DELLE AUTOLINEE A L UNGA
PERCORRENZA IN ITALIA | ANNO 2021
ITALIAN LONG-DISTANCE COACH TRANSPORT MARKET
REPORT | YEAR 2021

                 TRASPOL – Politecnico di Milano ||| Checkmybus.it
                                                       In collaboration with:
                                                                                1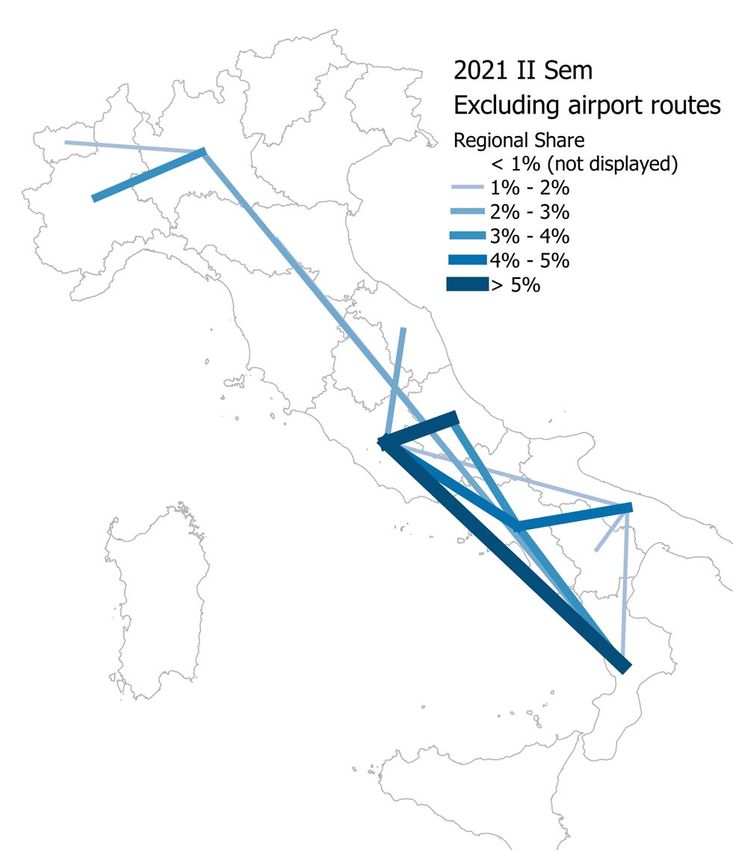
IL MERCATO DELLE AUTOLINEE A LUNGA PERCORRENZA IN ITALIA (Italian long-distance coach
transport market report )
Anno 2021 / Year 2021

Autori: Paolo Beria, Vardhman Lunkar, Samuel Tolentino

Il presente rapporto viene pubblicato periodicamente in collaborazione con Checkmybus.it, sulla base dei dati
raccolti sulla piattaforma.
The report is published in collaboration with Checkmybus.it based on the data available on Checkmybus.it website.

Please quote as follows:
 Beria P., Lunkar V., Tolentino S. (2022). Rapporto sul Mercato delle Autolinee a Lunga Percorrenza in Italia
 | Anno 2021. TRASPOL Report 1/22 & CheckMyBus. Milano, Italy.

Photo by Annie Spratt on Unsplash

TRASPOL – Laboratorio di Politica dei Trasporti
Dipartimento di Architettura e Studi Urbani, Politecnico di Milano
Via Bonardi 3, 20133, Milano, Italy.
http://www.traspol.polimi.it

                            TRASPOL – Politecnico di Milano ||| Checkmybus.it
                                                                                                                2
SOMMARIO

1   Premessa | Premise...........................................................................................................................................................4

2   Introduzione | Background ............................................................................................................................................6
3   Utenza delle autolinee | Coach users ............................................................................................................................9
4   L’andamento del mercato | Market development................................................................................................... 12
5   Indice dei prezzi | Price index..................................................................................................................................... 20
6   Metodologia | Methodology........................................................................................................................................ 30
7   Executive Summary....................................................................................................................................................... 33

                                         TRASPOL – Politecnico di Milano ||| Checkmybus.it
                                                                                                                                                                                3
1 P REMESSA | P REMISE

Questo    rapporto,    preparato    in    collaborazione con      This report has been prepared in collaboration with
Checkmybus.it, è la ottava edizione della serie di studi          Checkmybus.it. It is the eighth edition of the study
sull’andamento del mercato degli autobus di lunga                 on the long-distance coach market in Italy. The
                                                                  current research deals with market trends spanning
percorrenza in Italia. Il rapporto è dedicato al monitoraggio
                                                                  2017-2021, with a focus on prices.
dell’evoluzione del mercato tra gli anni 2017 e 2021 con un
                                                                  Such extensive research aims to be a valuable tool to
particolare focus sui prezzi.
                                                                  monitor the coach market evolution over the years,
Questa serie di studi vuole costituire uno strumento utile per    addressed both at coach companies and the public
monitorare l'evoluzione del mercato del trasporto passeggeri      regulators.
a lunga distanza su gomma nel corso degli anni, indirizzato       Given that the COVID-19 crisis is not yet solved,
sia alle compagnie di autotrasporto che ai regolatori pubblici.   this report continues, like the one of 2020, to
Poiché la crisi del COVID-19 non è ancora risolta, questo         highlight how the outbreak has impacted long-
rapporto continua ad approfondire come l'epidemia di              distance bus transport in Italy.
COVID-19 abbia avuto un impatto sul trasporto su
                                                                  This edition adopts the same structure and
autobus a lunga distanza.
                                                                  methodology as the previous edition. Results and
                                                                  comparisons for the airport connections have been
Questa edizione segue la stessa struttura e metodologia della
                                                                  dealt with separately, given their different
precedente. I collegamenti aeroportuali sono stati analizzati     behaviour.
separatamente poiché si sono evoluti come un sotto-mercato
specifico con comportamenti diversi.                              The    report is     freely   available   at   www.
                                                                  traspol.polimi.it and www.checkmybus.it. It is based
Il rapporto è liberamente scaricabile da www. checkmybus.it       on a sample of data collected by the Checkmybus.it
e da http://www.traspol.polimi.it ed è basato sul campione di     platform from January 2017 to December 2021.

dati raccolti dalla piattaforma di vendita Checkmybus.it da
                                                                  All methodological specifications are given in the
gennaio 2017 a dicembre 2021.
                                                                  last section.

Tutte le specifiche metodologiche sono raccolte nell’ultimo
capitolo.

                             TRASPOL – Politecnico di Milano ||| Checkmybus.it
                                                                                                                   4
Approfondimenti / Further material
Rapporti ANAV
2013. STUDIO SUL SERVIZIO AUTOBUS DI LUNGA PERCORRENZA IN ITALIA
Beria P., Grimaldi R., Laurino A. (2013). Long distance coach transport in Italy. State of the art and perspectives.
2014. IL TRASPORTO PASSEGGERI SU AUTOBUS PER LE LUNGHE DISTANZE.
Beria, P. et al. (2014). Spatial and scenario analyses of long-distance coach transport in Italy
2015. AUTOLINEE STATALI: GLI EFFETTI DELLA RIFORMA.
Beria P., Laurino A., Bertolin A., Grimaldi R. (2015). Long distance coach services: the effects of the reform. Results,
opportunities and critical aspects following the opening of the market.
Altri rapporti
2019. L TRASPORTO INTERURBANO CON AUTOBUS
Beria P., Tolentino S. (2019). IL TRASPORTO INTERURBANO CON AUTOBUS. Analisi del mercato delle autolinee a
lunga percorrenza dalla liberalizzazione ad oggi e focus sulla sicurezza rispetto agli incidenti stradali. Report preparato per
Autobusweb.
Edizioni precedenti del “Rapporto sul Mercato delle Autolinee a Lunga Percorrenza in Italia”
Beria P., Laurino A. (2016). Italian Long-Distance Coach Transport Market. Report Ist semester 2016.
Beria P., Nistri D., Laurino A. (2017). Italian Long-Distance Coach Transport Market. Report full year 2016.
Beria P., Nistri D. (2017). Italian Long-Distance Coach Transport Market. Report Ist semester 2017.
Beria P., Nistri D. (2018). Italian Long-Distance Coach Transport Market. Report full year 2017.
Beria P., Tolentino S. (2018). Italian Long-Distance Coach Transport Market. Summary Ist semester 2018.
Beria P., Tolentino S. (2019). Italian Long-Distance Coach Transport Market. Report full year 2018.
Beria P., Tolentino S., Vardhman L. (2020). Italian Long-Distance Coach Transport Market. Report full year 2019.
Beria P., Tolentino S., Vardhman L. (2021). Italian Long-Distance Coach Transport Market. Report full year 2020.
Articoli scientifici e libri
Grimaldi R., Augustin K., Beria P. (2017). Intercity coach liberalisation. The cases of Germany and Italy.
Transportation Research Procedia, 25, 474-490.
Beria P., Nistri D., Laurino A. (2018). Intercity coach liberalization in Italy: Fares determinants in an evolving
market, Research in Transportation Economics, 69, 260-269.
Beria P. (a cura di, 2018) Atlante dei trasporti italiani. Infrastrutture, offerta, domanda. Libreria Geografica,
Novara.
Beria P., Bertolin A. (2019). Evolving long-distance passenger services. Market concentration, fares and
specialisation patterns in Italy. Research in Transportation Economics, 74, 77-92.
Bertolin A., Tolentino S. (2019). Le autolinee di media e lunga percorrenza in Italia: evoluzione del settore da
prima della liberalizzazione ad oggi. Rivista di Economia e Politica dei Trasporti, n. 1, art. 2.
Lunkar, V., Beria, P., & Tolentino, S. (2022). Out of the spotlight: Four years of Italian coach market
prices. Research in Transportation Business & Management, 100798.
TRASPOL – Politecnico di Milano ||| Checkmybus.it
5
2 INTRODUZIONE | BACKGROUND

Come è ormai noto 1, l’apertura nel 2014 del mercato della                 After the complete deployment of liberalization in
lunga percorrenza su gomma si è rapidamente tradotta in                    2014, the operators introduced new routes and
nuove relazioni servite e/o nell’aumento delle frequenze                   increased frequency. Thus, the market uplifted in
                                                                           terms of demand, supply and geographical
settimanali, nella proposta di nuovi modelli di offerta
                                                                           coverage. Liberalization has also ramped up
(intercity, notturno tra grandi città, etc.) ed in un marcato
                                                                           competition in terms of active operators. New
utilizzo di tariffe differenziate, soprattutto sulle tratte in
                                                                           intercity connections with greater frequencies were
competizione con la ferrovia.                                              offered mainly in competition with the railway
Già dopo pochi mesi, il settore ha subito un importante                    services. (intercity, night-time between large cities,
cambiamento, con l’acquisto da parte di FlixBus di tutte le                seasonal routes etc.).
attività europee di Megabus, compreso il mercato italiano.                 After a few months, the market had already
Altri movimenti di rilievo nel mercato si sono avuti all'inizio            undergone a substantial change, with FlixBus
del 2017, quando FSI ha acquisito il 51% di SIMET, per                     acquiring all Megabus' European activities,
offrire servizi di autobus a lunga percorrenza con il marchio              including the Italian market.
                                                                           At the beginning of 2017, FSI acquired 51% of
Busitalia. Tuttavia, dopo meno di due anni di crescita, è
                                                                           SIMET to offer long-distance bus services under
avvenuta l'uscita dell'operatore ferroviario a seguito di una
                                                                           the Busitalia brand. However, after less than two
revisione del piano industriale, dunque il marchio ritorna
                                                                           years of growth, the railway operator exited
sotto il pieno controllo di SIMET. Parallelamente, FlixBus                 following a revision of the industrial plan;
ha continuato a rafforzare la propria posizione nei mercati                therefore, the brand returned under complete
del Nord e del Centro, con nuove rotte e partnership con                   control of SIMET.
imprese locali. Successivamente, è ripresa la penetrazione                 Increasing partnerships with local operators in the
nel mercato maggiormente presidiato dagli operatori storici,               North and the Center, FlixBus continued to
ovvero il Sud, con l’istituzione di collegamenti con la                    strengthen its presence in the Italian market by

Calabria da settembre 2018 e con la Sicilia da novembre                    adding new connections in Sicily and Calabria. The
                                                                           merging in later 2018 of Baltour, a company with
2018. Penultimo tassello della strategia di consolidamento di
                                                                           50 years of experience in Italy, with FlixBus and its
FlixBus è l’accordo di partnership raggiunto con Baltour,
                                                                           technological innovation led to an increase of
grazie al quale da metà novembre 2018 tutte le tratte                      domestic and international routes across all of Italy.
nazionali ed internazionali del Gruppo Baltour sono                        In October 2019, Marozzi, one of the first
acquistabili anche tramite i suoi canali di vendita ed è stato             companies to invest in road passenger transport,
dato un ulteriore impulso all’espandersi del network.                      passed the coverage of interregional lines to
Nell'ottobre 2019, Marozzi, che è stata una delle prime                    FlixBus. Frequency also increased in this case,
aziende a investire nel trasporto di passeggeri su strada, ha              especially on high demand routes like Bari-Roma,
ceduto le linee interregionali a FlixBus. Anche in questo caso             Bari-Naples, Lecce-Florence and Taranto-Florence.
la frequenza è aumentata, in particolare sulle rotte più                   In 2019 the new brand BlaBlaBus started
                                                                           operations. It is the outcome of the acquisition by
richieste come Bari-Roma, Bari-Napoli, Lecce-Firenze e
                                                                           BlaBlacar of the formerly SNCF-owned bus
Taranto-Firenze.
                                                                           company Ouibus. Initially operating on the French
Nel 2019 è diventata via via operativa BlaBlaBus, nuovo
                                                                           market, the newcomer has already partnerships
marchio di BlaBlaCar nato dall’acquisto da SNCF di Ouibus.                 with legacy carriers in Italy and Europe,

1Beria et al. (2015), Autolinee statali: gli effetti della riforma. Risultati, opportunità e criticità dell’apertura del mercato.
Report preparato per ANAV
                                 TRASPOL – Politecnico di Milano ||| Checkmybus.it
                                                                                                                               6
Inizialmente sul mercato francese, il nuovo entrante ha però       establishing a multimodal transport network that
già stretto partnership con vettori legacy in Italia ed Europa     offers carpooling and buses on a single platform.

per creare una rete di trasporto multimodale che offre             From January 2020, Sais Autolinee (a historical
                                                                   operator offering interregional and regional bus
carsharing e autobus su un'unica piattaforma.
                                                                   services) has started offering daily night and day
Da gennaio 2020, Sais Autolinee (un operatore storico che
                                                                   services to passengers on the Sicily-Calabria-Puglia
offre servizi di autobus regionali e interregionali) ha iniziato
                                                                   route.
a offrire servizi diurni e notturni giornalieri ai passeggeri      Despite the pandemic, in 2021 MarinoBus
sulla rotta Sicilia-Calabria-Puglia.                               expanded the travel solutions in Calabria and
Nonostante la pandemia, nel 2021 MarinoBus ha espanso le           established - in synergy with the local operator Egea
sue tratte in Calabria e, in collaborazione con l’operatore        Global Services - connections with Cosenza, Rende,
locale Egea Global Services, ha stabilito collegamenti con le      Tarsia, Spezzano and Frascineto.
città di Cosenza, Rende, Tarsia, Spezzano e Frascineto. A          In November 2021, MarinoBus and Autolinee
novembre 2021, MarinoBus e Autolinee Federico hanno                Federico announced partnership and established
                                                                   new connections to Calabria, from Naples, Rome,
annunciato la loro collaborazione e stabilito nuovi
                                                                   all of central-northern Italy and also to European
collegamenti per la Calabria, da Napoli, Roma, tutto il
                                                                   countries such as Switzerland, France, Luxembourg
centro-nord Italia e anche a paesi europei come Svizzera,
                                                                   and Germany. They also extended the service in
Francia, Lussemburgo e Germania. Con il lancio di questa           Reggio and Catanzaro with the launch of this
collaborazione hanno anche esteso il servizio a Reggio e           collaboration.
Catanzaro.                                                         A new major entry occurred on 27th May, 2021,
Una nuova entrata importante è avvenuta il 27 maggio 2021,         when the services of the newfounded Itabus
quando sono iniziati i servizi della neonata compagnia             commenced. It was declared that before its
Itabus. È stato dichiarato che prima del suo inizio erano già      commencement, 20.000 tickets were already sold.
stati venduti 20.000 biglietti. Itabus promette di soddisfare      Itabus promises to satisfy the mobility demand of
                                                                   Italians and to integrate the national transport
la domanda di mobilità degli italiani e di integrare la rete di
                                                                   network, gradually expanding its network based on
trasporto nazionale, espandendo gradualmente la sua rete in
                                                                   territorial capillarity, serving large cities and small
base alla capillarità territoriale, servendo grandi città e
                                                                   towns. When fully operational, its fleet, will boast
piccoli centri. A regime, la sua flotta vanterà 300 autobus di     300 latest generation buses, equipped with all the
ultima generazione, dotati di tutti i comfort e di sistemi di      comforts and state-of-the-art safety systems,
sicurezza all'avanguardia, offrendo viaggi di qualità a prezzi     offering quality travel at extremely competitive
estremamente competitivi sul mercato. A ottobre ha inoltre         prices on the market. In October, it also announced
annunciato la collaborazione con Enjoy (servizio di car            its collaboration with Enjoy (car sharing service by
sharing di Eni) per permettere a chi viaggia in autobus sulle      Eni) to permit those who travel by bus on medium
medie e lunghe distanze di proseguire il viaggio fino alla         and long distances to continue their journey to the
                                                                   final destination with car sharing.
destinazione finale con il car sharing.
                                                                   In February 2022, according to Acea data, the EU
A febbraio 2022, secondo i dati Acea, il mercato UE degli
                                                                   bus market fell by 12.9 percent with respect to
autobus è sceso del 12,9 per cento rispetto a gennaio 2022.
                                                                   January 2022. Among the four key markets in the
Tra i quattro mercati chiave della regione, l'Italia ha            region, Italy recorded double-digit gains (+32.1
registrato guadagni a due cifre (+32,1 per cento), seguita         percent), followed by Spain (+7.1 percent). France
dalla Spagna (+7,1 per cento). Francia e Germania, invece,         and Germany, on the other hand, suffered double-
hanno subito perdite a due cifre (rispettivamente -20,2 per        digit losses (-20.2 percent and -18.3 percent
cento e -18,3 per cento).                                          respectively).

                              TRASPOL – Politecnico di Milano ||| Checkmybus.it
                                                                                                                        7
Il 24 marzo 2022, FlixBus ha aderito alla Carta Nazionale dei On 24th March, 2022, FlixBus adheres to the
Giovani, l'iniziativa promossa dal Dipartimento del National Youth Charter, the initiative promoted by
Governo per le Politiche Giovanili e il Servizio Civile the Government Department for Youth Policies
and the Universal Civil Service to allow people
Universale per consentire alle persone residenti in Italia tra
residing in Italy between the ages of 18 and 35 to
i 18 e i 35 anni di usufruire di sconti su beni e servizi
take advantage of discounts on cultural goods and
culturali. Flixbus ha messo a disposizione di chi scarica la
services. Flixbus has made available to those who
card, un milione di codici sconto per viaggiare a bordo della download the card, one million discount codes to
compagnia. travel aboard.
Collegando la città di Torino con l'aeroporto di Malpensa (a Connecting the city of Turin with Malpensa airport
partire da venerdì 25 marzo 2022), debutta in Italia il (starting Friday 25 March, 2022), the Flibco shuttle
servizio navetta di Flibco, società specializzata nella mobilità service, a company specialized in airport mobility
aeroportuale e già attiva in Belgio, Lussemburgo e and already active in Belgium, Luxembourg and
Germania. Germany makes its debut in Italy.
TRASPOL – Politecnico di Milano ||| Checkmybus.it
83 UTENZA DELLE AUTOLINEE | C OACH USERS
Le ricerche su CheckMyBus.it The searches on CheckMyBus.it
I primi anni post liberalizzazione e post lancio del portale The initial years post liberalisation and the launch
Checkmybus.it hanno visto una crescita continua nelle of the CheckMyBus search portal had seen a
ricerche. La velocità della crescita è cambiata negli anni, con continuos increase in searches. The growth in rates
has been changing. The biggest acceleration has
i tassi maggiori nel 2019, con una crescita delle ricerche
been in 2019, marking a 70% increase in searches
rispetto al 2018 del 70%, spinta da un aumento del 32% delle
with respect to 2018, boosted by a 32% increase in
coppie origine-destinazione cercate.
O-D pairs.
Nel 2020 ci si sarebbe aspettata una ulteriore crescita, A similar growth would have been expected in 2020
effettivamente abbozzata nel mese di gennaio. Tuttavia, a but the initial onset of the COVID-19 pandemic
causa della preoccupazione legata alle prime fasi della towards the end of February, the total searches had
pandemia in Europa e ai primi casi registrati in Italia verso started decreasing. The second semester, despite
la fine di febbraio, le ricerche totali nel secondo mese erano the lower restrictions as compared to the first
già diminuite. Il secondo semestre, nonostante (when complete lockdowns had decimated all
l’allentamento del lockdown, mostrava comunque una travel), still showed a 75% decrease in the total
searches compared with the second semester of
diminuzione del 75% delle ricerche totali rispetto al secondo
2019.
semestre del 2019.
The number of OD pairs in 2021 was more or less
Nel 2021 il numero di relazioni ricercate è stato più o
the same as 2020, but the average requests per
meno simile, ma il numero di richieste è ricresciuto del route rose in 2021 by 70%.
70%. On a monthly basis, some differences rise. After the
Su base mensile si notano differenze tra i due anni. Dopo le relatively severe restrictions imposed from
restrizioni severe tra Febbraio e Aprile 2021 dovute alla February 2021 to April 2021 due to the onset of the
crescita in Italia e altrove della variante Delta, i movimenti Delta variant elsewhere and in Italy, movements
sono ripresi da maggio, con il calo di infezioni e were again permitted from May as the cases
ospedalizzazioni grazie ai vaccini. Dal mese di maggio le decreased due to containment and hospitilizations
reduced due to vaccination campaigns reduced.
richieste sono tornate a crescere e i mesi estivi di luglio e
From the month of May requests increase and
agosto hanno superato quelli del 2020, pur restando su
the Summer months of July and August are
livelli di circa la metà rispetto al 2019. Nel complesso, il
higher than 2020 but still less than half of what it
secondo semestre 2021 è tornato ai livelli del 2017. was in 2019. Overall, the 2 nd semester of 2021
returned to the levels of 2017.
TRASPOL – Politecnico di Milano ||| Checkmybus.it
9Variations in the amount of surveyed routes and quantity of requests with
respect to previous year
Interregional Italian bus routes
Source: elaborations on CheckMyBus data
Year Number of OD pairs Average requests per route
2017 +86% -22%
2018 +45% -19%
2019 +32% +21%
2020 -45% -42%
2021 -2% +70%
Variation in the quantity of searched tickets with
respect to the previous year
Source: elaborations on CheckMyBus data
Quantity of tickets
Year
searched
2017 33%
2018 34%
2019 69%
2020 -71%
2021 24%
TRASPOL – Politecnico di Milano ||| Checkmybus.it
10Il profilo dell’utenza Users’ profile
I precedenti anni di monitoraggio (2017-2019) hanno The past years (2017-2019) of monitoring have
sempre evidenziato una percentuale maggiore di utenti consistently revealed a higher percentage of
femminili (la media è del 55%). Nel 2020 si è osservata una female users (average being 55%). While, the year
proporzione simile tra uomini e donne e nel 2021 il 2020 saw an almost equal proportion of males and
contributo femminile è tornato ancora ad essere females, the contribution of females was again 5%
superiore (del 5%) rispetto agli uomini. more than the males in 2021.
Guardando le fasce di età, la fascia di utenti di 18-24 anni Looking at the age of travellers, the 18-24 yearsone
è l’unica che è tornata a crescere durante il COVID, dopo is the only age group which, after a decrease until
una decrescita fino al 2019. Tutti gli altri gruppi di età 2019, had an increasing trend during COVID,
hanno perso il 6%. while all other age groups have lost weightage
Possiamo interpretare questo fenomeno in due fasi. Prima
(6%).
del 2020 il mercato si è progressivamente aperto alle classi
We can interpret this phenomenon in two phases.
di età “intermedie” grazie a maggiore offerta e qualità
Before 2020 the market has progressively open to
rispetto al passato. Le categorie “storiche” di giovani e
“intermediate” age cohorts thanks to increased
anziani erano quindi calate in termini proporzionali.
supply and quality. The “historical” categories of
Durante la pandemia, lo smart working, le riunioni a
young and elders have consequently proportionally
distanza e sopratutto la paura del contagio hanno
progressivamente ridotto i viaggi della popolazione più decreased. During pandemic, smart working,
anziana, facendo ricrescere nuovamente la quota dei remote meetings and especially the fear of
giovani. infection has progressively reduced the trips of
the elder population, letting the share of the
young to increase again.
TRASPOL – Politecnico di Milano ||| Checkmybus.it
114 L’ANDAMENTO DEL MERCATO | MARKET DEVELOPMENT
Il mercato italiano per macroarea 2 Il mercato per macroarea 3
Prima della crisi pandemica, il mercato principale in termini Before COVID-19 crisis, the principal market in
di biglietti cercati è sempre stato il Sud, con le relazioni terms of searched tickets has been the South, with
macroregionali principali Nord-Sud e Sud-Sud. Nel 2020 i the leading macroregional relations being North-
South and South-South. In 2020, the South-South
collegamenti Sud-Sud hanno mantenuto popolarità in
connections maintained popularity in terms of
termini di quota, come mostrato in figura, mentre le
share, as shown in the figure, while the North-
relazioni Nord-Sud hanno evidentemente perso terreno.
South relation has evidently lost shares. In 2021,
Nel 2021, per la prima volta, la relazione principale è for the first time, the leading sub-market is the
diventata quella tra Nord e Nord, la cui quota è aumentata North – North relation, whose share increased of
di 8 punti percentuali e il numero di biglietti cercati di ben 8 points and the number of tickets searched of 91%.
il 91%. Le relazioni lunghe tra Nord e Sud hanno Longer relations like North – South show a
continuato la loro discesa di quota di mercato (5% continued decrease in market share (5% with
rispetto al 2020 e 8% rispetto al 2019), anche in valori respect to 2020 and 8% with respect to 2019) and
assoluti di biglietti cercati (25% rispetto al 2020 e 75% also in number of tickets searched (25% with
respect to 2020 and 75% with respect to 2019).
rispetto al 2019). Ancora una volta si può ipotizzare che la
This is again because of passengers' reluctance to
causa sia ricercabile nella riluttanza dei passeggeri a
travel long distances by bus due to the higher
percorrere lunghe distanze in autobus per via del maggior
perceived risk, or simply in the increase of “South
rischio percepito o semplicemente per l’aumento del “South working” and contraction of long-distance business
working” e riduzione della mobilità business di lungo trips.
raggio.
Nel 2021 tutte le relazioni interne alle macro-regioni hanno In 2021, all the relations internal to their macro
visto un aumento della quota di mercato mentre le altre sono regions has seen an increase in market share while
leggermente calate. Come numero assoluto di biglietti the others have only slightly decreased. In terms of
cercati, come già detto, le relazioni interne sono ora le the searched tickets, as mentioned above, internal
relations lead the way. Longer relations have
principali. Le relazioni più lunghe sono calate e le medie
reduced and the mid distance relations like the
distanze di Nord-Centro e Sud-Centro vedono una crescita
North – Center and South – Center observe an
del 20% rispetto al 2020.
average increase of 20% with respect to 2020.
2
E’ ragionevole ipotizzare che l’utenza che si rivolge a motori di ricerca come CheckMyBus non comprenda in linea di
massima i clienti fidelizzati dai singoli operatori, né i viaggiatori frequenti su una singola tratta che tendono a rivolgersi alla
soluzione di viaggio conosciuta; questo fattore potrebbe avere anche una componente temporale, man mano che l’utenza
viene acquisita e trattenuta dagli operatori.
3 It is reasonable to assume that user group who turns to search engines such as CheckMyBus does not in principle include
loyal customers from individual operators, nor frequent travelers on a single route who tend to use the known travel
solution; this factor could also have a temporal component, as users are acquired and retained by the operators.
TRASPOL – Politecnico di Milano ||| Checkmybus.it
12Macroarea routes’ share, 2021
Source: elaborations on CheckMyBus data
TRASPOL – Politecnico di Milano ||| Checkmybus.it
13Macroarea routes' share
Source: elaborations on CheckMyBus data
100%
80%
60%
40%
20%
0%
2017 - 01
2017 - 03
2017 - 05
2017 - 07
2017 - 09
2017 - 11
2018 - 01
2018 - 03
2018 - 05
2018 - 07
2018 - 09
2018 - 11
2019 - 01
2019 - 03
2019 - 05
2019 - 07
2019 - 09
2019 - 11
2020 - 01
2020 - 03
2020 - 05
2020 - 07
2020 - 09
2020 - 11
2021 - 01
2021 - 03
2021 - 05
2021 - 07
2021 - 09
2021 - 11
South - South North - North Center - Center Center - South North - South Center - North
Confronto mese su mese Month-over-month comparison
I primi mesi del 2021 sono stati bassi a causa dei lockdown The initial months of 2021 were quiet due to the
parziali e completi sul territorio nazionale. Si è tornati a partial/complete lockdowns over the national
vedere domanda solo da Aprile. territory and real demand is seen only after April.
The high ratios of April, May, November and
I rapporti dei mesi di aprile, maggio, novembre e dicembre
December 2021 when compared to the same
del 2021 rispetto al 2020 sono molto alti a causa delle forti
months of 2020 are because of the heavier
restrizioni dell’anno precedente più che a una vera crescita. restrictions in the previous year rather than a true
Mediamente, i mesi del 2021 sono 3.3 volte superiori ai growth. The average ratio of 2021/2020 months
corrispondenti del 2020, con tassi superiori solo nella is 3.3 and the only macro relation above the average
macro-relazione Nord – Nord seguita da Centro – Centro e is North – North followed closely by Center –
Sud – Sud, che ancora una volta indica che il 2021 è stato Center and South – South which clearly indicates
l’anno dei viaggi intra-area piuttosto che di lungo raggio. that the year 2021 was dominated by inter-
Rispetto al 2019, quando la mobilità era priva di macroregional trips rather than long or even
restrizioni, il confronto mese-su-mese crolla a 0.43. Il medium distance trips.
When this value is compared to the year 2019
modo con cui i diversi mercati hanno reagito è molto
(when mobility conditions were unrestricted),
diverso. I mercati di breve raggio hanno complessivamente
the average ratio for all months is 0.43.
tenuto meglio rispetto a quelli lunghi, dove la domanda
There is a better overall performance of short-haul
non ha ancor raggiunto il 30% di quello che era. Tuttavia markets, while for long distance relations demand
vi è stata una lenta ma promettente risposta (+24%) nel 2021 has not yet reached 30% of what it used to be in
rispetto al 2020. 2019. Nevertheless, there has been a slow and a
Oltre alla diversa performance complessiva, in alcuni promising response (+24%) in 2021 with respect to
sottomercati i segnali migliori si sono avuti tra aprile e 2020.
maggio (es. Centro-Centro e Centro-Sud) mentre in altri a In addition to the different overall performance,
fine anno (es. Nord-Nord e Sud-Sud). some relations have performed less worse in April
and May (e.g. Centre-Centre and Centre-South)
and other at the end of the year (North-North and
South-South).
TRASPOL – Politecnico di Milano ||| Checkmybus.it
14La lunghezza dei viaggi Travel length
La quota in termini di biglietti cercati per distanze inferiori The shares in terms of searched tickets for
a 600 km ha mostrato un aumento del 12.5% rispetto al interregional routes for distances less than 600 km
secondo semestre del 2019. I viaggi sulle distanze superiori saw a 12.5% increase, of which the largest
contribution was for 200-400 km (8%). Distances
a 600 km al contrario continuano a diminuire come
longer than 600 km continue to decrease as a
conseguenza della pandemia. I collegamenti a breve e
consequence of the ongoing pandemic. The
media distanza hanno sofferto relativamente meno, essendo
short 4 and medium distance connections suffer
preferiti per il minor rischio di contagio percepito dovuto al relatively less, being preferred for the perceived
ridotto tempo a bordo con altri passeggeri. lower risk of infection due to the reduced time
onboard with other passengers.
4 Connecting two different Regions anyway
TRASPOL – Politecnico di Milano ||| Checkmybus.it
15I collegamenti con gli aeroporti sono stati dominati dai Looking only at the connections with airports,
viaggi inferiori ai 400 km come negli anni precedenti. I they are dominated by trips below 400 km like the
collegamenti più brevi, tra 0-100 e 100-200 km sono previous years. The relatively short distances of 0-
100 km and 100 – 200 km has increased by 5% and
cresciuti dal 2020 del 5% e del 9% rispettivamente. Tra 200
9% with respect to 2020 respectively. 200 – 400 km
e 400km la crescita è stata del 9.5% sull’anno precedente.
range saw a further 9.5% decrease with respect to
Fino al 2019 le relazioni di lunga distanza stavano
2020.
guadagnando terreno, ma questo trend si è interrotto con la Until 2019, promising long distance relations were
pandemia. Ora le distanze sotto i 400km costituiscono il gaining share but this evolving trend has been
97% delle ricerche. Oltre i 400 km, inoltre, c’è stato un calo highly disturbed by the pandemic. Distances less
dell’8% sia tra 2019 e 2020 che tra 2020 e 2021. than 400 km constitute 97% of all searches. While
distances longer than 400 km had fallen by 8% in
2020 with respect to 2019 and further by 8% in 2021
with respect to 2020.
TRASPOL – Politecnico di Milano ||| Checkmybus.it
16Le principali rotte 5 e località Top routes 6 and places
Considerando le ricerche aggregate per regione, le prime 10 In terms of regional aggregation, the top 10
rotte richieste nel secondo semestre 2021 (escluse quelle che searched relations in the second semester of 2021,
interessano gli aeroporti) confermano l'importanza delle excluding the ones involving airports, confirm the
importance of relations between neighbouring
relazioni tra le regioni limitrofe e quelle più lunghe Nord-
regions and longer North-South ones, such as
Sud come Lombardia-Calabria ed Emilia Romagna-
Lombardia-Calabria.
Calabria. There are 4 relations internal to the North and three
Tra le 10 relazioni principali, 4 sono interne al Nord e 3 tra between the Centre and the South in the Top 10
Centro e Sud. La relazione Puglia-Campania ha mantenuto connections. Puglia-Campania relation holds its
la posizione rispetto allo scorso anno, complice l'assenza di position from last year owing to the absence of an
una rete ferroviaria efficace. Le tratte più ricercate sono tra effective rail network. The most searched routes are
Lazio-Calabria (6%) e Lazio-Abruzzo (6%), seguite da Lazio- Lazio-Calabria (6%) and Lazio-Abruzzo (6%)
Campania e Puglia-Campania con 5% ciascuna. Compaiono followed by Lazio-Campania and Puglia-Campania
le relazioni tra Lazio e Marche col 4%. Scompaiono tra le più at 5% each. Marche-Lazio relation makes it to the
Top 10 with 4% which did not exist before.
ricercate nel 2021 relazioni come Emilia Romagna-
Previously existing relations like Emilia Romagna-
Lombardia e Campania, Aosta-Lombardia e Puglia-Sicilia.
Lombardia, Emilia Romagna-Campania,
La forte presenza della Calabria nelle relazioni col Centro e
Lombardia - Aosta and Puglia-Sicilia do not show
Sud è l’effetto dell’abbondanza di origini/destinazioni nella up in the Top relations of 2021. The strong
regione, con rotte che collegano saldamente località anche presence of Calabria with the center and the south
molto piccole. is a testament to the abundance of
origins/destinations in the region with routes
robustly connecting even smaller villages and
Le rotte aeroportuali nel 2017-2019 si sono concentrate towns.
principalmente sui due principali sistemi aeroportuali, The airport routes in 2017-2019 mainly
concentrated on the two principal airport
Milano/Bergamo e Roma, ma un paio di relazioni con gli
systems, Milan/Bergamo and Rome but a couple
aeroporti di Bologna e Venezia hanno iniziato ad
of relations with Bologna and Venezia airports
emergere negli ultimi due anni.
have started to emerge in the last two years. The
La rotta Piemonte-Lombardia mantiene la massima quota relation Piemonte – Lombardia holds its place for
tra tutte le relazioni aeroportuali, cresciuta al 31% (dal 31% the maximum share, grown in 2021 to 42% (31% in
del 2020 e 21% del 2019). La pandemia ha imposto una 2020 and 21% in 2019). Pandemics has pushed
forte concentrazione attorno a poche relazioni principali: concentration around very few airport routes:
i primi 10 collegamenti rappresentano l'87% del totale the top 10 relations represent 87% (80% in 2020
880% nel 2020, 60% nel 2019). Relazioni molto lunghe and 60% in 2019) of all airport relations in Italy.
come Lombardia-Puglia, Calabria e Sicilia non sono più Long-distance relations like Lombardia-Puglia,
Lombardia-Calabria and Lombardia-Sicilia that
presenti. La relazione Puglia – Basilicata (cioè Matera –
previously existed are not present anymore. The
Aeroporto di Bari) è cresciuta al 12%, dal 4% del 2020 ed è
relation Puglia – Basilicata (that is Matera – Bari
ormai la seconda relazione nazionale. La relazione tra
airport), which had a share of 4% in 2020, holds
now the second place in 2021 with 12%. The
5
In questo e nei successivi paragrafi le rotte descritte si intendono in entrambe le direzioni.
6 In this and in the following paragraphs the described routes are intended in both directions.
TRASPOL – Politecnico di Milano ||| Checkmybus.it
17Trentino Alto Adige e Lombardia è riapparsa tra le relation of Trentino Alto Adige with Lombardia has
principali dopo il 2019. reappeared after 2019.
Per quanto riguarda le principali destinazioni Regarding main destinations for all routes in
2021, the top 2 (Rome and Naples) maintain their
aeroportuali nel 2021, le prime due (Roma e Napoli)
top spot while Torino takes the third spot of
restano in testa, mentre Torino supera Milano e Malpensa
Milan and Malpensa jumps 3 spots overtaking
cresce di tre posizioni superando Firenze e Bologna.
Bologna and Firenze. Interesting is that Matera
Matera è nelle prime 20 destinazioni, in crescita di 22 makes it to the Top 20 (22 spots ahead of what it
posizioni e anche Bari entra con 41 posizioni guadagnate. was in 2020) and even Bari airport climbing 41
spots to make it to the Top 20.
Regional OD share, 2021 II Semester
Source: elaborations on CheckMyBus data
TOP 20 Cities and Airports for searched tickets 10 Chieti 2
national routes 11 BGY 2
Source: elaborations on CheckMyBus data
12 FCO -2
Rank City/Airport Change 2021 vs 2020
13 Sala Consilina 12
1 Roma 0
San Benedetto del
2 Napoli 0 14 18
tronto
3 Torino 1 15 Lamezia Terme 2
4 Milano -1 16 Verona 8
5 MXP 3 17 Salerno -2
6 Bologna -1 18 Giulianova -4
7 Firenze -1 19 Cosenza 3
8 Matera 22 20 BRI 41
9 Bari 0
TRASPOL – Politecnico di Milano ||| Checkmybus.it
18Considerando le rotte internazionali, le prime 5 città Considering international routes, the top 5
italiane hanno lievemente modificato il loro ordine Italian cities have slightly changed their
relativo, con Roma che mantiene la prima posizione. Il respective positions, with Rome maintaining its
top spot. The secondary airport of Rome (CIA –
secondo aeroporto romano guadagna 11 e Fiumicino
Ciampino) has gained 11 places while principal
raggiunge il settimo. Città turistiche importanti come Siena
airport FCO – Fiumicino gained a spot and is in the
e Rimini guadagnano 10 posizioni ciascuna.
7th place.
TOP 20 Cities and Airports for searched tickets 10 Bari 2
international routes 11 Genova -2
Source: elaborations on CheckMyBus data
12 Rimini 10
Rank City/Airport Change 2021 vs 2020
13 Caserta 2
1 Roma 0
14 Foggia 20
2 Napoli 1
15 Siena 10
3 Milano -1
16 BGY -3
4 Torino 0
17 Venezia -3
5 CIA 11
18 Cosenza 18
6 Bologna -1
19 Roccaraso 62
7 FCO 1
20 Salerno 3
8 Firenze -2
9 Verona -2
TRASPOL – Politecnico di Milano ||| Checkmybus.it
195 INDICE DEI PREZZI | P RICE INDEX
Indice dei prezzi Price index
L’indice dei prezzi è realizzato calcolando il prezzo medio The price index represents the average weighted
pesato per km su tutte le ricerche effettuate nel periodo price per km of all searches for the period 2017-
2021 performed on the CheckMyBus.it platform
2017-2021 sulla piattaforma CheckMyBus.it per i
for bus connections between different regions.
collegamenti in autobus fra regioni diverse.
The first year of the pandemic had changed the
Il primo anno della pandemia ha cambiato
price dynamics completely due to low
completamente la dinamica dei prezzi a causa del basso demand/capacity, stopping the stabilisation
rapporto domanda/capacità, interrompendo la fase di phase of prices observed until 2019.
stabilizzazione dei prezzi osservata fino al 2019. 2021 was more steady than 2020. Comparing with
Il 2021 è stato invece più stabile del 2020. I prezzi nei primi 2020, when the total absence of demand has left
mesi sono stati superiori del 45% rispetto al 2020, quando companies without levers, the prices for the first
l’assenza totale di domanda aveva lasciato le aziende del few months were around 45% higher. The price
tutto prive di leve di prezzo. I prezzi sono aumentati increased only slightly in April when the
restrictions were relatively eased during the Easter
leggermente ad aprile con l’alleggerimento delle restrizioni a
holidays. From May onwards the price index
Pasqua. Da maggio in poi l’indice dei prezzi ha seguito un
followed a similar trend (less steeper than 2020)
trend poco inferiore al 2020, fino al picco di agosto. Il
until peaking in August. The second semester with
secondo semestre, quasi del tutto privo di restrizioni e almost no restrictions and a steep demand, saw the
domanda crescente, ha visto prezzi inferiori del 10% rispetto price index 10% lower than the second semester of
a quelli del 2020. 2020.
Vale la pena di sottolineare che i prezzi sono cresciuti in It is worth remembering that prices increased
maniera significativa, ma meno della riduzione di significantly, but less than the reduction of
capacità imposta dai decreti sul distanziamento. Le capacity imposed by social distancing. This
imprese dunque sono sotto stress dal punto di vista del means that companies are under severe stress
despite the reduction of production.
breakeven nonostante la riduzione delle percorrenze.
Average weighted prices
excluding origin and
destination in airports
Source: elaborations on
CheckMyBus data
Jan – July –
[€/km]
June Dec.
2017 0,060 0,065
2018 0,058 0,058
2019 0,055 0,060
2020 0.062 0.093
2021 0.077 0.084
TRASPOL – Politecnico di Milano ||| Checkmybus.it
20Price variation against the previous semester Price variation against the same semester
excluding origin and destination in airports of previous year
Source: elaborations on CheckMyBus data excluding origin and destination in airports
January – June July - December Source: elaborations on CheckMyBus data
January – June July - December
2018 -11% +0,9%
2019 -6,4% 9,4% 2018 -4,1% -10,2%
2019 -5,6% 2,3%
2020 3,1% 50%
2020 1,8% 54,7%
2021 -16,6% 9%
2021 25,3% -9,1%
I prezzi delle rotte aeroportuali Airport routes’ prices
Solo i viaggi con origine e/o destinazione negli aeroporti Only journeys with origin and/or destination in
sono considerati nel calcolo del prezzo medio ponderato per airports are considered in calculating the average
le rotte aeroportuali. Queste hanno prezzi per km weighted price for airport routes. These have
generally higher prices per km and minimal
generalmente più alti e quasi nessuna variazione stagionale
seasonal variability with respect to other
rispetto alle normali rotte interregionali e quindi sono
interregional routes. For this reason they are given
trattate separatamente.
differential treatment.
I prezzi medi per km per le rotte aeroportuali sono stati The average prices per km for airport routes were
di circa il 50% superiori rispetto alle rotte normali. about 50% higher than the regular routes. The
L'indice dei prezzi ha visto un aumento del 32% nel primo price index saw a 32% increase in the first
semestre del 2021 rispetto allo stesso semestre del 2020 e del semester of 2021 relative to the same semester in
50% rispetto al 2019. Nel secondo semestre sia i trend che i 2020, with an overall increase of 50% with respect
prezzi si comportano analogamente, ma con meno to the year 2019. The second semester trends as
variabilità (stagionale/temporale). well as price index show resemblance with less
variability (seasonal/temporal).
TRASPOL – Politecnico di Milano ||| Checkmybus.it
21Average weighted prices
with origin or destination in
airports only
Source: elaborations on
CheckMyBus data
Jan. – July –
[€/km]
June Dec.
2017 0,140 0,116
2018 0,096 0,080
2019 0,082 0,084
2020 0,086 0,120
2021 0,113 0,124
Price variation against the previous semester Price variation against the same semester of
with origin or destination in airports only previous year
Source: elaborations on CheckMyBus data with origin or destination in airports only
January – June July - December Source: elaborations on CheckMyBus data
2018 -16,9% -16,8% January – June July - December
2019 2% 2,7% 2018 -31,4% -30,8%
2019 -15,1% 4,8%
2020 2,3% 39,4%
2020 5,1% 42,6%
2021 -5,6% 9,7%
2021 32,1% 3,6%
L’effetto della lunghezza del viaggio The influence of route length
La lunghezza del viaggio è un fattore determinante del The length of the trip is one of the main drivers
prezzo medio per km. Le distanze più brevi, inferiori a 200 of the average price per km. Shorter distances less
km, costano proporzionalmente molto più delle distanze than 200 km proportionally cost much more than
longer distances. The price index has a typical
maggiori. L'indice dei prezzi ha infatti una tendenza
decreasing trend with the increase in travel
decrescente con l'aumento della distanza da percorrere.
distance. The 2021 and the 2020 curve follows the
Le curve del 2021 e del 2020 seguono per lo più la tendenza
usual trend for both the interregional routes and
abituale, l'unico cambiamento è l'aumento complessivo the airport routes, the only change being the overall
dell'indice dei prezzi per tutte le fasce di distanza rispetto al increase in the price index for all distance ranges as
2019. Una leggera crescita si osserva nel 2021 oltre i 600 km. compared to 2019. A slight increase is observed for
La crescita maggiore rispetto al 2019 si osserva per distances longer than 600 km in 2021 but nothing
distanze inferiori ai 100 km (25% per le rotte as such of large magnitude. Major growth vs. 2019
interregionali e +80% per le aeroportuali) e per la fascia is observed for shorter distances than 100 km
TRASPOL – Politecnico di Milano ||| Checkmybus.it
22100 – 200 km (+10% interregionali e +30% aeroportuali). (+25% for interregional routes and +80% for
Per le rotte interregionali, la pendenza di decrescita nelle airport routes) and for 100 – 200 km (+10% for
brevi distanze è molto maggiore che negli anni precedenti. interregional routes and +30% for airport
routes). For interregional routes, the fall in price
Inoltre, è interessante notare come l’indice di prezzo oltre i
with shorter distances is much steeper than in the
400km converga per le rotte interregionali e quelle
previous years. However, its interesting that the
aeroportuali.
price index for longer distances than 400 km, the
interregional and the airport routes converge.
TRASPOL – Politecnico di Milano ||| Checkmybus.it
23Andamento per direttrice Differences between routes
Analizzando nel dettaglio i percorsi per macroaree si Analyzing the macro-areas routes in detail, we
evidenziano diversi andamenti dei prezzi che possono highlight different price trends that may differ
differire anche in modo significativo dal valore medio. significantly from the average value.
Internal routes in the three macro areas are those
I percorsi interni alle tre macro aree sono mediamente
with the shortest average distances and therefore
quelli con le distanze più brevi e quindi presentano un
present a higher price/km. North-Center and
prezzo / km più elevato. Le rotte Nord-Centro e Sud-Centro
South-Center routes can be considered in the same
possono essere considerate come parte della medesima classe distance group and in fact they show a similar trend
di distanza e infatti mostrano un andamento simile nei tre over the years of monitoring. North-South routes
anni di monitoraggio. Le rotte nord-sud rientrano nella classe fall in the longer distance class and show the lowest
delle distanze maggiori e mostrano il prezzo medio per km average price per km.
più basso.
TRASPOL – Politecnico di Milano ||| Checkmybus.it
24Average weighted length per macroarea route
Source: elaborations on CheckMyBus data
Route Average km
North - North 188
Center - Center 183
South - South 280
Center - North 458
Center - South 551
North - South 982
Gli andamenti dei prezzi per le rotte non-aeroportuali si The price trends for the routes excluding airports
sono completamente invertiti con la pandemia. have reversed since the pandemic. Considering
Considerando gli ultimi tre semestri dopo il lockdown, i the last three semesters after full lockdown,
prices in Summer 2020 have been the highest in
prezzi nell’estate 2020 sono stati i più alti, in tutte le
all macro-regions. In 2021 prices went down
macroregioni. Nel 2021 i prezzi sono scesi in maniera
differently across Italy, but nowhere lower than
differenziata nel paese, ma in nessun caso sono scesi sotto
2019. Summer prices of 2021 are always
il 2019. I prezzi estivi del 2021 sono stati molto più bassi del significantly lower than in 2020 except for Centre-
2020, tranne che nelle relazioni Centro-Centro, che hanno Centre presenting a very steady trend.
un trend piuttosto stabile. Concerning airport routes, the price per km
Per le tratte aeroportuali l'incremento medio del prezzo al average increase of 20% with respect to 2020
km del 20% rispetto al 2020 nasconde importanti hides important regional differences, ranging
differenze regionali, tra il +60% delle relazioni Centro- from Center-North relation showing a 60%
Nord e il -15% delle relazioni Nord-Sud. increase and North - South’s a 15% decrease.
TRASPOL – Politecnico di Milano ||| Checkmybus.it
25The price of the Top 10 routes
Il prezzo delle 10 rotte principali The prices per km for the 10 most important
I prezzi al km per le 10 rotte nazionali più importanti national routes (distinct between airport routes
(distinte tra le rotte aeroportuali e non) mostrano and not) demonstrates interesting observations.
particolari interessanti. Longer distance routes like Milano-Napoli and
Tratte lunghe come la Milano-Roma e la Milano-Napoli Milano – Roma that had held popularity from
hanno mantenuto popolarità dal 2017-2019, hanno 2017-2019 has evidently lost shares. Since 2020,
with pandemic affecting travel choices and
evidentemente perso quote di mercato. Dal 2020 gli effetti
behavior, the top routes are generally those with
della pandemia sulle scelte di viaggio hanno portato le
neighbouring regions. There are five routes
rotte principali ad essere quelle tra regioni confinanti. Ci
from the relation Center-South, three from the
sono cinque rotte nella relazione Centro-Sud, tre Sud- South-South and the remaining two internal to
Sud e le rimanenti due interne al Nord. the North macro-region.
Delle 10 principali coppie di origini e destinazioni, cinque The top 10 routes include 5 relations involving
di esse coinvolgono Roma e tre Napoli. Questi Roma and 3 relations with Napoli. These routes
collegamenti sono diretti alle regioni limitrofe are with the neighbouring regions of Abruzzo and
dell'Abruzzo e della Puglia, su un portafoglio di Puglia, with a panel similar to 2020. The prices on
destinazioni simile al 2020. Il prezzo al km per questi most of these routes have seen a 10-20% hike in
prices. Milano – Torino price rose by 30%
percorsi ha visto un’impennata del 10-20%. I prezzi della
compared to 2020. The historic bus route Napoli
Milano-Torino sono cresciuti del 30% rispetto al 2020. La
- Bari where the train connection is lacking has
relazione “storica” Napoli-Bari, priva di treno, è riapparsa
reappeared with price 0.064 €/km compared to
con un prezzo di 0.064 €/km rispetto ai 0.037 €/km del 0.037 €/km in 2019 (+73%).
2019 (+73%). The total quantity of tickets searched for the
La quantità di biglietti cercati per le prime 10 rotte è top 10 routes has increased by 30% and the
ricresciuta del 30% e il prezzo medio/km per queste average price/km for these routes has seen a
rotte ha avuto un modesto calo del 10%. modest decrease of 10%.
TRASPOL – Politecnico di Milano ||| Checkmybus.it
26Tra le prime 10 rotte aeroportuali, cinque sono in comune Among the top 10 airport routes, 5 routes are
tra 2020 e 2021: Torino – MXP, FCO – Chieti, Matera – common between 2020 and 2021. These relations
BRI, Torino – BGY, Firenze – BLQ, San benedetto del are Torino – MXP, FCO – Chieti, Matera – Bari
Airport (BRI), Torino – BGY, Firenze – BLQ
Tronto – FCO. Tra queste, Matera BRI e Torino – BGY
(Bologna airport) and San benedetto del Tronto –
sono cresciute del 50% in prezzo, mentre le altre sono
FCO. Out of these Matera – BRI, and Torino –
rimaste simili. Venezia – BGY ha il prezzo al km più basso
BGY saw a 50% increase in prices while for the
(0.062 €/km). La relazione col prezzo più alto (0.22€/km) others the prices were more or less the same.
è la Calenzano – BLQ. Le relazioni con l’aeroporto di Venezia – Bergamo relation has the lowest
Fiumicino costano generalmente il 10% in meno rispetto price/km (0.062€/km). The relation with the
a quelle con gli aeroporto di Bergamo, Malpensa e maximum price 0.22€/km is Calenzano – BLQ
Bologna. La quantità totale di biglietti ricercati nelle 10 (Bologna Airport). The relations with Fiumicino
principali rotte aeroportuali è più che triplicata airports cost generally lower by 10% as compared
rispetto al 2020 e il prezzo è sceso del 10%. to the relations Bergamo, Malpensa and Bologna
airports. The total quantity tickets searched for
the top 10 airport routes has increased almost
3 fold as compared to 2020 and the price has
fallen by 10%.
Prices per km of top 10 routes, 2021 II Semester
Source: elaborations on CheckMyBus data
L’influenza delle principali compagnie The contribution of main companies
Un altro fattore che influenza il prezzo è la dimensione Another determinant of the price is the size of the
della compagnia che gestisce il collegamento. Negli ultimi company that operates the route. During the last
tre anni prima del 2020 si è osservato che i primi 5 operatori three years before 2020, it was observed that the top
5 operators maintained a lower-than-average unit
per numero di biglietti ricercati mantenevano un prezzo
TRASPOL – Politecnico di Milano ||| Checkmybus.it
27unitario inferiore alla media. Questa considerazione resta price. This evaluation holds considering the
valida considerando sia le classi di distanza che i differenti variation with distance as well as progressive
mesi dell’anno. months.
During the 2nd semester of 2020 this trend has
Nel secondo semestre del 2020 questa situazione si è
reversed. With the return of the passengers during
invertita. Con il ritorno dei passeggeri in estate, le
Summer, larger companies were more able than
compagnie più grandi sono state più in grado delle piccole
smaller ones to extract more revenues.
di estrarre ricavi. In May 2021, we progressively returned to the
Dal maggio 2021 siamo progressivamente tornati alla pre-pandemic situation: the Top5 companies
situazione pre-pandemica: le compagnie Top5 hanno un have a lower than average unit price as compared
prezzo medio inferiore rispetto alle altre compagnie. to the Other companies.
Più in dettaglio, da maggio le compagnie maggiori hanno More precisely, since May, larger companies have
avuto un prezzo del 6% inferiore alla media, mentre le altre an average price of 6% lower than the average of the
del 16% superiore. La riduzione maggiore delle Top5 si è entire sample while the Other companies have 16%
higher. The maximum fall for the Top5 companies
osservata a settembre, con il 10% in meno, mentre l’aumento
was observed in the month of September at 10%
maggiore è a ottobre e giugno, pari al 28% e 26%
while the maximum rise for the Other companies
rispettivamente. A dicembre non vi sono praticamente
was in the same month at 28% followed by in June
differenze tra i due gruppi. at 26%. In December we observe almost no
Effettuando il medesimo confronto sulla base delle difference among the groups.
distanze, si osserva che l’abbassamento maggiore delle When these prices are compared on a distance
Top5 (-14% rispetto alla media) e l’aumento maggiore basis, it is observed that the greatest fall for the
delle altre (+44%) è nella prima fascia di distanza da 0 – Top5 companies (-14% vs. the average) and the
100 km. Nel 2020 si è osservato il fenomeno opposto. Al greatest increase for the Other companies (44%)
contrario, la variazione è minima nella fascia con più is in the shortest range of 0-100km while this
trend in 2020 was reversed. This variation of
domanda (100-400 km) ma anche per le distanze più lunghe.
prices is minimum for the routes with most
demand (100-400km) but also for extremely long
distances too.
TRASPOL – Politecnico di Milano ||| Checkmybus.it
28Puoi anche leggere