RAPPORTO SUL MERCATO DELLE AUTOLINEE A LUNGA PERCORRENZA IN ITALIA | ANNO 2020 ITALIAN LONG-DISTANCE COACH TRANSPORT MARKET
←
→
Trascrizione del contenuto della pagina
Se il tuo browser non visualizza correttamente la pagina, ti preghiamo di leggere il contenuto della pagina quaggiù

TRASPOL report 2/21
RAPPORTO SUL MERCATO DELLE AUTOLINEE A LUNGA
PERCORRENZA IN ITALIA | ANNO 2020
ITALIAN LONG-DISTANCE COACH TRANSPORT MARKET
REPORT | YEAR 2020

                                                     In collaboration with:
                TRASPOL – Politecnico di Milano ||| Checkmybus.it
                                                                              1
IL MERCATO DELLE AUTOLINEE A LUNGA PERCORRENZA IN ITALIA (Italian long-distance coach
transport market report)
Anno 2020 / Year 2020

Autori: Paolo Beria, Samuel Tolentino, Vardhman Lunkar

Il presente rapporto viene pubblicato periodicamente in collaborazione con Checkmybus.it, sulla base
dei dati raccolti sulla piattaforma.
The report is published in collaboration with Checkmybus.it based on the data available on Checkmybus.it website.

Please quote as follows:
 Beria P., Tolentino S., Vardhman L. (2021). Rapporto sul Mercato delle Autolinee a Lunga Percorrenza
 in Italia | Anno 2020. TRASPOL Report 2/21 & Checkmybus. Milano, Italy.

Photo by Annie Spratt on Unsplash

TRASPOL – Laboratorio di Politica dei Trasporti
Dipartimento di Architettura e Studi Urbani, Politecnico di Milano
Via Bonardi 3, 20133, Milano, Italy.
http://www.traspol.polimi.it

                             TRASPOL – Politecnico di Milano ||| Checkmybus.it
                                                                                                                    2
SOMMARIO

1   Introduzione | Introduction............................................................................................................................................... 4
2   Sinossi | Overview ................................................................................................................................................................. 6
3   Utenza delle autolinee | Coach users ............................................................................................................................. 9
4   L’andamento del mercato | Market development ................................................................................................. 12
5   Indice dei prezzi | Price index ........................................................................................................................................ 21
6   Metodologia | Methodology ............................................................................................................................................ 31
7   Conclusioni | Final remarks ............................................................................................................................................ 34

                                          TRASPOL – Politecnico di Milano ||| Checkmybus.it
                                                                                                                                                                                       3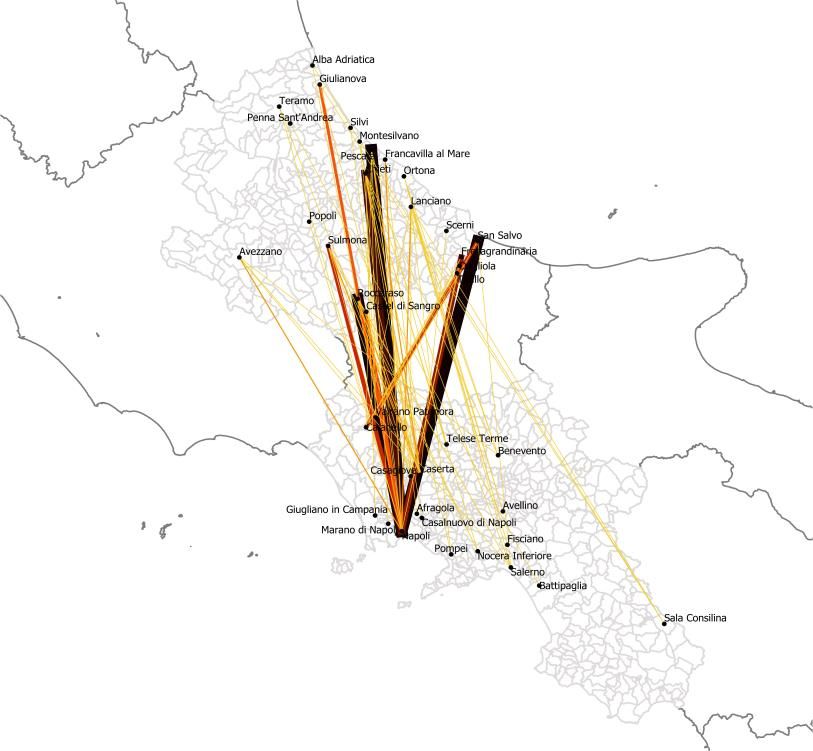
1 INTRODUZIONE | INTRODUCTION

Questo rapporto, preparato in collaborazione con              This report has been prepared in collaboration
Checkmybus.it, è la ottava edizione della serie di studi      with Checkmybus.it. It is the eighth edition of
sull’andamento del mercato degli autobus di lunga             the detailed study on the long-distance coach
                                                              market in Italy. The current research deals with
percorrenza in Italia. Il rapporto è dedicato al
                                                              market trends spanning 2017-2020, focusing on
monitoraggio dell’evoluzione del settore tra gli anni 2017
                                                              price trends. Such extensive research aims to be
e 2020 con un particolare focus sui prezzi.
                                                              a valuable tool to monitor the coach market
Questa serie di studi vuole costituire uno strumento utile    evolution over the years, addressed both at coach
per monitorare l'evoluzione del mercato del trasporto         companies and the public regulator. While we are
passeggeri a lunga distanza su gomma nel corso degli          all aware of how “out of the ordinary” the year
anni, indirizzato sia alle compagnie di autotrasporto che     2020 was, this report also highlights how the
ai regolatori pubblici.                                       COVID-19 outbreak has impacted long-
Poiché il 2020 è indubbiamente stato un anno “fuori           distance bus transport in Italy.
dall'ordinario”, questo rapporto mira anche a
                                                              This edition adopts the same structure and
evidenziare come l'epidemia di COVID-19 abbia
                                                              methodology as the 7th edition. Results and
avuto un impatto sul trasporto su autobus a lunga
                                                              comparisons for the airport connections have
distanza in Italia.
                                                              been dealt with separately, given their different
                                                              behaviour.
Questa edizione segue la stessa struttura e metodologia
della precedente. I collegamenti aeroportuali sono stati      The report is freely available at www.
analizzati separatamente poiché si sono evoluti come un       traspol.polimi.it and www.checkmybus.it. It is
sotto-mercato specifico con comportamenti diversi.            based on a sample of data collected by the
                                                              Checkmybus.it platform from January 2017 to
Il rapporto è liberamente scaricabile da www.                 December 2020.
checkmybus.it e da http://www.traspol.polimi.it ed è
                                                              All methodological specifications are given in the
basato sul campione di dati raccolti dalla piattaforma di
                                                              last section.
vendita Checkmybus.it da gennaio 2017 a dicembre 2020.

Tutte le specifiche metodologiche sono raccolte nell’ultimo
capitolo.

                           TRASPOL – Politecnico di Milano ||| Checkmybus.it
                                                                                                            4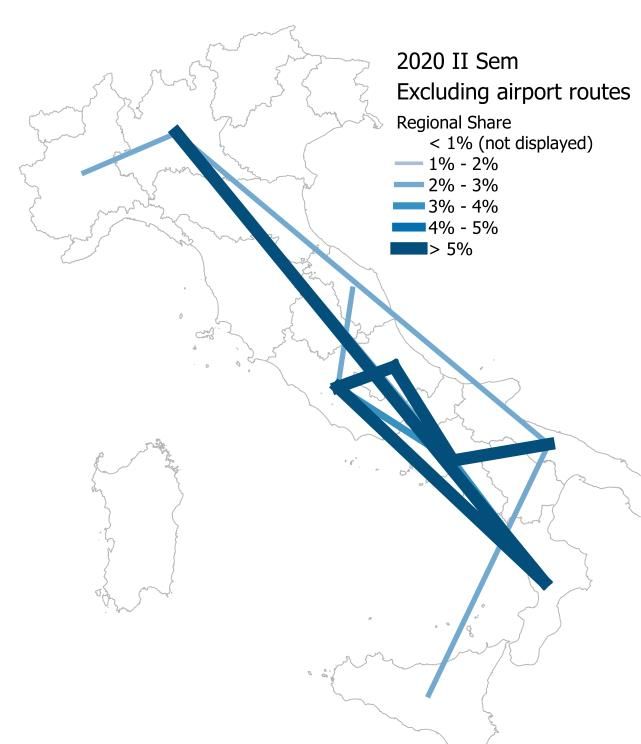
Approfondimenti / Further material

    ▪ 2013. STUDIO SUL SERVIZIO AUTOBUS DI LUNGA PERCORRENZA IN ITALIA
Beria P., Grimaldi R., Laurino A. (2013). Long distance coach transport in Italy. State of the art and perspectives.

    ▪ 2014. IL TRASPORTO PASSEGGERI SU AUTOBUS PER LE LUNGHE DISTANZE.
Beria, P. et al. (2014). Spatial and scenario analyses of long-distance coach transport in Italy

    ▪ 2015. AUTOLINEE STATALI: GLI EFFETTI DELLA RIFORMA.
Beria P., Laurino A., Bertolin A., Grimaldi R. (2015). Long distance coach services: the effects of the reform. Results,
opportunities and critical aspects following the opening of the market.

    ▪ 2016-2019. RAPPORTO SUL MERCATO DELLE AUTOLINEE A LUNGA PERCORRENZA IN ITALIA
Beria P., Laurino A. (2016). Italian Long-Distance Coach Transport Market. Report Ist semester 2016.
Beria P., Nistri D., Laurino A. (2017). Italian Long-Distance Coach Transport Market. Report full year 2016.
Beria P., Nistri D. (2017). Italian Long-Distance Coach Transport Market. Report Ist semester 2017.
Beria P., Nistri D. (2018). Italian Long-Distance Coach Transport Market. Report full year 2017.
Beria P., Tolentino S. (2018). Italian Long-Distance Coach Transport Market. Summary Ist semester 2018.
Beria P., Tolentino S. (2019). Italian Long-Distance Coach Transport Market. Report full year 2018.
Beria P., Tolentino S., Vardhman L. (2019). Italian Long-Distance Coach Transport Market. Report full year 2019.

    ▪ 2017. INTERCITY COACH LIBERALISATION. THE CASES OF GERMANY AND ITALY
Grimaldi R., Augustin K., Beria P. (2017). Intercity coach liberalisation. The cases of Germany and Italy.
Transportation Research Procedia, 25, 474-490.

    ▪ 2018. INTERCITY COACH LIBERALISATION IN ITALY: FARES DETERMINANTS
Beria P., Nistri D., Laurino A. (2018). Intercity coach liberalization in Italy: Fares determinants in an evolving market,
Research in Transportation Economics, 69, 260-269.

    ▪ 2018. ATLANTE DEI TRASPORTI ITALIANI
Atlante dei trasporti italiani. Infrastrutture, offerta, domanda. Beria P. (a cura di). Libreria Geografica, 2018.

    ▪ 2019. EVOLVING LONG-DISTANCE PASSENGER SERVICES IN ITALY
Beria P., Bertolin A. (2019). Evolving long-distance passenger services. Market concentration, fares and
specialisation patterns in Italy. Research in Transportation Economics, 74, 77-92.

    ▪ 2019. IL TRASPORTO INTERURBANO CON AUTOBUS. FOCUS SULLA SICUREZZA
Beria P., Tolentino S. (2019). IL TRASPORTO INTERURBANO CON AUTOBUS. Analisi del mercato delle autolinee a
lunga percorrenza dalla liberalizzazione ad oggi e focus sulla sicurezza rispetto agli incidenti stradali. Report
preparato per Autobusweb.

    ▪ 2019. AUTOLINEE A LUNGA PERCORRENZA IN ITALIA DA PRIMA DELLA LIBERALIZZAZIONE A OGGI
Bertolin A., Tolentino S. (2019). Le autolinee di media e lunga percorrenza in Italia: evoluzione del settore da prima
della liberalizzazione ad oggi. Rivista di Economia e Politica dei Trasporti, n. 1, art. 2.

                              TRASPOL – Politecnico di Milano ||| Checkmybus.it
                                                                                                                        5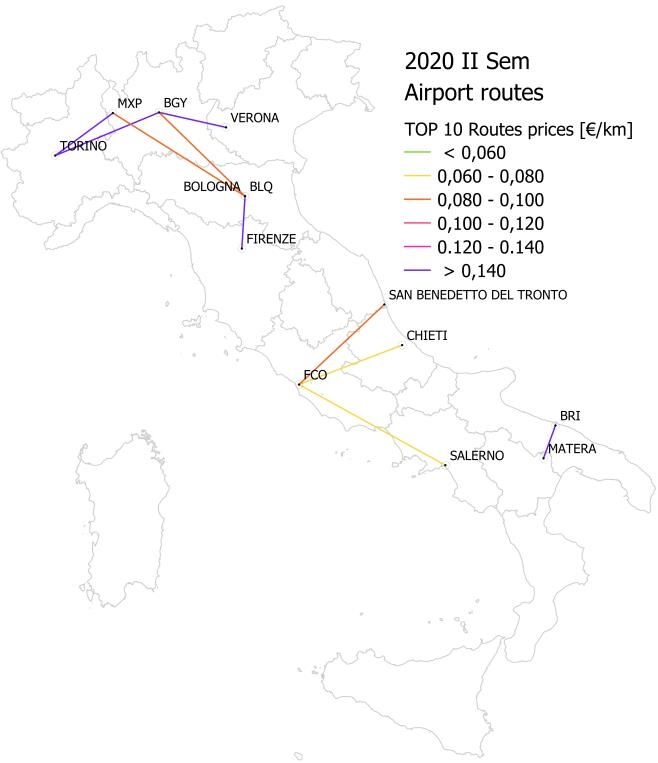
2 SINOSSI | OVERVIEW

Il quadro complessivo: quattro anni di                               The overall picture: four years of
monitoraggio                                                         monitoring
                                                                     After the complete deployment of liberalization
Come è ormai noto1, l’apertura nel 2014 del mercato
                                                                     in 2014, the operators introduced new routes
della lunga percorrenza su gomma si è rapidamente
                                                                     and increased frequency. Thus, the market
tradotta in nuove relazioni servite e/o nell’aumento                 uplifted in terms of demand, supply and
delle frequenze settimanali, nella proposta di nuovi                 geographical coverage. Liberalization has also
modelli di offerta (intercity, notturno tra grandi città,            ramped up competition in terms of active
etc.) ed in un marcato utilizzo di tariffe differenziate,            operators. New intercity connections with
soprattutto sulle tratte in competizione con la ferrovia.            greater frequencies were offered mainly in
Già dopo pochi mesi, il settore ha subito un importante              competition with the railway services.
cambiamento, con l’acquisto da parte di FlixBus di tutte             (intercity, night-time between large cities,
                                                                     seasonal routes etc.).
le attività europee di Megabus, compreso il mercato
                                                                     After a few months, the market had already
italiano.
                                                                     undergone a substantial change, with FlixBus
Altri movimenti di rilievo nel mercato si sono avuti
                                                                     acquiring all Megabus' European activities,
all'inizio del 2017, quando FSI ha acquisito il 51% di               including the Italian market.
SIMET, per offrire servizi di autobus a lunga percorrenza            At the beginning of 2017, FSI acquired 51% of
con il marchio Busitalia. Tuttavia, dopo meno di due anni            SIMET to offer long-distance bus services under
di crescita, è avvenuta l'uscita dell'operatore ferroviario          the Busitalia brand. However, after less than two
a seguito di una revisione del piano industriale, dunque             years of growth, the railway operator exited
il marchio ritorna sotto il pieno controllo di SIMET.                following a revision of the industrial plan;
Parallelamente, FlixBus ha continuato a rafforzare la                therefore, the brand returned under complete
                                                                     control of SIMET.
propria posizione nei mercati del Nord e del Centro, con
                                                                     Increasing partnerships with local operators in
nuove rotte e partnership con imprese locali.
                                                                     the North and the Center, FlixBus continued to
Successivamente, è ripresa la penetrazione nel mercato
                                                                     strengthen its presence in the Italian market by
maggiormente presidiato dagli operatori storici, ovvero              adding new connections in Sicily and Calabria.
il Sud, con l’istituzione di collegamenti con la Calabria da         The merging in later 2018 of Baltour, a company
settembre 2018 e con la Sicilia da novembre 2018.                    with 50 years of experience in Italy, with FlixBus
Penultimo tassello della strategia di consolidamento di              and its technological innovation led to an
FlixBus è l’accordo di partnership raggiunto con Baltour,            increase of domestic and international routes
grazie al quale da metà novembre 2018 tutte le tratte                across all of Italy. In October 2019, Marozzi, one
nazionali ed internazionali del Gruppo Baltour sono                  of the first companies to invest in road
                                                                     passenger transport, passed the coverage of
acquistabili anche tramite i suoi canali di vendita ed è
                                                                     interregional lines to FlixBus. Frequency also
stato dato un ulteriore impulso all’espandersi del
                                                                     increased in this case, especially on high
network. Nell'ottobre 2019, Marozzi, che è stata una
                                                                     demand routes like Bari-Roma, Bari-Naples,
delle prime aziende a investire nel trasporto di                     Lecce-Florence and Taranto-Florence, and the
passeggeri su strada, ha ceduto le linee interregionali a            possibility of carrying the bicycle has been
FlixBus. Anche in questo caso la frequenza è aumentata,              introduced on many connections.
in particolare sulle rotte più richieste come Bari-Roma,             In 2019 the new brand BlaBlaBus started
Bari-Napoli, Lecce-Firenze e Taranto-Firenze e la                    operations. It is the outcome of the acquisition
possibilità di trasportare la bicicletta al seguito è stata          by BlaBlacar of the formerly SNCF-owned bus
introdotta su molti collegamenti.                                    company Ouibus. Initially operating on the
                                                                     French market, the newcomer has already
Nel 2019 è diventata via via operativa BlaBlaBus, nuovo
                                                                     partnerships with legacy carriers in Italy and
marchio di BlaBlaCar nato dall’acquisto da SNCF di
                                                                     Europe, establishing a multimodal transport

1Beria et al. (2015), Autolinee statali: gli effetti della riforma. Risultati, opportunità e criticità dell’apertura del
mercato. Report preparato per ANAV
                              TRASPOL – Politecnico di Milano ||| Checkmybus.it
                                                                                                                      6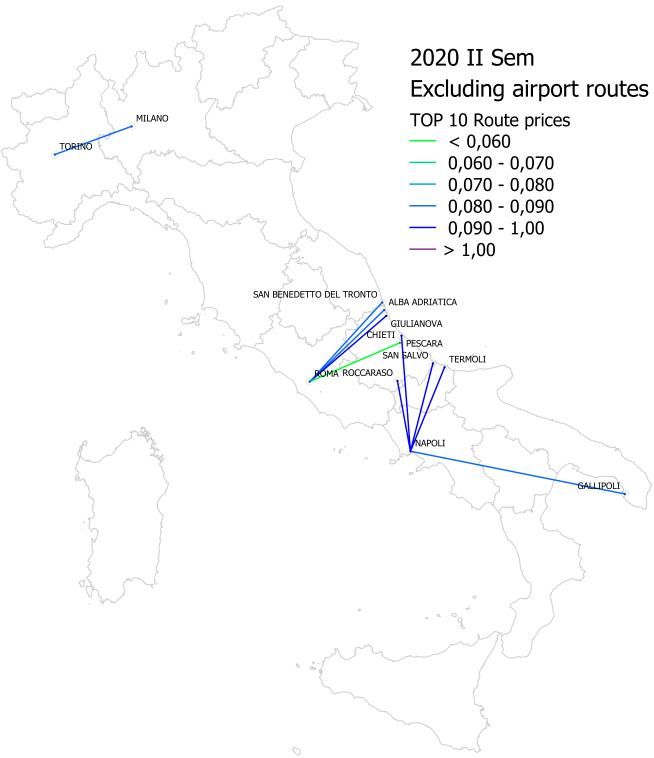
Ouibus. Inizialmente sul mercato francese, il nuovo            network that offers carpooling and buses on a
entrante ha però già stretto partnership con vettori           single platform.
legacy in Italia ed Europa per creare una rete di              From January 2020, Sais Autolinee (a historical
                                                               operator offering interregional and regional bus
trasporto multimodale che offre carsharing e autobus su
                                                               services) has started offering daily night and day
un'unica piattaforma.
                                                               services to passengers on the Sicily-Calabria-
Da gennaio 2020, Sais Autolinee (un operatore storico
                                                               Puglia route.
che offre servizi di autobus regionali e interregionali) ha    In February 2020, it was announced that a new
iniziato a offrire servizi diurni e notturni giornalieri ai    Italian company, Itabus, would have been
passeggeri sulla rotta Sicilia-Calabria-Puglia.                operational by the summer, with a fleet of 300
Nel febbraio 2020, è stato annunciato che una nuova            bus. However, due to the unprecedented health
società italiana, Itabus, sarebbe stata operativa entro        crisis of the outbreak of COIVD-19, the
l’estate con una flotta di 300 autobus (a regime).             expansion plans remain unfulfilled.
Tuttavia, l’insorgere della crisi sanitaria ha interrotto il
piano di ingresso sul mercato.                                 According to autobusweb.com, the tourist
                                                               volume using the coach in 2020 has
                                                               retracted to those of 30 years ago. They
Secondo autobusweb.com, il volume di turisti che
                                                               claimed that an alarming figure of reduction of
utilizzano l'autobus nel 2020 si è ridotto a quelli di
                                                               the demand had been observed (-65%). This can
30 anni fa, ovvero una riduzione della domanda del             be validated by the analysis performed further
65%. L’analisi presentata in questo rapporto corrobora         in this report. It is pretty evident that the main
questa informazione.                                           downfall has been due to the lockdown, but it
È evidente che la principale caduta sia stata dovuta al        cannot be denied seeing the ripple effect of the
lockdown imposto da marzo ad inizio giugno 2020,               pandemic on the travel behaviour and modal
seguito dall'effetto della pandemia sui comportamenti di       choices of the passengers in the remaining part
viaggio e sulle scelte modali dei passeggeri nella restante    of the year. The rental sector was at a complete
                                                               standstill and this inactivity puts the long-
parte dell'anno. Il settore del noleggio è stato
                                                               distance industry in jeopardy and impedes
completamente arrestato dalla pandemia e questa
                                                               expansion of providing services. While the
inattività ha messo in pericolo l'industria del trasporto
                                                               Italian coach market was expected to close on a
passeggeri di lunga distanza e impedisce l'espansione          record in 2020, it sets a record but unfortunately
della fornitura di servizi. Mentre ci si aspettava che il      in the opposite sense. It closed at 2100 units
mercato italiano degli autobus avrebbe chiuso con un           sold with respect to 3200 in 2019.
record il 2020, il record è sfortunatamente stato nel          Unfortunately, with intermittent lockdowns and
senso opposto: solo 2100 unità vendute rispetto alle           different restrictions for different regions, 2021
3200 del 2019. Purtroppo, con blocchi intermittenti e          does not seem to be a promising year, with
restrizioni diverse per le varie regioni, il 2021 non          long-distance journeys significantly reduced
                                                               (though not wholly absent) and the entire sector
sembra essere un anno promettente, con viaggi di
                                                               consequently in crisis.
lunga percorrenza notevolmente ridotti (anche se
non del tutto assenti) e tutta la filiera conseguentemente
                                                               Regarding price trends, the year 2020 has seen
in sofferenza.                                                 a rise in the prices with respect to 2019,
                                                               contrary to the ongoing lowering trend. The
Per quanto riguarda l'andamento dei prezzi, l'anno 2020        pandemic changed the dynamics entirely
ha visto un rialzo dei prezzi rispetto al 2019, in             owing to the altered travel behaviour
controtendenza al trend ribassista in atto. La pandemia        triggering less demand (number of OD pairs
ha cambiato completamente le dinamiche a causa                 reduced by 45%) and consequently higher
dell’impatto sulle scelte di viaggio che ha innescato          prices. A more than 50% rise in the price
                                                               index was observed for the second semester
una minore domanda (numero di coppie OD ridotto del
                                                               of 2020 relative to the second semester of
45%) e di conseguenza prezzi più elevati. È stato
                                                               2019. The same happened for airport routes,
osservato un aumento di oltre il 50% dell'indice dei
                                                               that in 2020, the prices increased by more
prezzi per il secondo semestre del 2020 rispetto al            than 40% for the second semester following
secondo semestre del 2019. Lo stesso per le rotte
                           TRASPOL – Politecnico di Milano ||| Checkmybus.it
                                                                                                               7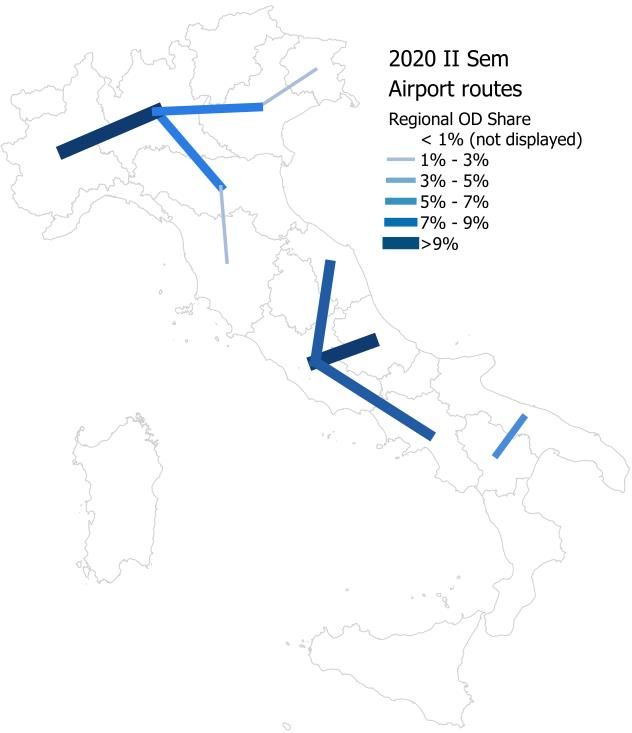
aeroportuali, che avevano registrato un calo                 a significant fall in the price index from 2017
dell'indice dei prezzi dal 2017 al 2019, cresciuti poi       to 2019.
nel 2020 di oltre il 40% per il secondo semestre.            Clearly, price increases are due to the tentative
                                                             of the firms to limit the effects of the fall of
E’ chiaro che questi aumenti sono dovuti al tentativo
                                                             demand reducing promotional prices, but also
delle aziende di limitare i danni del crollo della domanda
                                                             to cope with the limits to the load factors.
eliminando le tariffe promozionali, ma anche del limite
ai posti vendibili per garantire il distanziamento.

                           TRASPOL – Politecnico di Milano ||| Checkmybus.it
                                                                                                            8
3 UTENZA DELLE AUTOLINEE | COACH USERS

Le ricerche su CheckMyBus.it                                   The searches on CheckMyBus.it
Dopo una forte crescita del numero di ricerche nei primi       The very initial years post the launch of the
due anni dal lancio del motore di ricerca Checkmybus.it,       CheckmyBus search portal between 2014-2016
il 2017 è stato un anno abbastanza costante, ad                had seen a tremendous increase in the number
                                                               of total searches. While 2017 was a reasonably
eccezione dei mesi estivi e delle festività natalizie. Nel
                                                               constant year, 2018 had observed an
secondo semestre del 2018 vi è stata un’accelerazione
                                                               accelerated growth from the second semester
nelle prenotazioni, che è continuata nel 2019 con una
                                                               onwards. This growth evolved in 2019, marking
crescita delle ricerche rispetto al 2018 del 70%, spinta       a 70% increase in searches with respect to 2018,
da un aumento del 32% delle coppie origine-                    boosted by a 32% increase in O-D pairs.
destinazione cercate.                                          A similar growth would have been expected in
Nel 2020 ci si sarebbe aspettata una ulteriore crescita,       2020, confirmed by the encouraging data of
abbozzata nel mese di gennaio. Tuttavia, a causa della         January. However, due to the scare and the
preoccupazione legata alle prime fasi della pandemia in        initial onset of the COVID-19 pandemic towards
Europa e ai primi casi registrati in Italia verso la fine di   the end of February, the total searches had fallen
                                                               already in the second month. Most of the first
febbraio, le ricerche totali nel secondo mese erano già
                                                               semester is heavily biased due to the travel
diminuite. La maggior parte del primo semestre è
                                                               restriction policies like lockdown introduced by
praticamente       azzerata dalle      restrizioni sugli
                                                               the government, which nearly anihilated travels.
spostamenti introdotte dal governo. Il secondo                 The second semester, despite the lower
semestre, nonostante l’allentamento del lockdown,              restrictions, still shows a 75% decrease in
mostra comunque una diminuzione del 75% delle                  the total searches compared with the second
ricerche totali rispetto al secondo semestre del               semester of 2019. The number of O-D pairs
2019. Il numero delle coppie OD ricercate ha mostrato          searched showed a fall of 45%.
un calo del 45%.                                               July and August were the months of minimum
Luglio e agosto sono stati mesi con restrizioni minime         restrictions to move within the country: this is
                                                               evident with higher index values, which anyway
agli spostamenti nel paese e questo si riflette nel
                                                               remains around the one of January. With respect
maggior numero di ricerche, che rimangono però
                                                               to the previous years, these values are below
intorno al livello di gennaio 2020: questi valori sono al di
                                                               what they were in 2017 and about 1/3 of the
sotto di quello che erano nel 2017 e il circa 1/3 degli        same months in 2019, which clearly indicates
stessi mesi nel 2019, il che indica chiaramente la crisi       the crisis brought about by the pandemic.
provocata dalla pandemia. Le restrizioni sono poi state        Restrictions were re-introduced from October
reintrodotte da ottobre in poi raggiungendo                    onwards and at peak during December, and the
nuovamente il blocco totale nel mese di dicembre, come         drastic decreasing trend validates it.
la drastica tendenza al ribasso conferma.

                           TRASPOL – Politecnico di Milano ||| Checkmybus.it
                                                                                                               9
Variations in the amount of surveyed routes and quantity of requests
with respect to previous year
Interregional Italian bus routes
Source: elaborations on CheckMyBus data
Year Number of OD pairs Average requests per route
2017 +86% -22%
2018 +45% -19%
2019 +32% +21%
2020 -45% -42%
TRASPOL – Politecnico di Milano ||| Checkmybus.it
10Il profilo dell’utenza Users’ profile
I precedenti anni di monitoraggio (2017-2019) hanno The past years (2017-2019) of monitoring have
sempre evidenziato una percentuale maggiore di utenti consistently revealed a higher percentage of
femminili (la media è del 55%). Tuttavia, l'anno 2020 ha female users (average being 55%). However,
visto una proporzione quasi uguale di uomini e donne. the year 2020 saw an almost equal proportion of
Guardando le fasce di età, negli ultimi 3 anni è stata males and females.
osservata una riduzione consistente della fascia di Looking at age range, a consistent drop in the
utenti di 18-24 anni; tuttavia, questa fascia di età è users' range of 18-24 years was observed for the
aumentata del 6% nel 2020. last three years; however, this age group has
La quota della fascia di età 35-44 anni è diminuita gained 6% shares only in 2020 relative to 2019,
del 3% rispetto al 2019, contrariamente al trend in The share of the age group 35-44 years old
aumento negli ultimi anni di monitoraggio: può darsi che has decreased by 3% relative to 2019, which
lo smart working e soprattutto le riunioni a distanza is contrary to its increasing trend in the past
abbiano ridotto i viaggi che probabilmente sarebbero
years of monitoring. It could be plausible that
stati scelti prima da questa fascia di età.
smart working, and especially remote meetings,
La quota di viaggiatori sopra i 44 anni che era stata
has reduced the trips that would be probably
relativamente stabile negli ultimi anni è diminuita
chosen before by this age group. The quota of
del 5% nel 2020. Ciò potrebbe essere dovuto alla
minore disposizione delle persone più anziane a travellers above the age of 44 that had been
viaggiare in autobus, percepito come un possibile luogo relatively stable in the past years fell by 5% in
a rischio di contagio. 2020: this may be due to older people less
willing to travel by bus, perceived as a risk to
their health because of the proximity with other
people.
TRASPOL – Politecnico di Milano ||| Checkmybus.it
114 L’ANDAMENTO DEL MERCATO | MARKET DEVELOPMENT
Il mercato dei viaggiatori occasionali2 Occasional users’ market3
Nelle figure seguente possiamo vedere come il mercato, In the figure, we can see how the market in a
che si trovava in uno stato di robusta crescita nel 2019, state of healthy growth in 2019 took the plunge
sia precipitato nel 2020 a causa della crisi sanitaria in 2020 due to the unprecedented health crisis
relating to the pandemic of COVID-19. For all the
relativa alla pandemia di COVID-19. Per tutti gli anni
previous years, the principal market in terms of
precedenti, il mercato principale in termini di biglietti
searched tickets has always been the South, with
cercati è sempre stato il Sud, con le relazioni principali
the leading relations being North-South and
Nord-Sud e Sud-Sud. Nel 2020 i collegamenti Sud-Sud South-South. In 2020, the South-South
hanno mantenuto popolarità in termini di quota, come connections maintained popularity in terms
mostrato in figura, mentre le relazioni Nord-Sud / Sud- of share, as shown in the figure, while the
Nord hanno evidentemente perso terreno. Si può North-South / South-North relation has
ipotizzare che la causa sia ricercabile nella riluttanza dei evidently lost shares. This is highly probable
passeggeri a percorrere lunghe distanze in autobus per because of passengers' reluctance to travel long
via del maggior rischio percepito di contrarre l'infezione distances by bus due to the social distancing
rules and the higher risk of contracting the
o semplicemente nella riduzione della mobilità di
infection or simply in the contraction of the
lunghissimo raggio. Osserviamo dunque relazioni più
longer-range mobility. And therefore, we
brevi tra Centro e Nord che vedono una percentuale
observe shorter relations lie Centre-North /
relativamente maggiore della domanda. North-Centre seeing relatively more percentage
A parte il fatto che il sistema di rete degli autobus è molto of demand. Apart from the fact that the bus
articolato nel Sud, un altro motivo per la predominanza network system is highly elaborate in the South,
delle relazioni Sud-Sud è che una volta allentate le another particular reason for the dominant
restrizioni sugli spostamenti, i cittadini del Sud hanno South-South relation is once there was the ease
ripreso a muoversi prima rispetto a quelli del Nord, più of the restrictions, it is safe to say that people
gravemente colpito dalla crisi sanitaria almeno nella fase living in the South started moving earlier
comparing to the reluctance of the more
della primavera 2020.
severely affected Northern regions.
2 E’ ragionevole ipotizzare che l’utenza che si rivolge a motori di ricerca come CheckMyBus non comprenda in linea
di massima i clienti fidelizzati dai singoli operatori, né i viaggiatori frequenti su una singola tratta che tendono a
rivolgersi alla soluzione di viaggio conosciuta; questo fattore potrebbe avere anche una componente temporale,
man mano che l’utenza viene acquisita e trattenuta dagli operatori.
3 It is reasonable to assume that user group who turns to search engines such as CheckMyBus does not in principle
include loyal customers from individual operators, nor frequent travelers on a single route who tend to use the
known travel solution; this factor could also have a temporal component, as users are acquired and retained by the
operators.
TRASPOL – Politecnico di Milano ||| Checkmybus.it
12Macroarea routes’ share, 2020
Source: elaborations on CheckMyBus data
La macro relazione che ha visto la caduta più The macro relation that has seen the most
significativa è la relazione Nord-Nord. Questo potrebbe significant fall is the North-North relation as
essere il risultato del maggiore impatto della pandemia, shown in the figure above. This could result
from the pandemic's greater coverage and
che ha maggiormente condizionato il desiderio e la
impact in the north, leaving people more
possibiliutà di di viaggiare delle persone.
reluctant to travel.
TRASPOL – Politecnico di Milano ||| Checkmybus.it
13Macroarea routes' share
Source: elaborations on CheckMyBus data
100%
80%
60%
40%
20%
0%
2018 - 05
2019 - 08
2020 - 07
2017 - 01
2017 - 02
2017 - 03
2017 - 04
2017 - 05
2017 - 06
2017 - 07
2017 - 08
2017 - 09
2017 - 10
2017 - 11
2017 - 12
2018 - 01
2018 - 02
2018 - 03
2018 - 04
2018 - 06
2018 - 07
2018 - 08
2018 - 09
2018 - 10
2018 - 11
2018 - 12
2019 - 01
2019 - 02
2019 - 03
2019 - 04
2019 - 05
2019 - 06
2019 - 07
2019 - 09
2019 - 10
2019 - 11
2019 - 12
2020 - 01
2020 - 02
2020 - 03
2020 - 04
2020 - 05
2020 - 06
2020 - 08
2020 - 09
2020 - 10
2020 - 11
2020 - 12
South - South North - North Center - Center Center - South North - South Center - North
Confronto mese su mese Month-over-month comparison
A gennaio le relazioni Centro-Nord e Centro-Centro In January, the Centre-North and Centre-Centre
hanno mostrato l'incremento percentuale più elevato relations showed the highest percentage
rispetto allo stesso mese del 2019. Le ricerche medie increase with respect to January 2019. The
monthly average searches post January followed
mensili post gennaio hanno seguito un andamento
a similar trend for all macro connections. On
simile per tutti le macro-relazioni, precipitando in media
average, the monthly searches have plummeted
di 2/3 per tutte le aree. I mesi più significativi che hanno
by about 2/3 for all the macro areas. The most
portato a questa media così bassa sono quelli di significant months bringing this average so low
lockdown (marzo, aprile e maggio) in cui nessun viaggio are the months of lockdown (March, April and
era consentito sul territorio se non per scopi essenziali. May) when no physical travel was allowed on
La relazione Centro-Centro ha mostrato la diminuzione the territory except for essential purposes. The
media più bassa del 40%: ciò è spiegato dall'elevato Centre-Centre relation shows the lowest
numero di ricerche nei mesi di giugno, luglio e agosto, average decrease of 40%: this is explained by
quando le restrizioni erano allentate ma l’uso del the high number of searches during June, July
and August when there was an ease of
trasporto collettivo ancora soffriva del timore sanitario
restrictions but the travel was much more inter-
(e dunque le distanze percorse si sono mantenute
macroregional rather than longer distances.
generalmente contenute, favorendo le relazioni fra la
Therefore, most of the monthly searches or
Capitale e la costa Adriatica). traffic volumes are observed during
In definitiva, la maggior parte delle ricerche mensili summer, when people headed out to shorter
o dei volumi di traffico sono stati osservati durante to medium distances to spend their
l'estate, quando le persone si sono dirette verso vacations.
località a distanze più brevi o medie per trascorrere
le vacanze.
TRASPOL – Politecnico di Milano ||| Checkmybus.it
14La lunghezza dei viaggi Travel length
La quota in termini di biglietti cercati per distanze The share in terms of searched tickets for
inferiori a 400 km ha mostrato un aumento del 15% distances less than 400 km showed a 15%
rispetto al secondo semestre del 2019, mentre i viaggi increase, while trips longer than 600 km on the
converse suffered the same magnitude of
più lunghi di 600 km al contrario hanno subito una
decrease comparing with the second semester
diminuzione della stessa entità. A causa della pandemia,
of 2019. Due to the pandemic, the promising
il mercato in continua evoluzione del trasporto
and evolving long-distance market has taken a
passeggeri di lunga percorrenza ha subito un enorme huge plunge, especially for the longer distances.
contraccolpo, soprattutto per le distanze maggiori. I The short4 and medium distance connections
collegamenti a breve e media distanza hanno sofferto suffered relatively less, being preferred for the
relativamente meno, essendo preferiti per il minor perceived lower risk of infection due to the
reduced time onboard with other passengers.
4 Connecting two different Regions anyway
TRASPOL – Politecnico di Milano ||| Checkmybus.it
15rischio di contagio percepito dovuto al ridotto tempo a
bordo con altri passeggeri.
I collegamenti con gli aeroporti sono stati dominati Looking only at the connections with
dai viaggi compresi tra i 100-400 km come negli anni airports, they are dominated by trips
precedenti. Negli ultimi anni si è verificato un between 100-400 km like the previous years.
In the last years, a progressive lengthening of
progressivo allungamento dei viaggi verso gli aeroporti,
trips towards airports had taken place, bringing
portando la quota di tratte inferiori ai 400 km dal 64%
the share of routes shorter than 400 km from
nel 2017 al 43% nel 2019 e con una crescente popolarità
64% in 2017 to 43% in 2019 and the rising
per distanze superiori ai 1000 km. popularity for distances greater than 1000 km.
L’inizio della pandemia nel 2020 ha cambiato But the onset of the pandemic in 2020 has
completamente le abitudini di viaggio e le preferenze in changed completely the travel behaviour and
termini di distanze. E’ possibile che, per le distanze più preferences in terms of distances. It is possible
lunghe, la lunga durata dei viaggi in autobus rispetto agli that on longer distances, the coach’s journey
altri modi abbia giocato a sfavore. Inoltre, sono duration has disadvantaged it with respect to
probabilmente scomparsi (tranne nei mesi estivi), competing modes. Moreover, most of long-
distance personal trips have disappeared,
buona parte dei viaggi per motivi personali su distanze
excluding Summer months.
lunghe.
The airport routes saw a slight decrease in the
Le rotte aeroportuali hanno visto una lieve diminuzione
100-200 km category but a rise in the 200-400
nella categoria 100-200 km ma un aumento in quella km one. The absolute decline of travels over
200-400 km. È evidente il contingente declino delle distances longer than 400 km is evident.
distanze maggiori di 400 km.
TRASPOL – Politecnico di Milano ||| Checkmybus.it
16Le principali rotte5 e località Top routes6 and places
Considerando le ricerche aggregate per regione, le prime In terms of regional aggregation, the top 10
10 rotte richieste nel secondo semestre 2020 (escluse searched routes in the second semester of
quelle che interessano gli aeroporti) hanno evidenziato 2020, excluding the ones involving airports,
show the importance of relations between
l'importanza delle relazioni tra le regioni limitrofe e
neighbouring regions and longer North-
quelle più lunghe Nord-Sud come Lombardia-Calabria ed
South ones like Lombardia-Calabria and Emilia
Emilia Romagna-Calabria.
Romagna-Calabria.
Sono tre le direttrici interne al Sud e tre fra il Centro e il There are three relations internal to the South
Sud nella Top 10 dei collegamenti. Puglia-Campania ha and three between the Centre and the South in
mantenuto la posizione rispetto allo scorso anno, the Top 10 connections. Puglia-Campania holds
complice l'assenza di una rete ferroviaria efficace. Le its position from last year owing to the absence
tratte più ricercate sono tra Lazio e Abruzzo (11%) e of an effective rail network. The most searched
Campania e Abruzzo (6%). Ciò è evidente anche nella routes are between Lazio and Abruzzo (11.60%)
mappa delle prime 10 rotte (vedasi il paragrafo sui and Campania and Abruzzo (6.06%). This is also
evident in the Top 10 routes map (see the
prezzi delle rotte), che mostra otto relazioni tra città
paragraph about routes’ prices), which shows
appartenenti alle regioni di cui sopra. Queste coppie
eight city relations between the above regions.
hanno sostituito le più distanti come Milano-Catania e
These routes have substituted the longer routes
Palermo-Bologna dello scorso anno. like Milan-Catania and Palermo-Bologna from
La Calabria è presente in 4 relazioni nella Top 10 last year.
delle relazioni fra regioni con Lombardia (5.28%), Calabria is present in 4 relations in the Top 10
Lazio (5.69%), Campania (3.38%) ed Emilia Romagna connections between regions with Lombardia
(3.37%). Ciò indica la robusta connettività tra il Nord e il (5.28%), Lazio (5.69%), Campania (3.38%) and
Centro Italia con la Calabria. Emilia Romagna (3.37%). This indicates the
robust connectivity between Northern and
Central Italy with Calabria.
The airport routes mainly concentrate on the
two principal airport systems,
Milan/Bergamo and Rome. Like 2019, the
5 In questo e nei successivi paragrafi le rotte descritte si intendono in entrambe le direzioni.
6 In this and in the following paragraphs the described routes are intended in both directions.
TRASPOL – Politecnico di Milano ||| Checkmybus.it
17Le rotte aeroportuali si sono concentrate relation Piemonte-Lombardia contributes the
principalmente sui due principali sistemi maximum share of 31% (previously 21%)
aeroportuali, Milano/Bergamo e Roma. Come nel among all the relations. The top 10 relations
represent 80% of all airport relations in
2019, la rotta Piemonte-Lombardia ha contribuito per la
Italy. Long-distance relations like Lombardia-
massima quota, il 31% (precedentemente 21%) tra tutte
Puglia, Lombardia-Calabria and Lombardia-
le relazioni aeroportuali. I primi 10 collegamenti
Sicilia that previously existed are not present
rappresentano l'80% del totale. Le relazioni a lunga anymore. The next three relations are Lazio-
distanza come Lombardia-Puglia, Lombardia-Calabria e Abruzzo (11%), Lazio-Campania (9%) and
Lombardia-Sicilia che prima esistevano, non sono più Lazio-Marche (9%). Puglia-Basilicata weights
presenti. Le successive tre relazioni sono Lazio-Abruzzo more than 4% since people visiting Matera (the
(11%), Lazio-Campania (9%) e Lazio-Marche (9%). Il capital of Basilicata) use Bari’s airport as transit
collegamento Puglia-Basilicata contribuisce per oltre il to the destination. Other relations, as we can see,
4% poiché le persone che visitano Matera (il capoluogo are with closest neighbours. One stark
difference is that while the relations with Lazio
della Basilicata) utilizzano l'aeroporto di Bari come
have gained shares with respect to 2019,
transito verso la destinazione. Altre relazioni, come
relations with Lombardy have lost shares in
possiamo vedere, sono anch’esse con le regioni
2020. This is due to the aforementioned reason
adiacenti. Una novità riguarda il peso delle relazioni about the North being affected more by the
aeroportuali con il Lazio, che hanno guadagnato quote pandemic; thus, the travel behaviour has
rispetto al 2019, a discapito di quelle con la Lombardia. changed more significantly for those relations
Ciò è probabilmente dovuto al già mezionato motivo per than the relations in the South.
cui il Nord è stato maggiormente colpito dalla pandemia;
quindi, il comportamento di viaggio è cambiato in modo
più significativo per quelle relazioni rispetto alle Regarding main destinations in 2020, the top
5 (Rome, Milan, Naples, Torino and Bologna)
relazioni nel Sud.
maintain their top spots. While Florence
gained one position, Catania and Bari have lost
Per quanto riguarda le principali destinazioni nel
one each. The next part of the ranking sees more
2020, le prime 5 (Roma, Milano, Napoli, Torino e variation, with some airport gaining interest
Bologna) hanno mantenuto i primi posti. Mentre (MXP, FCO) and some smaller cities rocketing to
Firenze ha guadagnato una posizione, Catania e Bari ne be included in the top 15 (Chieti, Giulianova) at
hanno persa una ciascuna. La parte successiva della the expenses of bigger ones (Palermo and
classifica vede una maggiore variazione, con alcuni Taranto) that have been kicked out of the list.
aeroporti che guadagnano interesse (MXP, FCO) e alcune
città più piccole con un’esplosione di richieste che le
porta ad essere incluse nella Top 15 (Chieti, Giulianova)
alle spese di altre più grandi (Palermo e Taranto che
sono state espulse dalla lista).
TRASPOL – Politecnico di Milano ||| Checkmybus.it
18Regional OD share, 2020 II Semester
Source: elaborations on CheckMyBus data
TOP 15 Cities and Airports for searched tickets 7 Catania -1
national routes
Source: elaborations on CheckMyBus data 8 MXP 7
Change 2020 vs 9 Bari -1
Rank City/Airport
2019
10 FCO 19
1 Roma 0
11 Villa San Giovanni 0
2 Milano 0
12 Chieti 34
3 Napoli 0
13 BGY 0
4 Torino 0
14 Salerno -4
5 Bologna 0
15 Giulianova 36
6 Firenze 1
Considerando le rotte internazionali, le prime 5 città Considering international routes, the top 5
italiane hanno lievemente modificato il loro ordine Italian cities have slightly changed their
relativo, con Roma che ha conquistato la prima respective position, with Rome getting for the
first time on top and northern cities losing some
posizione e diverse città del nord che hanno ceduto
places (except Verona). However, the lack of
terreno (eccetto Verona). Tuttavia, la mancanza di viaggi
international travel has rendered these rankings
internazionali ha reso queste classifiche straordinarie e
extraordinary, and we will have to wait to see
dovremo aspettare per vedere come si evolverà il settore how this evolves in the following years.
negli anni successivi.
TRASPOL – Politecnico di Milano ||| Checkmybus.it
19TOP 15 Cities and Airports for searched tickets 7 Verona 2
international routes
Source: elaborations on CheckMyBus data 8 FCO 10
Change 2020 vs 9 Genova -2
Rank City/Airport
2019
10 Bari 1
1 Roma 1
11 Trieste -3
2 Milano -1
12 San Severo 5
3 Napoli 2
13 Venezia 0
4 Torino -1
14 BGY -4
5 Bologna -1
15 Caserta 1
6 Firenze 0
TRASPOL – Politecnico di Milano ||| Checkmybus.it
205 INDICE DEI PREZZI | PRICE INDEX
Indice dei prezzi Price index
L’indice dei prezzi è realizzato calcolando il prezzo The price index represents the average
medio pesato per km su tutte le ricerche effettuate weighted price per km of all searches for the
period 2017-2020 performed on the
sulla piattaforma CheckMyBus.it per i collegamenti in
CheckMyBus.it platform for bus connections
autobus fra regioni diverse.
between different regions.
Mentre negli ultimi anni si è assistito ad una
While the past years have seen a lowering
tendenza al ribasso dell'indice dei prezzi che trend of price index that seemed to stabilize,
sembrava stabilizzarsi, la pandemia ha interamente the pandemic changed the dynamics entirely
cambiato le dinamiche per via di una minore owing to the altered travel behaviour
domanda e della minore capacità dei mezzi per il triggering less demand together with less
distanziamento, e di conseguenza prezzi più alti. capacity due to distancing, and consequently
L'indice dei prezzi era già leggermente maggiore a higher prices.
gennaio (in una situazione ancora normale) rispetto The price index was a little higher in January
when things were normal, but the genuine hike
all’anno precedente, ma il vero aumento dei prezzi si è
in prices is observed once travelling had
osservato una volta che i viaggi sono ripresi dopo il lungo
resumed after the long lockdown until the
lockdown all'inizio di giugno, quando i viaggi
beginning of June: onwards, inter-regional
interregionali sono stati consentiti e la domanda è travel was permitted, and the demand had
ripresa. I prezzi hanno raggiunto il picco in agosto, increased. The prices peaked in August when
mentre nei mesi successivi sono subentrate una serie di the demand peaked. Thereafter, there were a
restrizioni che hanno nuovamente ridotto i viaggi. series of restrictions that considerably
Considerando solo il secondo semestre, l'indice dei diminished travel again. Considering only the
prezzi è cresciuto di oltre il 50% rispetto al secondo second semester, the price index rose by more
semestre del 2019 (ma non raddoppiato, nonostante than 50% with respect to the second
semester of 2019 (but not doubled, despite
il dimezzamento della capacità).
the halving of capacity).
Average weighted prices
excluding origin and
destination in airports
Source: elaborations on
CheckMyBus data
Jan – July –
[€/km]
June Dec.
2017 0,060 0,065
2018 0,058 0,058
2019 0,055 0,060
2020 0.062 0.093
TRASPOL – Politecnico di Milano ||| Checkmybus.it
21Price variation against the previous Price variation against the same semester
semester of previous year
excluding origin and destination in airports excluding origin and destination in airports
Source: elaborations on CheckMyBus data Source: elaborations on CheckMyBus data
January – June July - December January – June July - December
2018 -11% +0,9% 2018 -4,1% -10,2%
2019 -6,4% 9,4% 2019 -5,6% 2,3%
2020 3,1% 50% 2020 1,8% 54,7%
I prezzi delle rotte aeroportuali Airport routes’ prices
Solo i viaggi con origine e/o destinazione negli aeroporti Only journeys with origin and/or destination in
sono considerati nel calcolo del prezzo medio ponderato airports are considered in calculating the
per le rotte aeroportuali. Queste hanno prezzi per km average weighted price for airport routes. These
have generally higher prices per km and
generalmente più alti e quasi nessuna variazione
minimal seasonal variabilirt with respect to
stagionale rispetto alle normali rotte interregionali e
other interregional routes. For this reason they
quindi sono trattate separatamente.
are treated separately.
I prezzi medi per km per le rotte aeroportuali sono The average prices per km for airport routes
stati di circa il 30% superiori rispetto alle rotte were about 30% higher than the regular
normali per l'anno 2019. L'indice dei prezzi ha visto routes for the year 2020. The price index saw
un aumento del 43% nel secondo semestre del 2020 a 43% increase in the second semester of
rispetto allo stesso semestre del 2019, seguendo un 2020 relative to the same semester in 2019,
andamento simile alle rotte regolari nel primo semestre. following a similar trend to the regular routes in
I prezzi hanno raggiunto il picco in agosto, ma l'indice dei the first semester. The prices peak in August, but
the price index after August does not
prezzi successivamente non diminuisce in modo
significantly decrease as seen in the regular
percepibile come si è visto invece nell'andamento delle
routes' trend.
rotte regolari.
Average weighted prices
with origin or destination
in airports only
Source: elaborations on
CheckMyBus data
Jan. – July –
[€/km]
June Dec.
2017 0,140 0,116
2018 0,096 0,080
2019 0,082 0.084
2020 0.086 0.120
TRASPOL – Politecnico di Milano ||| Checkmybus.it
22Price variation against the previous Price variation against the same semester of
semester previous year
with origin or destination in airports only with origin or destination in airports only
Source: elaborations on CheckMyBus data Source: elaborations on CheckMyBus data
January – June July - December January – June July - December
2018 -16,9% -16,8% 2018 -31,4% -30,8%
2019 2% 2,7% 2019 -15,1% 4,8%
2020 2,3% 39,4% 2020 5.1% 42.6%
L’effetto della lunghezza del viaggio The influence of route length
La lunghezza del viaggio è un fattore determinante The length of the trip is one of the main
del prezzo medio per km. Le distanze più brevi drivers of the average price per km. Shorter
inferiori a 200 km costano proporzionalmente molto più distances less than 200 km proportionally cost
much more than longer distances. The price
delle distanze maggiori. L'indice dei prezzi ha infatti
index has a decreasing trend with the
una tendenza decrescente con l'aumento della
increase in travel distance. The 2020 curve
distanza da percorrere. La curva del 2020 segue per lo
mostly follows the usual trend, the only change
più la tendenza abituale, l'unico cambiamento è being the overall increase in the price index for
l'aumento complessivo dell'indice dei prezzi per tutte le all distance ranges. The greatest growth is seen
fasce di distanza. La crescita maggiore si osserva per for distances less than 100 km (25% with
distanze inferiori ai 100 km (25% rispetto al 2019). Per respect to 2019). For the year 2020, the fall of
l'anno 2020, la caduta dell'indice dei prezzi perTRASPOL – Politecnico di Milano ||| Checkmybus.it
24Andamento per direttrice Differences between routes
Analizzando nel dettaglio i percorsi per macroaree si Analyzing the macro-areas routes in detail, we
evidenziano diversi andamenti dei prezzi che possono highlight different price trends that may differ
differire anche in modo significativo dal valore medio. significantly from the average value.
Internal routes in the three macro areas are
I percorsi interni alle tre macro aree sono mediamente
those with the shortest average distances and
quelli con le distanze più brevi e quindi presentano un
therefore present a higher price/km. North-
prezzo / km più elevato. Le rotte Nord-Centro e Sud-
Center and South-Center routes can be
Centro possono essere considerate come parte della considered in the same distance group and in
medesima classe di distanza e infatti mostrano un fact they show a similar trend over the years of
andamento simile nei tre anni di monitoraggio. Le rotte monitoring. North-South routes fall in the longer
nord-sud rientrano nella classe delle distanze maggiori e distance class and show the lowest average
mostrano il prezzo medio per km più basso. price per km.
Average weighted length per macroarea route
Source: elaborations on CheckMyBus data
Route Average km
North - North 181
Center - Center 186
South - South 208
Center - North 458
Center - South 483
North - South 973
Gli andamenti dei prezzi per le rotte non- The price trends for the routes excluding
aeroportuali si sono completamente invertiti, con airports have completely reversed, with
prezzi in aumento per tutte le macroaree. L'aumento prices increasing for all the macro-regions.
The most significant increase in the price per
più significativo del prezzo al km è per le relazioni Sud-
km is for the South-South (55%) and the
Sud (55%) e il minimo per quelle Centro-Centro (16%).
least for Centre-Centre (16%). The other
L'altra macro relazione il cui prezzo per km è stato
macro relation whose price per km was above
superiore all'aumento medio (32%) è Nord-Centro the average increase (32%) is North-Centre
(34%). (34%).
Per le tratte aeroportuali invece l'incremento medio
del prezzo al km per tutte le macro relazioni è del Concerning airport routes, the average price
30%. Sopra alla media le relazioni Sud-Sud (54%) e per km increase for all macro relations is
Nord-Centro (43%). L'incremento più basso si osserva 30%, which is exceeded by the South-South
per la macro relazione Centro-Sud (14%). (54%) and North-Centre (43%). The lowest
increase is seen for the macro relation South-
Centre (14%).
TRASPOL – Politecnico di Milano ||| Checkmybus.it
25Price index per macroarea route
airport routes only
Source: elaborations on CheckMyBus data
0.20
€/km
0.18
0.16
0.14
0.12
0.10
0.08
0.06
0.04
2017 2017 2018 2018 2019 2019 2020 2020
I Sem II I Sem II I Sem II I Sem II
Sem Sem Sem Sem
South - South North - North
Center - Center Center - South
Center - North North - South
Il prezzo delle 10 rotte principali The price of the Top 10 routes
I prezzi al km per le 10 rotte nazionali più importanti The prices per km for the 10 most important
(distinte tra le rotte aeroportuali e non) mostrano national routes (distinct between airport
particolari interessanti. routes and not) demonstrates interesting
observations.
Tratte come Milano-Roma, Milano-Napoli, Napoli-Bari
Routes like Milano-Roma, Milano-Napoli,
e Villa San Giovanni-Roma, che avevano mantenuto le
Napoli-Bari and Villa San Giovanni-Roma that
loro posizioni negli ultimi due anni, hanno perso had retained their positions in the past two
popolarità nel 2020. È interessante notare che sono years were not so popular in 2020.
invece incluse 5 relazioni interne al Sud, 4 quattro Interestingly though, there are five routes
della relazione Centro-Sud e solo una interna alla from the relation South-South, four from
macroregione del Nord. Mentre nel 2019 il ruolo della the Centre-South and just the remaining
Sicilia era prevalente, nel 2020 l'Abruzzo contribuisce one internal to the North macro-region.
a 6 delle prime 10 rotte. Ciò è evidentemente dovuto While in 2019 Sicily's involvement was
prevalent, in 2020 Abruzzo contributes to 6
TRASPOL – Politecnico di Milano ||| Checkmybus.it
26alla preferenza per viaggi più brevi, come già out of the top 10 routes. This is evidently
sottolineato in precedenza. because shorter distances were preferred to
Delle 10 principali coppie di origini e destinazioni, longer distances, as already pointed out.
The top 10 routes include five relations
cinque di esse coinvolgono Napoli. Questi
involving Napoli. These routes are with the
collegamenti sono diretti alle regioni limitrofe
neighbouring regions of Abruzzo and Puglia
dell'Abruzzo e della Puglia verso le città di San Salvo,
towards the municipalities of San Salvo,
Roccaraso, Termoli, Pescara e Gallipoli. Il prezzo al km Roccaraso, Termoli, Pescara and Gallipoli. The
per questi percorsi varia tra 0,09 €/km e 0,11 €/km. price/km for these routes vary between
Il collegamento con Roccaraso è uno dei più cari 0.09€/km and 0.11€/km. The connection
(anche se inferiore del 40% rispetto al 2019), essendo with Roccaraso is one of the most expensive
meta sciistica almeno per il mese di gennaio quando la (though 40% lower than 2019), being a skiing
situazione era normale. Nelle prime 10 rotte sono destination at least for the month of January
presenti anche relazioni su distanze più brevi come when the situation was without impediments.
Shorter distance relations like Torino-Milano
Torino-Milano (140 km) e Roma-Chieti (190 km).
(140km) and Roma-Chieti (190km) are also
La quantità media di biglietti cercati per le prime 10
present in the top 10 routes.
rotte è diminuita di oltre il 50% e il prezzo medio/km
The average quantity of tickets searched for
per queste rotte è aumentato del 44% rispetto al 2019. the top 10 routes has fallen by more than 50%
Tra le prime 10 rotte aeroportuali, Bari-Matera è stata and the average price/km for these routes has
tra le rotte popolari con il prezzo più basso nel 2019, increased by 44% compared with 2019.
mentre nel 2020 si trova al secondo posto dopo il Among the top 10 airport routes, while Bari-
collegamento Firenze-Bologna aeroporto: il prezzo di Matera was among the lowest priced popular
quest’ultima relazione è salito di oltre il 300% (da route in 2019, it is in the second position after
0,055 €/km nel 2019 a 0,16 €/km nel 2020). I Firenze-Bologna Airport connection in 2020:
the price of this relation has risen over 300%
collegamenti tra Torino ei principali aeroporti del
(from 0.055€/km in 2019 to 0.16€/km in
Nord (Torino-BGY e Torino-MXP) hanno visto un
2020). The connection between Torino and
aumento del prezzo al km del 15% rispetto al 2019.
the principal airports of the North (Torino-
Quelli con il prezzo al km più basso tra le prime 10 BGY and Torino-MXP) have seen a 15%
rotte più cercate sono i collegamenti dell'aeroporto di increase in the price/km with respect to 2019.
Fiumicino con Salerno e Chieti a 0,073 €/km e 0,069 The ones with the lowest price per km among
€/km. Queste nuove relazioni dell'aeroporto di the top 10 searched routes are Fiumicino
Fiumicino sostituiscono quelle che erano state più airport's connections with Salerno and Chieti
popolari negli ultimi anni (Napoli e Perugia). at 0.073€/km and 0.069€/km. These new
relations of Fiumicino airport substitute the
ones that were more popular in the past years
(Napoli and Perugia).
TRASPOL – Politecnico di Milano ||| Checkmybus.it
27Prices per km of top 10 routes, 2020 II Semester
Source: elaborations on CheckMyBus data
È interessante notare è la differenza tra la mappa delle An interesting thing to note is the difference
principali relazioni fra regioni e quella delle principali 10 between the maps of the regional OD share and
coppie origine-destinazione. Ad esempio, la relazione the Top 10 routes. For example, the relation
Lombardia-Calabria presents 198 unique
Lombardia-Calabria presenta 198 coppie uniche origine-
origin-destination pairs and contribute to about
destinazione e contribuisce a circa il 5% della quota di
5% of the total market share, while Campania-
mercato totale, mentre quella Campania-Abruzzo
Abruzzo shows 74 relations between each other
mostra 74 collegamenti e contribuisce al 6% delle and contribute to 6% of the total market shares.
relazioni totali. La distribuzione delle coppie origine The origin-destination pairs' distribution is
destinazione è tuttavia completamente diversa, come è however totally different, as it evident in the
evidente nella mappa seguente [1 - per Campania - following map [1 – for Campania – Abruzzo;
Abruzzo; Lombardia - Calabria suddivisa in 2 a) e 2 b) Lombardia – Calabria split into 2 a) and 2 b) for
per una migliore visualizzazione]. better visualization].
Nessuna relazione fra città tra Lombardia e Calabria No route from the Lombardia-Calabria relation
shows up in the Top routes, while there are
compare nelle prime 10 rotte, mentre sono tre i
three relations between Campania and Abruzzo
collegamenti tra Campania e Abruzzo (Napoli-Vibo
(Napoli-Vibo Valentia; Napoli-San Salvo; Napoli-
Valentia; Napoli-San Salvo; Napoli-Roccaraso) che sono
Roccaraso) that are clearly visible in the Top
ben visibili nelle prime 10 rotte: i collegamenti tra routes: the top relations between Lombardy and
Lombardia e Calabria (Milano-Reggio Calabria; Milano- Calabria (Milano-Reggio Calabria; Milano-
Lamezia Terme) hanno meno della metà della domanda Lamezia Terme) have less than half of the
rispetto a quelli Campania-Abruzzo, ovvero hanno una demand than the Campania-Abruzzo ones
domanda non sufficiente ad entrare nelle rotte più implying that the connections are weak to enter
richieste ma, considerati nel complesso, formano una the top routes but many to have, as a whole, a
quota significativa delle ricerche degli utenti. significant share. These details is illustrated in
the figure below.
TRASPOL – Politecnico di Milano ||| Checkmybus.it
28Puoi anche leggere