Multi-Model Ensemble for day ahead PV power forecasting improvement
←
→
Trascrizione del contenuto della pagina
Se il tuo browser non visualizza correttamente la pagina, ti preghiamo di leggere il contenuto della pagina quaggiù
Dipartimento Ingegneria dell’Impresa              Mercati energetici e metodi quantitativi:
     Università degli Studi di Roma Tor Vergata        un ponte tra Università e Aziende, 13 0ttobre 2016, Padova

Multi-Model Ensemble for day ahead PV power
forecasting improvement
Cristina Cornaroa,b, Marco Pierroa,e, Francesco Buccia, Matteo De Feliced,
Enrico Maggionic, David Mosere, Alessandro Perottoc, Francesco Spadac,

aDepartment    of Enterprise Engineering, University of Rome Tor Vergata, Via del Politecnico 1, 00133 Rome,
Italy, e-mail: cornaro@uniroma2.it, marco.pierro@gmail.com, frabucci@gmail.com
bCHOSE, University of Rome Tor Vergata, Via del Politecnico 1, 00133 Rome, Italy 7
cIdeam Srl, via Frova 34 Cinisello Balsamo, Italy, e-mail: alessandro.perotto, enrico.maggioni,

francesco.spada@ideamweb.com
dCasaccia R.C., ENEA Climate Modelling Laboratory, Rome, Italy e-mail: matteo.defelice@enea.it
eEURAC Research, Viale Druso, 1, 39100 Bolzano, Italy e-mail: david.moser@eurac.edu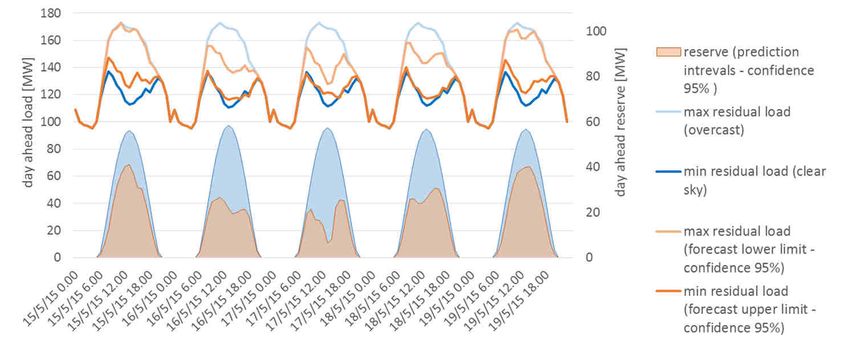
Dipartimento Ingegneria dell’Impresa Mercati energetici e metodi quantitativi:
Università degli Studi di Roma Tor Vergata un ponte tra Università e Aziende, 13 0ttobre 2016, Padova
Why day ahead PV power forecast
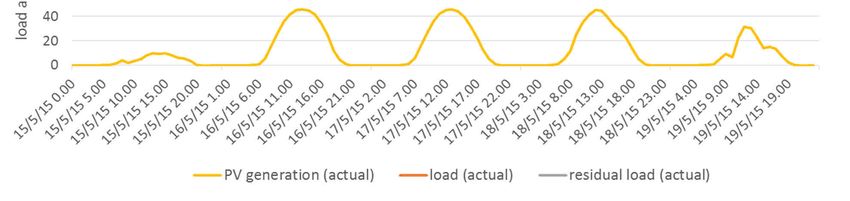
Large share of PV power introduces into the electric demand a stochastic variability
dependent on meteorological conditions: residual load = load-PV generation
Reserve
PV Power
ramp
example of regional load and PV generation trend with 8.3% PV penetration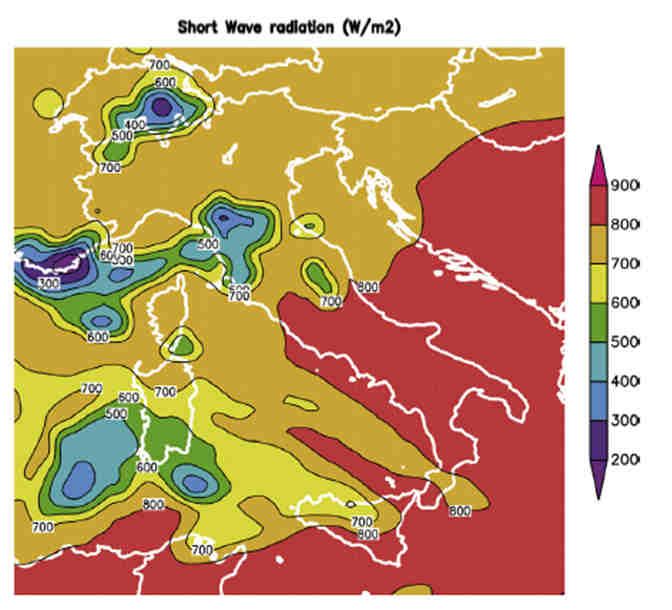
Dipartimento Ingegneria dell’Impresa         Mercati energetici e metodi quantitativi:
    Università degli Studi di Roma Tor Vergata   un ponte tra Università e Aziende, 13 0ttobre 2016, Padova

Why day ahead PV power forecast
Day ahead PV power forecast could mitigate these effects

PV POWER FORECAST

• to improve the capability of
residual load tracking and
transmission scheduling

•to obtain a better match
between the day-ahead
market commitment and the
real PV production, reducing
the energy imbalance costs.
Dipartimento Ingegneria dell’Impresa         Mercati energetici e metodi quantitativi:
     Università degli Studi di Roma Tor Vergata   un ponte tra Università e Aziende, 13 0ttobre 2016, Padova

Why day ahead PV power forecast

PREDICTION INTERVALS

• to reduce uncertainty in the
electric demand so that lower
energy reserves are needed

• for energy trading issues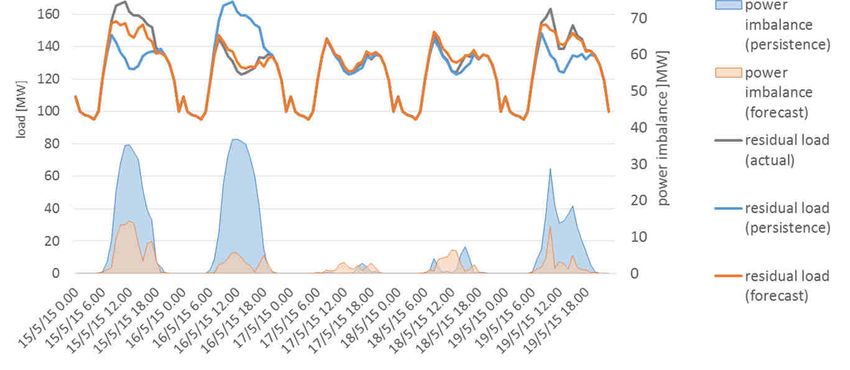
Dipartimento Ingegneria dell’Impresa         Mercati energetici e metodi quantitativi:
   Università degli Studi di Roma Tor Vergata   un ponte tra Università e Aziende, 13 0ttobre 2016, Padova

Aim of the work

•to develop and test several data-driven models for day ahead site PV
power forecast (with hour granularity) using different NWP forcing

•to build up an outperforming Multi-Model Ensemble with its
prediction intervals.
Dipartimento Ingegneria dell’Impresa         Mercati energetici e metodi quantitativi:
    Università degli Studi di Roma Tor Vergata   un ponte tra Università e Aziende, 13 0ttobre 2016, Padova

Data driven approach for day ahead PV production forecast
In the last years a data-driven approach has been extensively tested for PV
power generation forecast from 24 to 72 hours horizon.
This approach involves a wide range of
machine learning techniques that can be
built making use of Numerical Weather
Prediction (possibly corrected by Model
Output Statistic) and weather and PV
generation historical data.

These algorithms try to reconstruct
relationships between input and output
through a training and validation
procedure on historical data
Hybrid models could be obtained using
different models in series.

While combining together different forecast models a Multi-Model Ensemble can be built.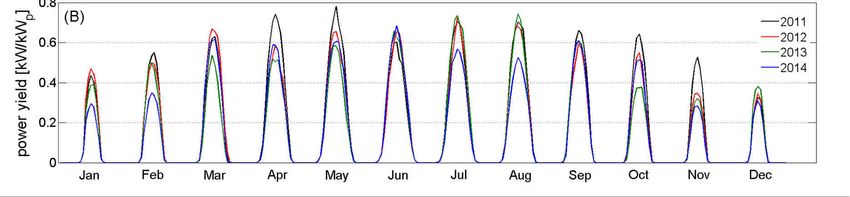
Dipartimento Ingegneria dell’Impresa Mercati energetici e metodi quantitativi:
Università degli Studi di Roma Tor Vergata un ponte tra Università e Aziende, 13 0ttobre 2016, Padova
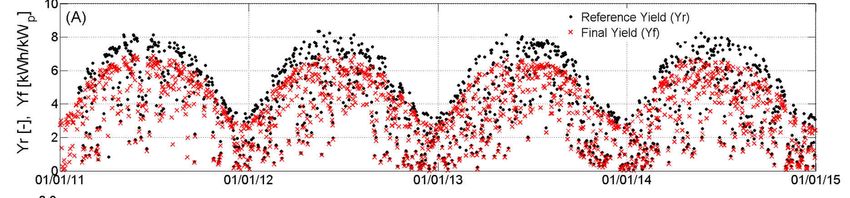
Data used for training and test
Historical weather and PV power production data
Four years of monitored irradiance, temperature and production data
(2011-2014) from a 662 kWp Cadmium Telluride PV plant, located in
Bolzano (Italy), were employed to train and test the models.
Data were acquired every 15 minutes and then averaged each hours
Daily reference
and final yield
Monthly average
of daily power
yield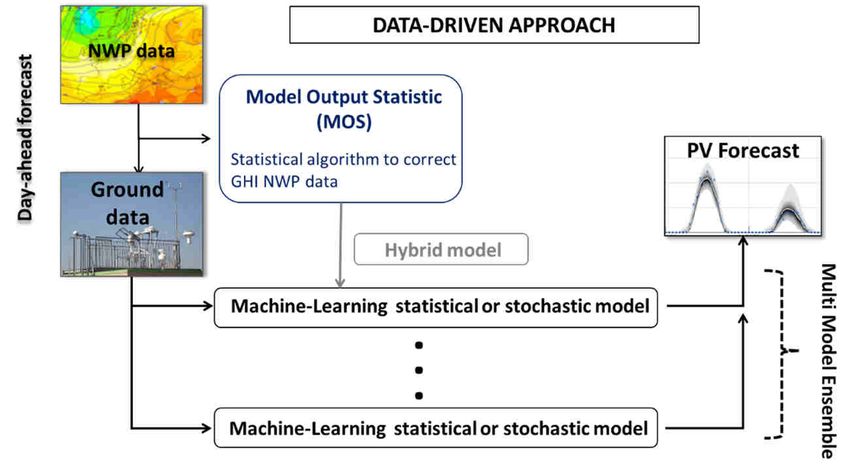
Dipartimento Ingegneria dell’Impresa           Mercati energetici e metodi quantitativi:
     Università degli Studi di Roma Tor Vergata     un ponte tra Università e Aziende, 13 0ttobre 2016, Padova

Data used for training and test
Two Numerical Weather Prediction data were used as models input
1) NWP generated by the Weather Research and Forecasting
(WRF–ARW 3.6.1) mesoscale model developed by National Center of
Atmospheric Research (NCAR)
      Forecast horizon: 24 hour
      Temporal output resolution: 20 minute and then averaged each hours
      Spatial resolution 3 km centered on the region of interest
      Initial and contour data for model initialization: GSF model
      Radiation scheme: “Rapid Radiative Transfer Model” (RRTM)

Global Horizontal Irradiance (GHI) provided by WRF was post
processed with an original Model Output Statistic called MOSRH.

2) NWP generated by the Integrated Forecasting System (IFS) the global weather forecasting
model from the European Centre for Medium-Range Weather Forecasts(ECMWF).
      Forecast horizon: 24 hour
      Temporal output resolution: 1 hour
      Spatial resolution 16 km
      Radiation scheme: RRTM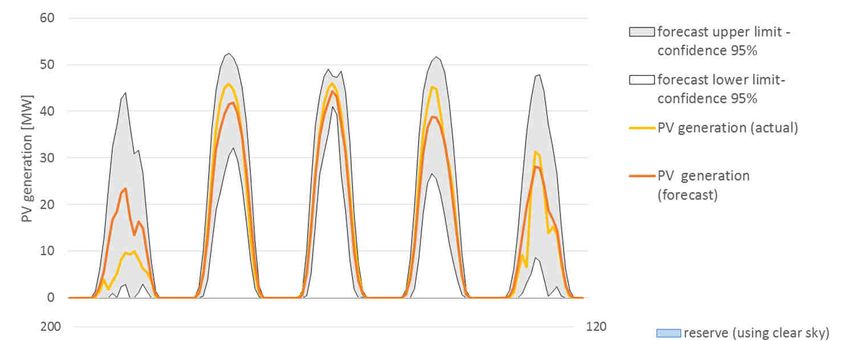
Dipartimento Ingegneria dell’Impresa         Mercati energetici e metodi quantitativi:
      Università degli Studi di Roma Tor Vergata   un ponte tra Università e Aziende, 13 0ttobre 2016, Padova

Data driven techniques
Two data-driven techniques were adopted to built the forecast models
1.    Qualified ensemble of 300 MLPNNs with one hidden layer
 •   500 MLPNN with the optimal hidden neuron (S) were
     generated using a Sub-Sample Random Validation
     Procedure on the training data
 •   A qualified ensemble was selected (around 300 ANNs),
     choosing all the ANNs with the MSE lower than the
     average MSE of the 500 networks
 •   Forecast was obtained by averaging the ensemble
     outputs.

2.   Support Vector Regression method called ε-SVR,
 •   Gaussian Kernel was adopted
 •   an extensive grid search on more than 400 combinations
     was performed to set the model parameters:
      regularization parameter (C), insensitive zone (ε), std (γ)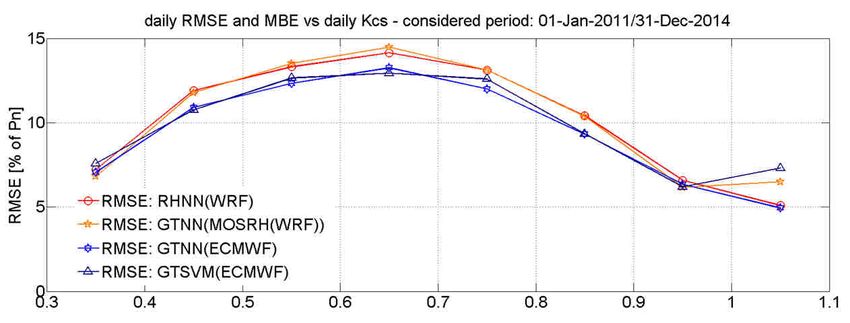
Dipartimento Ingegneria dell’Impresa         Mercati energetici e metodi quantitativi:
    Università degli Studi di Roma Tor Vergata   un ponte tra Università e Aziende, 13 0ttobre 2016, Padova

Data driven forecasting models
1   Based on Ensemble of MLPNNs using NWP inputs from WRF

                                                                              PV power
                                                                               forecast

2   Hybrid model based on MOSRH + ANNs Ensemble using NWP inputs from WRF
Dipartimento Ingegneria dell’Impresa Mercati energetici e metodi quantitativi:
Università degli Studi di Roma Tor Vergata un ponte tra Università e Aziende, 13 0ttobre 2016, Padova
Data driven forecasting models
3 Based on Ensemble of MLPNNs using GHI inputs from ECMWF
4 Based on Support Vector Machine using GHI inputs from ECMWFDipartimento Ingegneria dell’Impresa Mercati energetici e metodi quantitativi: Università degli Studi di Roma Tor Vergata un ponte tra Università e Aziende, 13 0ttobre 2016, Padova Results: forecast models accuracy
Dipartimento Ingegneria dell’Impresa         Mercati energetici e metodi quantitativi:
    Università degli Studi di Roma Tor Vergata   un ponte tra Università e Aziende, 13 0ttobre 2016, Padova

Results: Multi Model Ensemble construction and evaluation

Since all the models show similar
errors in different predicted
typologies of days (identifies by
daily clear sky predicted by WRF),
the Multi-Model ensemble was
built just averaging the different
prediction trajectories
Dipartimento Ingegneria dell’Impresa Mercati energetici e metodi quantitativi:
Università degli Studi di Roma Tor Vergata un ponte tra Università e Aziende, 13 0ttobre 2016, Padova
Results: Multi Model Ensemble construction and evaluation
The MME outperforms the best
model of the ensemble
GTNN(ECMWF)
MME reaches a skill score with
respect to the RMSE of PM of 46%
while the best forecast model
GTNN(ECMWF) obtains a skill
score of 42%.
It was proved that the best performance of multi-model approach could be
achieved averaging the higher variety of different algorithms and different NWP
models with the only condition that all the ensemble members should have similar
RMSE (RMSE difference less than 1% measured on one year data)Dipartimento Ingegneria dell’Impresa Mercati energetici e metodi quantitativi:
Università degli Studi di Roma Tor Vergata un ponte tra Università e Aziende, 13 0ttobre 2016, Padova
Results: MME prediction intervals construction and
evaluation
The prediction Intervals could be calculated forecasting the standard deviation of
the residuals (σfor) under the hypothesis that the residuals are normally distributed
with zero expected value
Ensemble of MLPNNs using MME power forecastDipartimento Ingegneria dell’Impresa Mercati energetici e metodi quantitativi:
Università degli Studi di Roma Tor Vergata un ponte tra Università e Aziende, 13 0ttobre 2016, Padova
Results: MME prediction intervals construction and
evaluation
The frequency of observations falling
inside the prediction interval is greater
or equal than the confidence level
associated to that interval for all years
considered.
Observation (dots), MME forecast (white line) and prediction intervals (grey lines) for five days of 2011Dipartimento Ingegneria dell’Impresa Mercati energetici e metodi quantitativi:
Università degli Studi di Roma Tor Vergata un ponte tra Università e Aziende, 13 0ttobre 2016, Padova
Conclusions
• Models based on different non linear machine learning algorithms (stochastic
or statistic) making use of the same NWP data provide forecast with similar
accuracy.
• The best performance of multi-model approach could be achieved averaging
the higher variety of different algorithms and different NWP models with the
only condition that all the ensemble members should have similar RMSE (RMSE
difference less than 1% measured on one year data).
• The MME reaches a skill score with respect to the RMSE of PM of 46% while
the best forecast model obtains a skill score of 42%.Dipartimento Ingegneria dell’Impresa Mercati energetici e metodi quantitativi:
Università degli Studi di Roma Tor Vergata un ponte tra Università e Aziende, 13 0ttobre 2016, Padova
References
C. Cornaro, F. Bucci, M. Pierro, F. Del Frate, S. Peronaci, A. Taravat, 2015. 24-H solar
irradiance forecast based on neural networks and numerical weather prediction. J. Sol.
Energy Eng. 2015; 137(3).
C. Cornaro, M. Pierro, F. Bucci, 2015. Master optimization process based on neural network
ensemble for 24h solar radiation forecast. Solar Energy, 111, 297-312, 2015.
M. Pierro, F. Bucci, C. Cornaro, E. Maggioni, A. Perotto, M. Pravettoni, F. Spada, 2015.
Model Output Statistics cascade to improve day ahead solar irradiance forecast. Solar
Energy, Volume 117, July 2015, Pages 99-113.
M. Pierro, F. Bucci, M. De Felice, E. Maggioni, D. Moser, A. Perotto, F.Spada, C.Cornaro,
2016. Multi-Model Ensemble for day ahead prediction of photovoltaic power generation.
Solar Energy, Volume 134, September 2016, Pages 132–146.
M. Pierro, F. Bucci, M. De Felice, E. Maggioni, D. Moser, A. Perotto, F.Spada, C.Cornaro,
2016. Deterministic and stochastic approaches for day-ahead solar power
forecasting.Published online J. Sol. Energy Eng., doi: 10.1115/1.4034823.Dipartimento Ingegneria dell’Impresa Mercati energetici e metodi quantitativi:
Università degli Studi di Roma Tor Vergata un ponte tra Università e Aziende, 13 0ttobre 2016, Padova
Thank you for your attention
Visit ESTER lab at www.ester.uniroma2.itPuoi anche leggere