EXTREME FLOODS IN CENTRAL JORDAN: FREQUENCY ANALYSIS
←
→
Trascrizione del contenuto della pagina
Se il tuo browser non visualizza correttamente la pagina, ti preghiamo di leggere il contenuto della pagina quaggiù
DOI: 10.4408/IJEGE.2020-01.O-02

                EXTREME FLOODS IN CENTRAL JORDAN: FREQUENCY ANALYSIS

                           ZEYAD TARAWNEH(*), NIDAL HADADIN(**)& ESRAA TARAWNEH(***)

                                         (*)
                                               Department of Civil Engineering, Hashemite University, 13115 Zarqa, Jordan
                                      (**)
                                             Department of Civil Engineering, The University of Jordan, 11942Amman, Jordan
                                              (***)
                                                    Department of Civil Engineering, Mutah University, 61710Mutah, Jordan
                                                                 Corresponding author: zeyadt@hu.edu.jo

EXTENDED ABSTRACT
      Negli ultimi anni, la Giordania e altri Paesi del Medio Oriente sono stati interessati da inondazioni distruttive, con perdite di vite
umane e danni alle infrastrutture. Questo studio analizza le inondazioni improvvise giornaliere nella regione del Wala, nella Giordania
centrale, dove si è verificata la maggior parte delle alluvioni, come quella tragica del 10 Novembre 2018. Per quantificare l’entità, la
distribuzione della durata del flusso e la frequenza delle alluvioni, sono stati utilizzati i flussi giornalieri osservati, quelli sintetici e
sviluppati modelli teorici. Sono state quindi suggerite misure per ridurre l'impatto delle future alluvioni nel bacino del Wala, l’area
oggetto di studio, situato a monte della diga di Wala di estensione pari a 1743 km2. L'area nel periodo invernale riceve una precipitazione
media di 226mm, dove il deflusso superficiale generato a monte del bacino viene utilizzato per ricaricare le falde acquifere e fornire
acqua per l'irrigazione alle attività agricole a valle della diga. Il bacino del Wala ha una pendenza media del 3,8%, una lunghezza del
corso principale di 80,9 km e una CN media di 70, con un tempo di ritardo e un tempo di concentrazione calcolato nel bacino,
rispettivamente pari a 18,9 ore e 31,5 ore, e l'idrogramma unitario SCS a 1ora indica un tempo di base dell'idrogramma pari a 52 ore, che
potrebbe giustificare l'uso di flussi giornalieri per caratterizzare inondazioni estreme. Lo studio ha utilizzato dati giornalieri di flusso
intermittente, del periodo ottobre 2002-agosto 2016, come base per generare una serie molto lunga di flussi giornalieri sintetici, che
possono essere utilizzati per analizzare e rilevare inondazioni estreme giornaliere, non evidenziate dall'analisi dei flussi brevi osservati. A
tal fine, è stato inizialmente ottenuto il processo di non occorrenza (stato 0) e di occorrenza (stato 1) dei flussi giornalieri ed il processo
0-1 è stato assunto come due stati stazionari semplici di Markov, mentre l'entità del flusso giornaliero è stata modellata utilizzando una
distribuzione Gamma a due parametri. Le probabilità di stato condizionato e incondizionato stimate sono state P0=0,935, P00 = 0,971 e
P11 = 0,598 e gli stimatori della distribuzione Gamma e dei parametri di forma e scala, rispettivamente pari a α = 0,281 e λ = 0,443. La
distribuzione Gamma a due parametri dedotta, ben si adatta alla distribuzione dei flussi giornalieri del Wala, specialmente per la coda
superiore dei flussi. Usando le probabilità dello stato condizionale ed incondizionato e la distribuzione Gamma è stata generata una serie
molto lunga di flussi giornalieri sintetici (100 volte più lunghi del record di flusso giornaliero osservato). È risultato che i flussi
giornalieri sintetici ben rappresentano i flussi osservati pertanto sono stati utilizzati per individuare il verificarsi di alluvioni estreme non
rilevate utilizzando i brevi flussi giornalieri osservati. L'analisi dei flussi giornalieri sintetici osservati, con i modelli teorici sviluppati, ha
mostrato che circa il 40% dei flussi giornalieri sono da riferirsi ad eventi di un giorno e circa il 24% ad eventi di 2 giorni. Tali
inondazioni di breve durata (64% del tempo) sono comuni nei mesi di Novembre e Dicembre, nel passaggio dalla stagione delle piogge a
quella non piovosa e hanno seguito il modello delle brevi tempeste invernali, prevalentemente di 2 giorni o meno, nella regione della
Giordania centrale. L'analisi delle lunghe serie di flussi sintetici ha mostrato la possibilità di insorgenza di numerose alluvioni estreme di
magnitudo superiori alla più grande alluvione osservata (10.368 milioni di m3/giorno), pari a 14,65 milioni di m3/giorno. Il tempo di
ritorno calcolato e la probabilità di occorrenza della più grande inondazione osservata sono stati rispettivamente di 78 anni e dell'1,3%.
Questa può essere considerata come un evento raro poiché la regione del Wala è soggetta a inondazioni di magnitudo pari o inferiori a
6,337 milioni di m3/giorno. Per mitigare l'effetto di possibili alluvioni improvvise, il rimboschimento del bacino del Wala a monte della
diga con un adeguato schema di contro terrazzamento potrebbero essere pratiche adeguate ad attenuare l'entità delle future alluvioni.
.

Italian Journal of Engineering Geology and Environment, 1 (2020)     © Sapienza Università Editrice                            www.ijege.uniroma1.it    17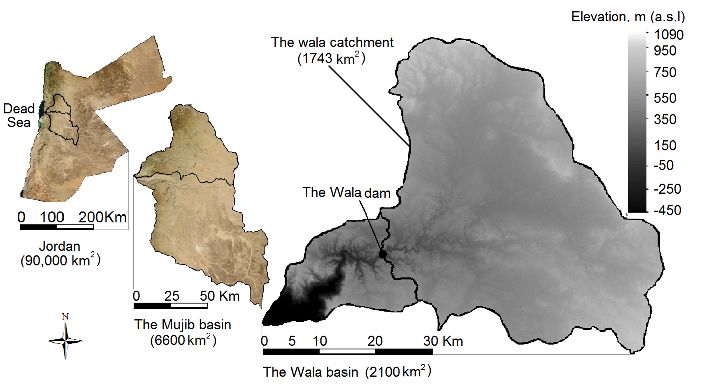
Z. TARAWNEH, N. HADADIN & E. TARAWNEH
ABSTRACT
This research aims at analyzing the frequency and duration
distribution of extreme floods, including flash, in the Wala
catchment - Central Jordan. The observed daily flows series,
October 2002 to August 2016, was short to characterize
extreme events like the 10th of November 2018 deadly flash
flood. Therefore, a very long series of intermittent daily flows
was synthesized assuming that the daily flow-nonflow process
is stationary two-state simple Markov and the daily flow
magnitude is Gamma distributed.
The synthesized flows have succeeded to copy the
characteristics of the observed flows. The analysis of the Wala
observed, simulated daily flows and results from the theoretical Fig. 1 - Average monthly rainfall in mm (grey bars) and temperature in
°C (black bars) for Madaba region - Central Jordan
model showed that floods of duration 2 days or less were
dominant events (64%); the single day type was more often
(40%) compared to the 2 days flood (24%). Regarding the 10th
of November 2018 deadly flash flood of 10.368MCM/day, the
inspection of the synthesized daily flows showed that it was an
uncommon incident of 78 years recurrence time.
Afforestation the upper regions in the Wala catchment and
construction of counter terracing are possible measures to
mitigate the impact of future flash floods.
KEYWORDS: flash floods, frequency analysis, intermittent flow, Jordan
INTRODUCTION
Extreme floods, of recurrence time and peak magnitude,
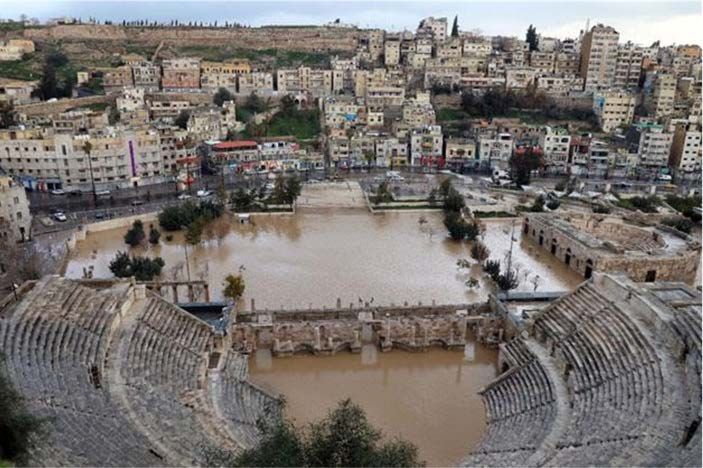
are the first among the natural calamities in the world Fig. 2 - The Roman theatre in Amman after the 28th of February 2019
(GAVARDASHVILI, 2013). During the 2018/2019 rainy season, flash flood
Jordan has witnessed three major floods; two were classified as
the worst deadly flash floods over several decades. sites (Fig. 2), commercial losses and human casualties.
These floods left Jordan with several human deaths and Table 1 shows a summary of recent and historic flash
injuries, substantial damage to the infrastructure and economic floods in Jordan. In literature, few studies about floods in
losses due to flooded commercial regions in Amman and other Jordan were conducted concentrating either on estimating the
Jordanian cities. Although Jordanian lands receives low to magnitude of the flood peak and suggesting measures to reduce
moderate annual rainfalls over the whole rainy season, around its impact on human activities (AL-WESHAH & EL-KHOURY,
100mm or less in southern and eastern regions to around 600 1999; AL-QUDAH, 2011) or mapping the susceptibility of
mm in the north-west regions; however, sometimes the country extreme floods in some of the Jordanian arid regions (FARHAN
witnesses heavy rainfall events that usually cause devastating & AYED, 2017). Previous flood studies in Jordan have used
flash floods. rainfall-runoff computer models (HEC-1, HEC-RAS and GIS)
In small basins, such short time intense rainfalls usually to simulate and generate flood peaks given the study region
generate extreme floods (KUNDZEWICZ et alii, 2014). The characteristics and rainfall data from gauging stations within
intense rainy storms in Jordan regularly occur during the and around the studied regions.
transition period between seasons, October – November for For accuracy purposes, such computer models need
non rainy to rainy, while March – May for rainy to non rainy information of high quality to properly calibrate, validate,
(AL-QUDAH, 2011). Normally, the rainy season in Jordan generate floods and determine peak values. Although previous
begins effectively in the beginning of November and ends in flood studies in Jordan are significant; however, few short
the mid of April (Fig. 1). comings were reported. AL-WESHAH & EL-KHOURY (1999)
Recently and over the past few decades, Jordan has faced reported a non continuous daily rainfall data for parts of the
several devasting flash floods that have ended with study period (1980 up to 1995) and few observed peak
considerable damage to the infrastructure including historical flows from limited number of storms in Petra region.
18 Italian Journal of Engineering Geology and Environment,1 (2020) © Sapienza Università Editrice www.ijege.uniroma1.itEXTREME FLOODS IN CENTRAL JORDAN: FREQUENCY ANALYSIS
Date Damage due to the flash flood Notes
(Location)
28/2/2019 2000 accidents: houses flooding, vehicles being swept away and 279 downtown Heavy rainfall: 68mm in 24hours (nearly
(Amman) traders affected by the flood. Estimated damage cost = 15 Million $ 20% of the whole rainy season).
10/11/2018 12 people were killed and 29 were injured in Wala region, Madaba. Evacuation of Flash flood of 10.368 MCM /day**.
(Madaba and thousands of tourists from the ancient city of Petra
Petra)
25/10/2018 17 region near the Dead Sea
21 school children were killed and several injured in Zara Heavy rainfall: 50mm in 20minutes.
(Zara)
11/3/1966 100 people were killed in Ma'an city Heavy rainfall in the desert area of Ma'an.
(Ma'an)
Tab. 1 - Recent and historic flash floods in Jordan. **MCM: Million Cubic Meters.
Furthermore, the quality of rainfall data from gauging MATERIALS AND METHODS
stations in Southern Jordan was dubious due to the poor control The Wala catchment upstream the Wala dam (Fig. 3) is
and the existence of missing data (AL-QUDAH, 2011). In selected as a study region to characterize flash floods in central
general, information from conventional rain-gauge networks Jordan where recent deadly floods have occurred (Table 1).
may not well capture the severity of storms that generate flash Upstream the Wala Dam (31° 34' 5.4"N, 35° 48' 16.6"E), the
floods (KOUTROULIS & TSANIS, 2010). catchment area is 1743 km2. The Wala Dam of the 9MCM
In literature different procedures were used to estimate or storage capacity, located 60 km south of Amman, was
model the flood peak. These procedures rely on either constructed between 1999 and 2002 to harvest the surface
empirical equations (e.g. KOUTROULIS & TSANIS, 2010; runoff during the rainy season. The dam storage is used mainly
ALABYAN, 2018), standard hydrological models (e.g. to recharge the ground aquifers and provide irrigation water to
all downstream agricultural activities (TARAWNEH et alii,
CHANDRAMOHAN & VIJAYA, 2017), runoff generation computer
2016). In general, the study region is characterized by hot dry
models and neural networks (e.g. KISI et alii, 2013;
climate during the summer while cool cold wet climate during
SHABANLOU, 2014), paleofloods (e.g. LOPEZ-AVILES, 2007), or
the winter. It receives an average precipitation of 226 mm
stochastic models (e.g. TODOROVIC & ZELENHASIC, 1970;
during the rainy season.
GEORGAKAKOS, 1986; MORRISON & SMITH, 2002; TSAKIRIS et
The Wala catchment has an average slope of 3.8%,
alii, 2015).
streamflow length of 80.9 km and an average CN (Curve
In the direct flood frequency analysis with observed
Number) of 70. Based on the SCS (Soil Conservation Service)
peakflow as an input data, all procedures were involved in methodology, the computed catchment lag time and time of
selecting and fitting an appropriate theoretical probability concentration are 18.9hrs and 31.5hrs, respectively.
distribution to model the flood frequency (SMITHERS, 2012). Furthermore, the computed 1hr SCS unit hydrograph for the
For example, the generalized extreme value (GEV) distribution Wala catchment indicates a hydrograph base time of 52hrs
was used to model the peak floods considering either the which could justify the use of daily flows to characterize
annual maximum series or the partial duration series of extreme floods.
peakflows (MORRISON & SMITH, 2002; VILLARINI et alii, 2012;
VIVEKANANDAN, 2014).
Other distributions like the four-parameter kappa, three-
parameter generalized Pareto and lognormal distributions were
found to provide a good approximation to flow duration curves
(BLUM et alii, 2017). The major objective of this research is to
model and characterize extreme floods, including flash floods,
of the Wala region in central Jordan where the majority of
recent flash floods have happened. The characterization
involves the determination of the flood duration distribution
and how frequent the deadly 10th of November 2018 flash flood
is. Furthermore, this study will suggest few measures to reduce Fig. 3 - The Wala catchment in Central Jordan (TARAWNEH et
the impact of future flash floods in the Wala catchment. alii,2016)
Italian Journal of Engineering Geology and Environment, 1 (2020) © Sapienza Università Editrice www.ijege.uniroma1.it 19Z. TARAWNEH, N. HADADIN & E. TARAWNEH
This study uses daily observed flow data covering the 3 – Assuming the initial seed takes the state i, i.e. Y1 = i, then
period from 30 October 2002 to 2 August 2016 to characterize the state of Yt+1 is:
extreme daily floods. The 0 flow data over the non rainy
season, mid of April to the end of October (Fig. 1), has been , t=1,2,… (1)
removed because there are no storms during the summer.
During the rainy season, beginning of November to the mid of
April (Fig. 1), daily flows run in the Wala valley throughout the where Ut is a new random number generated at the time (t) as
existence of the rainy storm, and somehow after depending on in step 1.
the catchment characteristics, and return to 0 right after the The state j continues to occur as long as U ≤ Pjj, otherwise
storm effect vanishes. Therefore, during the rainy season, the returns to i. Notations in steps 2 and 3 are inverted if the initial
Wala daily flows series forms an intermittent series of 5025 state is j. After generating the 0 – 1 process, the two-parameter
observed flows measured at the dam site. Figure 4 shows the Gamma distribution is used to directly generate the magnitude
intermittent series of the observed daily flow spanning over the of the daily flow. The probability density function of the two-
study period. parameter Gamma is:
(2)
where x is the flow magnitude (an independent variable), α and
λ are the distribution shape and scale parameters, respectively.
In AKSOY &BAYAZIT (2000) and AKSOY (2003), the Gamma
distribution was used to generate the flow increments over the
rising limb of the hydrograph, while the flow decrements was
calculated given the exponential recession of the falling limb of
the hydrograph. For the Wala catchment, the majority of the
observed daily flows generated due to time separated short
Fig. 4 - The Wala valley intermittent observed daily flow (bars). The
duration storms (1 - 2 days at most).
Dashed line represents the 10th of November 2018 flash flood
of 10.368MCM/day measured at the Wala dam site. Unfortunately, it was hard to obtain the complete
components of the flow hydrograph, i.e. clear rising and falling
In order to figure out how frequent was the 10th of limbs of the complete hydrograph were not utilized most of the
November 2018 flood of magnitude 10.368MCM/day, the time. For that reason, the Wala catchment daily flow magnitude
is assumed Gamma independent random variable. After
general procedures described in AKSOY& BAYAZIT (2000) and
generating a new random number (Uf) from the uniform
AKSOY (2003) will be used to synthesize the Wala intermittent
distribution, the magnitude of the daily flow (x) is computed
daily flows under the assumption that the occurrence and the
from the Gamma distribution cumulative probability, P(X ≤ x),
non occurrence of the daily flow is stationary two-state simple
such that P(X ≤ x) = Uf. Theoretically, the distribution of the
Markov process. In Jordan, so far there is no scientific flow duration (d) is computed as:
evidence that climate change has changed the pattern of the
surface flow or the magnitude of the flood; therefore, the P[D = d] = P[Yd = 1, Yd-1 = 1,.., Y1 = 1| Y0 = 0] (3)
modeling of the daily flow as stationary process looks
plausible. Since the daily flow is assumed stationary two states simple
For daily flow generation, at first the intermittent daily flow Markov process then Eq.(3) is reduced to P[Yd = 1, Yd-1 = 1,
series is converted to a 0 – 1 process, the state 1 is assigned to ….., Y2 = 1] × P[Y1 = 1| Y0 = 0]. The term P[Y1 = 1| Y0 = 0] =
the flow occurrence and 0 otherwise. Having estimates of the P01, and the term P[Yd = 1, Yd-1 = 1, ….., Y2 = 1] is reduced to
unconditional and conditional state probabilities (Pi, Pii and Pjj) P[Yt = 1| Yt-1 = 1](d-1) = P11(d-1). Therefore, the probability
a synthetic 0 – 1 process (Y) to simulate the daily flow distribution function of the flow duration is:
occurrence and non occurrence is generated as follows:
1 – A random number (U1) is generated from the Uniform (4)
distribution, U∈[0, 1]. For flash flood characterization, i.e. how frequent the event
2 – If U1 ≤ Pi, then the initial seed is the state i, otherwise j. is, the return period (T) defined as the expected value of the
20 Italian Journal of Engineering Geology and Environment,1 (2020) © Sapienza Università Editrice www.ijege.uniroma1.itEXTREME FLOODS IN CENTRAL JORDAN: FREQUENCY ANALYSIS
waiting time (w) between successive flood events that exceed a The visual inspection of how the two-parameter Gamma
specified value is computed as: distribution well fitted the flow magnitude is illustrated in
Fig. 5.
(5) With the exception of the very low flows, the two-
parameter Gamma distribution well fitted the distribution of the
Wala daily flows especially for the upper tailof flows which is
where n is total the number of flood events and L is the length
the case of this study (extreme floods). In general, distributions
of data used to characterize floods. For the intermittent daily
that allocate sufficient probability to the upper tail of flows
flow series, it can be argued that flow events of magnitude
must be employed (BOWERS et alii, 2012). Given the
exceed a specified value are independent flood events
unconditional, the conditional state probabilities and the
especially when the daily flows are surface runoffs due to time
Gamma distribution parameters listed above and following the
separated rainy storms given that the baseflow is absent. For
procedures mentioned in the previous section, the Wala
continuous river flows, independence among seasonal floods
synthetic daily flow series of sufficient length (100 times the
was assumed in previous studies (e.g. BARATTI et alii, 2012).
length of the observed data) was obtained. The mean, the
Under the assumption that floods events due to time separated
variance and the skewness of the synthetic daily flows were:
storms emerge independently, the occurrence probability of
0.62, 1.43 and 3.88, respectively, which are very comparable to
observing a flood event equals or exceeds the specified value
the Wala observed daily flows mean of 0.63, variance of 1.43
(x) is:
and skewness of 3.50; therefore, it can be concluded that the
synthetic daily flows well copied the characteristics of the
(6) observed flow of the Wala catchment and can be used to
capture extreme floods cannot be detected throughout the
RESULTS AND DISCUSSION analysis of the short observed flows.
In order to characterize extreme floods in the Wala region, Upon inspecting the observed daily flow series of the Wala
and since the observed flow data provided limited information catchment (Fig. 4), the highest flow (historical flood) was a
about extreme past floods (few historical extreme flood events single day event of 8.013MCM magnitude which occurred in
existed), the stochastic nature of the intermittent Wala daily the 23th of November 2004. Figure 6 shows the flow (flood)
flow was used to generate a synthetic series of daily flows. duration distribution after analyzing the observed, synthetic
Based on the 5025 observed daily flows, the estimates of the flows and Equation 4.
unconditional and the conditional state probabilities were P0 =
0.935, P00 = 0.971 and P11 = 0.598, respectively, (the state 0
for non flow). Also, the moment estimators of the Gamma
distribution shape and scale parameters were α = 0.281 and λ =
0.443, respectively. The series of the 5025 observed daily flows
used to estimate the unconditional and the conditional state
probabilities and the two state Gamma parameters could be
quite long enough to obtain reliable estimates.
Fig. 6 - The distribution of the Wala daily flow (flood) versus the
duration after analyzing observed flows (grey bars),
synthetic flows (white bars) and using Eq.4 (solid curve)
In fact, due to the time separated rainy storms, the
majority of the daily flows occurred in the Wala catchment
were single day events of magnitude between 0.004 to
8.013MCM. After analyzing the observed daily flows, it has
been found that about 40% of the daily flows (floods) were
Fig. 5 - The fitted two-parameter Gamma distribution (solid curve) single day events, including the highest (8.013MCM) and the
versus the empirical distribution of the daily flow (circles) third highest (6.071MCM) floods occurred in the 23th of
Italian Journal of Engineering Geology and Environment, 1 (2020) © Sapienza Università Editrice www.ijege.uniroma1.it 21Z. TARAWNEH, N. HADADIN & E. TARAWNEH
November 2004 and the 16th of December 2003, respectively, in the upstream region of the Wala catchment due to short time
and about 24% of events were 2 days floods (Fig. 6). In intense rainfall storm. To mitigate the effect of possible future
general, 64% of flow (flood) events were of 2 days duration or flash floods in the Wala catchment, this study recommends the
less, the single day events were common occurring mostly in application of afforestation combined with proper counter
November and December, i.e. during the shift from the rainy to terracing scheme. The majority of sub-basins upstream the
the non rainy season. The same conclusion about the flow Wala catchment can be planted with proper type of trees (Olive
(flood) duration distribution has been found after analyzing the treesare good candidates) that best fit the region climate.
long series of synthetic flows and using the theoretical Besides the socio-economic aspects of planting olive trees and
modeling, i.e Equation 4. the conservation of soil due to an appropriate terracing,
In general, the past daily flows generated in the Wala planting the upper sub-basins of the Wala catchment will affect
catchment followed the pattern of winter storms in which the the rainfall-runoff process causing substantial reduction in the
region of central Jordan has experienced (mostly storms of 2 peak magnitude of the flash flood.The combined effect of the
days or less). increased infiltrated water and the increased sub-basins time of
The analysis of the long synthetic flows series showed the concentration, due to the plant interception and slope reduction,
possible occurrence of several extreme flood events of will attenuate the peakflow during flash floods. AL-WESHAH
magnitude much larger than the devastating 10th of November &EL-KHOURY (1999) has reported a reduction of 27 – 50% in the
2018 flash flood of 10.368MCM/day. The largest possible flood peakflow in Petra region due to afforestation scenario
extreme flood from the analysis of the Wala simulated daily only, while a reduction of 50 – 80% was achieved when
flows has the magnitude of 14.65MCM/day. After the analysis afforestation is combined with proper terracing.
of the simulated flows, table 2 shows the return period and the
occurrence probability, computed using Equations 5 and 6, CONCLUSIONS
respectively, for floods that exceed the four largest historical The analysis of the Wala catchment observed, synthetic
floods in the Wala region. daily flows and results from the theoretical model indicated that
64% of floods, including extremes, were short duration events
Flood date Flood Computed Computed distributed as 40% and 24% for the single day and two days
magnitude return period occurrence events, respectively. The majority of the short duration extreme
(MCM/day) (years) probability floods occurred usually in the beginning of the rainy season,
≥ i.e. the months of November and December, due to time
10/11/2018 10.368 77.8 0.013 separated rainy storms. It has been found that the two-
23/11/2004 8.013 24.6 0.041
parameter Gamma distribution well fitted the distribution of the
03/04/2006 6.337 10.6 0.094
Wala daily flows especially for extreme (upper tail) flows
16/12/2003 6.071 9.1 0.110
which is the case of this study. Modeling of the Wala
Tab. 2 - Return period and occurrence probability of floods in the
Walacatchment computed using the simulated daily flows. intermittent daily flows by a stationary two-state simple
Markov process combined with two-parameter Gamma
On average, the 10th of November 2018 devastating flash distribution for the flow magnitude has successfully simulated
flood of magnitude 10.368MCM/day, or more, occurs once and copied the characteristics of the observed daily flow,
every 78 years with probability of 1.3%. Therefore, it can be consequently, enabled the computation of how frequent was the
concluded that such flash flood is a rare event in the Wala devastating the 10th of November 2018 flash flood. The
region. analysis showed that flash floods equal or exceed
In general, about 90% of time the Wala region is subjected 10.368MCM/day were rare events happened once every 78
to floods of magnitude of 6.337MCM/day or less. years with 1.3% probability. To mitigate the effect of future
Throughout the 2018/2019 rainy season, the Wala dam flash floods, this study recommends the application of proper
downstream the Wala catchment (Fig. 3) was over flooded 5 afforestation combined with counter terracing scheme in the
times. Currently, there are reconstructions to enlarge the dam upper regions in the Wala catchment. Such mitigation measures
storage capacity from 9MCM to about 26MCM to capture the enhance the infiltration process and increase the catchment
most of winter floods for water supply enhancement. However, time of concentration, consequently, the flash flood peakflow
the 10th of November 2018 devastating flash flood has occurred will be attenuated.
REFERENCES
ALABYAN A., BELIKOV V., KRYLENKO I., FINGERT E. & FEDOROVA T. (2018) - Retrospective Simulation of an Extreme Flood on the Oka River at the
City of Ryazan and Impact Assessment of Urban and Transport Infrastructure. Water Resources, 45 (Supp. 1): 1-10.
22 Italian Journal of Engineering Geology and Environment,1 (2020) © Sapienza Università Editrice www.ijege.uniroma1.itEXTREME FLOODS IN CENTRAL JORDAN: FREQUENCY ANALYSIS
AL-WESHAH R. & EL-KHOURY F. (1999) - Flood analysis and mitigation for Petra area in Jordan. Journal of Water Resources Planning and
Management, 125 (3): 170-177.
AL-QUDAH K. (2011) - Floods as water resource and as a hazard in arid regions: a case study in southern Jordan. Jordan Journal of Civil Engineering, 5
(1): 148-161.
AKSOY H. & BAYAZIT M. (2000) - A model for daily flows of intermittent streams. Hydrological Processes, 14 (10): 1725-1744.
AKSOY H. (2003) - Markov chain-based modeling techniques for stochastic generation of daily intermittent streamflows. Advances in Water Resources,
26 (6): 663-671.
BARATTI E., MONTANARI A., CASTELLARIN A., SALINASJ., VIGLIONE A. & BEZZI A. (2012) - Estimating the flood frequency distribution at seasonal and
annual time scales. Hydrology and Earth System sciences, 16: 4651-4660.
BLUM A., ARCHFIELD S. & VOGEL R. (2017) - On the probability distribution of daily streamflow in the United States. Hydrology and Earth System
sciences, 21: 3093-3103.
BOWERS M., TUNG W. & GAO J. (2012) - On the distributions of seasonal river flows: Lognormal or power law?Water Resources Research, 48
(W05536): 1-12.
CHANDRAMOHAN K. & VIJAYA R. (2017) - Hydrologic Computations of SCS-CN, Rational, Area velocity and Tc Methods for Quantifying the Forest
Surface Water Runoff - A case study in Sirumalai hill environs of Sathiyar Reservoir, Madurai, Tamil Nadu, India. International Research Journal of
Engineering and Technology, 4 (4): 662-670.
FARHAN Y. & AYED A. (2017) - Assessment of flash-flood hazard in arid watersheds of Jordan. Journal of Geographic information System, 9: 717-751.
GAVARDASHVILI G. (2013) - Prediction of flooded territories in case of possible breakdown of the Sioni earth dam. Italian Journal of Engineering
Geology and Environment, Book series, 6: 417-423. DOI: 10.4408/IJEGE.2013-06.B-40
GEORGAKAKOS K. (1986) - A generalized stochastic hydrometeorological model for flood and flash flood forecasting: 1. Formulation. Water Resources
Research, 22 (13): 2083-2095.
KISI O., SHIRI J. & TOMBUL M. (2013) - Modeling rainfall-runoff process using soft computing techniques. Computers & Geosciences, 51: 108-117.
KOUTROULIS A. & TSANIS I. (2010) - A method for estimating flash flood peak discharge in a poorly gauged basin: Case study for the 13–14 January
1994 flood, Giofiros basin, Crete, Greece. Journal of Hydrology, 385: 150-164.
KUNDZEWICZ Z., KANAE S., SENEVIRATNE S., HANDMER J., NICHOLLS N., PEDUZZI P., MECHLER R., BOUWER L., ARNELL N., MACH K., MUIR-WOOD R.,
BRAKENRIDGE G., KRON W., BENITO G., HONDA Y., TAKAHASHI K. & SHERSTYUKOV B. (2014) - Flood risk and climate change: global and regional
perspectives. Hydrological Sciences Journal, 59 (1): 1-28.
LOPEZ-AVILES A. (2007) - Flash flooding in Spain: geomorphological approaches supporting flood frequency analysis, and the implications for the
design of structures. Water and Environment Journal, 21 (3): 217-226.
MARAGOUDAKI R. & TSAKIRIS G. (2005) - Flood mitigation planning using Promethee. European Water, 9 (19): 51-58.
MORRISON J. & SMITH J. (2002) - Stochastic modeling of flood peaks using the generalized extreme value distribution. Water Resources Research, 38(12):
1-12.
SHABANLOUS. (2014) - Calculation of Flood Hydrograph for Karun Basin by DifferentMethods. Agricultural Communications, 2 (2): 54-61.
SMITHERS J. (2012) - Methods for design flood estimation in South Africa. Water SA, 38(4): 633-646.
STONEVIČIUS E. & VALIUŠKEVIČIUS G. (2018) - Identification of Significant Flood Areas in Lithuania. Water Resources, 45 (1): 27-33.
TARAWNEH E., BRIDGE J. & MACDONALD N. (2016) - A pre-calibration approach to select optimum inputs for hydrological models in data-scarce
regions. Hydrology and Earth System sciences, 20: 4391 – 4407.
TODOROVIC P. & ZELENHASIC E. (1970) - A stochastic model for flood analysis. Water Resources Research, 6 (6): 1641-1648.
TSAKIRIS G., KORDALIS N. & TSAKIRIS V. (2015) - Flood double frequency analysis: 2D-Archimedean copulas vs bivariate probability distributions.
Environmental Processes, 2 (4): 705-716.
VILLARINI G., SMITH J., SERINALDI F., NTELEKOS A. & SCHWARZ U. (2012) - Analyses of extreme flooding in Austria over the period 1951–2006.
International Journal of Climatology, 32: 1178-1192.
VIVEKANANDAN N. (2014) - Comparison of probability distributions for estimation of peak flood discharge. Open Access Library Journal, 1(e498).
http://dx.doi.org/10.4236/oalib.1100498.
Received October 2019 – Accepted March 2020
Italian Journal of Engineering Geology and Environment, 1 (2020) © Sapienza Università Editrice www.ijege.uniroma1.it 23Puoi anche leggere