Assemblea Generale Annuale Ordinaria del 16 aprile 2018 Mercati e Materie Prime anno 2017
←
→
Trascrizione del contenuto della pagina
Se il tuo browser non visualizza correttamente la pagina, ti preghiamo di leggere il contenuto della pagina quaggiù
1

    Assemblea Generale Annuale Ordinaria

                                            del

                               16 aprile 2018

                           R e l a z i o n e

                     Mercati e Materie Prime

                                    anno 2017

Corso Risorgimento Nr. 7 – 13900 Biella - Italia Tel./Fax +39 015 405 818   e-mail info@iwta.it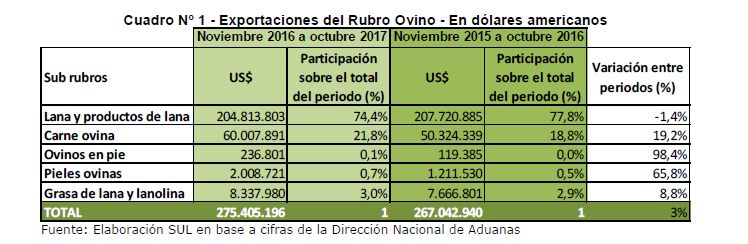
2

Cari Colleghi,

Nell’introdurre questa nostro Rapporto Annuale evidenzio come nell’anno appena passato, le
lane continuando la loro crescita, siano passate dalla prima settimana di aste a Gennaio 2017
da 1422 cents australiani/kg a 1760 ac/kg dell’ultima asta di Dicembre e a Gennaio di
quest’anno abbiano superato il muro di 1800 ac/kg.
La stagione laniera 2017/2018 prevede un incremento dell’1.4% dei volumi, quindi circa 5 mln di
kg in più rispetto alla precedente portandosi sui 345 mln di kg, grazie ai prezzi record della lana
che hanno invogliato gli allevatori ad aumentare il numero di pecore.

E’ positivo notare che in Australia è in aumento rispetto alle stagioni precedenti la percentuale
di lana classificata con la National Wool Declaration e le lane No Mulesed sono aumentate
rispetto all’anno scorso dell’1,4%; mentre le lane da pecore trattate con “pain relief” sono
cresciute del 4% in più rispetto alla stagione precedente.

La produzione totale di lana rimane pressoché stabile a circa l’1,2% della produzione mondiale
di fibre dove le altre fibre di origine animale rappresentano lo 0,1%, il cotone circa il 27,5% e le
fibre artificiali e sintetiche circa il 64% su una produzione totale poco sotto ai 97 milioni di
tonnellate e la Cina continua ad essere in assoluto il più importante acquirente, produttore e
anche consumatore di prodotti in lana in grado di creare repentine variazioni di mercato.

La lana, grazie alle sue caratteristiche, finalmente è stata riscoperta dai consumatori più
esigenti, consapevoli e attenti all’ambiente che riconoscono, oltre alle altre sue caratteristiche,
che è una fibra ecosostenibile, biodegradabile, rinnovabile, riciclabile e con un basso impatto
energetico.
La nostra Associazione è lieta di dare il benvenuto quale membro aggregato ad ASTRI,
Associazione Tessile Riciclato Italiana nata allo scopo di valorizzare il lavoro che Prato fa da
decenni, ossia quello di produrre tessuti rigenerati. Essa vuole difendere il passato e guardare
con fiducia al futuro.

Nel 2017 la nostra Associazione è stata molto attiva sia sul fronte dello sviluppo associativo
dando il benvenuto a nuovi Associati, sia sul fronte della partecipazione ad eventi in Italia e
all’estero.
Il 3 Aprile a Firenze a Palazzo Pitti abbiamo partecipato all’incontro con il Principe Carlo
d’Inghilterra, entusiasta sostenitore della lana e del suo valore per il rispetto della salvaguardia
della qualità della vita del pianeta.

Dal 3 al 5 Maggio abbiamo partecipato all’86mo Congresso IWTO ad Harrogate.

Il 27 Giugno, si è tenuta una riunione di Consiglio a Prato a cui ha partecipato una buona
delegazione di associati da Biella e dal Veneto.

Il 28 Novembre abbiamo avuto una riunione di Consiglio con cena pre natalizia.

Il 7 e 8 Dicembre abbiamo partecipato in Sud Africa a Port Elizabeth alla IWTO Wool Round
Table.

Saremo ad Hong Kong per l’87mo Congresso IWTO dal 14 al 16 Maggio 2018 e a Buenos
Aires per la Round Table il 3 e 4 Dicembre 2018.

L’88mo Congresso IWTO si terrà a Venezia dal 9 all’11 Aprile 2019.

A seguire le relazioni su tutte le Fibre e i Mercati d’Origine.

                 Corso Risorgimento Nr. 7 – 13900 Biella - Italia Tel./Fax +39 015 405 818   e-mail info@iwta.it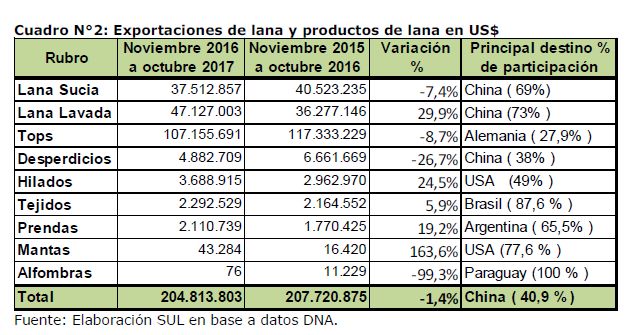
3

Dear Colleagues,

In introducing our Annual Report I would like to highlight how wool prices in 2017 have
continued their rise.
The Eastern Market Indicator increased from 1422 ac/kg, at the first week of auctions in
January 2017, to 1760 ac/kg, by the last week of auctions in December. In addition to this, it
overtook 1800 ac/kg in January of this year.
The 2017/2018 wool season forecasts an increase in volume of the wool clip of 1,4%, which
would be approximately 5 mln kg more than the previous one, reaching 345 mln kg, mainly due
to the high wool prices, which encouraged the wool growers to increase the number of sheep.

It should be noted that in Australia, the percentage of wool classified with the National Wool
Declaration is increasing season on season, and the No Mulesed wools increased by 1,4%
over the previous year. Wool from the sheep who are treated with pain relief also had an
increase of 4% compared with the last season.

The world wool production is almost stable at 1.2% of the world’s total fibre production where
other animal fibres represent 0,1%, cotton represents 27.5% and artificial and synthetics fibres
represent 64% on a total production that is close to 97 millions tons. China continues being the
largest buyer, producer and consumer of wool products and can strongly influence the market.

Wool, owing to its in natural properties, has been finally rediscovered by the knowledgable
consumer who is increasingly demanding products environmently friendly, and recognize, in
addition to its properties, its sustainability, biodegradability, renewability, recyclability and its low
manufacturing energy consumption.

Our Association is proud to welcome a new associated member : ASTRI, Italian Textile and
Recycling Association whose scope is to increase the value of what Prato has been doing for
decades, i.e. to produce regenerated textiles, safeguarding the past and looking to the future
with confidence.

During the 2017, our Association has been very active, welcoming new members, and
participating to events in Italy and abroad. On the 3rd of April we attended the meeting held in
the prestigious Sala Bianca inside Palazzo Pitti in Florence where HRH The Prince of Wales
met with the representatives from the very best Italian mills to discuss the global wool industry
and explore the latest innovations in wool.

From the 3rd to the 5th of May we attended the 86th IWTO congress in Harrogate.

On the 27th of June, many delegates from Biella and from Veneto, participated at one of our
first board meetings to be held in Prato.

On the 28th of November a board meeting was held with a pre-Christmas dinner.

On the 7th and 8th of December we participated at the IWTO Round Table in Port Elizabeth,
South Africa.

From the 14th to the 16th of May 2018 we will be in Hong Kong to attend the 87th IWTO
congress, and from the 3rd to the 4th of December 2018 we will be in Buenos Aires to
participate to the Round Table.

The 88th IWTO Congress will be held in Venice from the 9th to the 11th                                     of April 2019.

              Corso Risorgimento Nr. 7 – 13900 Biella - Italia Tel./Fax +39 015 405 818   e-mail info@iwta.it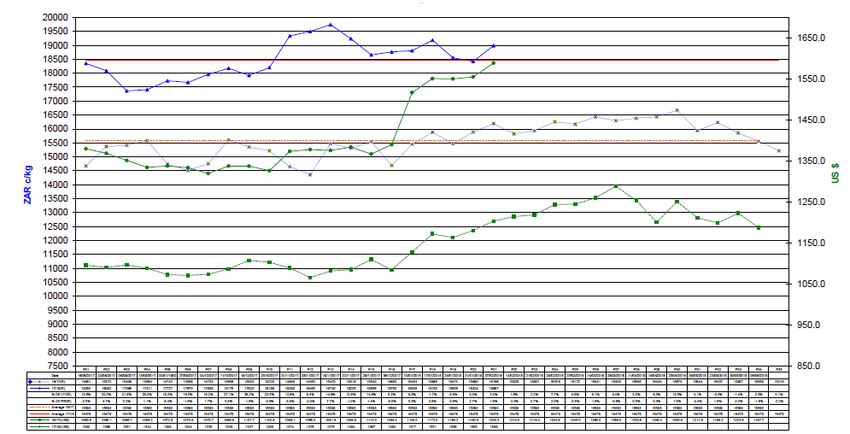
4

AUSTRALIA

Nell'anno solare 2017 il mercato delle lane australiane ha evidenziato nei primi sei mesi
(seconda metà della stagione laniera 2016/2017) una tendenza stabile con fluttuazioni del
mercato contenute (indicatore mkt da 1350 a 1500 cents/kg).
Dalla seconda metà dell'anno la tendenza dei prezzi è stata al rialzo, facendo registrare un forte
aumento in particolare per i tipi fini.

Da Gennaio a Dicembre 2017, un dato significativo, è stato l'aumento del 30% dei prezzi
registrati in AUD (Gennaio apertura asta: indice AWEX 1422 cents/kg; Dicembre: indice AWEX
1760 cents/kg 15/12/17). Con la fine della stagione 2016/2017 (metà dell'anno), il mercato ha
raggiunto il livello di 1500 cents/kg (29/06/17).

Per i compratori area euro, il dollaro australiano ha aiutato, partendo da 0.70 nella prima parte
dell’anno per poi indebolirsi fino 0.64 in Dicembre.
Per l’area euro, valuta e mercato hanno portato a un 25% di aumento dei prezzi sulle tipologie
Merinos.

Mercato completamente stravolto per l’area USD (dove si concentra il 90% delle esportazioni –
Cina/India): le oscillazioni sono andate da 0.76 di Gennaio fino 0.80 di metà Luglio per poi
riscendere a 0.75 a fine Dicembre.
Nonostante queste oscillazioni valutarie, il mercato in USD ha seguito una costante e continua
salita (vedere linea rossa).

Finalmente i prezzi delle lane super fini hanno registrato un aumento di prezzo; alla riapertura
delle aste ex Newcastle (nuova tosa e disponibilità di ottime lane) c’è stato un forte rialzo
(specialmente per le tipologie di ottima resistenza e stile).
Stabile / leggermente al rialzo la produzione di lane più fini del 19,5 mic (45% e circa lo 0,7 % in
più della passata tosa – vedere tabella sotto).

              Corso Risorgimento Nr. 7 – 13900 Biella - Italia Tel./Fax +39 015 405 818   e-mail info@iwta.it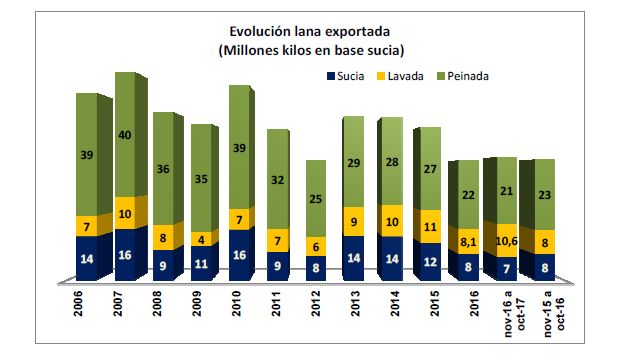
5

Gli allevatori più soddisfatti sono sicuramente quelli che producono tipologie dal 19,0/22 mic.
con prezzi molto sostenuti e con ottimi ritorni sulle lane di facile produzione grazie alla
consistente richiesta da Cina e India.
Con il lancio del modello di abbigliamento “fake fur“ per il mercato interno cinese, questi
micronaggi saranno molto richiesti, spingendo altre origini a dei livelli mai visti (Argentina/Sud
Africa).
Cambio di tendenza, dopo parecchi anni di ottimi risultati, per le lane da 24/30 mic.
Lane da tappeto in flessione (di riflesso sul mercato della Nuova Zelanda/Sud America).
Ancora molto redditizia la vendita di agnelli da carne con prezzi decisamente sostenuti.
Nel 2017 le tipologie da carda, specialmente agnelli e pezzami per produrre open tops / tops
corti e lane da carbonizzo (in particolare per il mercato cinese), hanno subito un rialzo nei primi
sei mesi, per poi aumentare bruscamente.
Buona e costante la richiesta sui classici pezzami fini da maglieria (19,5 mic).
Il mercato del cardato sembra non subire rallentamenti e crisi, anche a fronte del calo di
ordinativi da parte della Cina per le tipologie “double face”.
Si attendono novità dalla Cina.

              Corso Risorgimento Nr. 7 – 13900 Biella - Italia Tel./Fax +39 015 405 818   e-mail info@iwta.it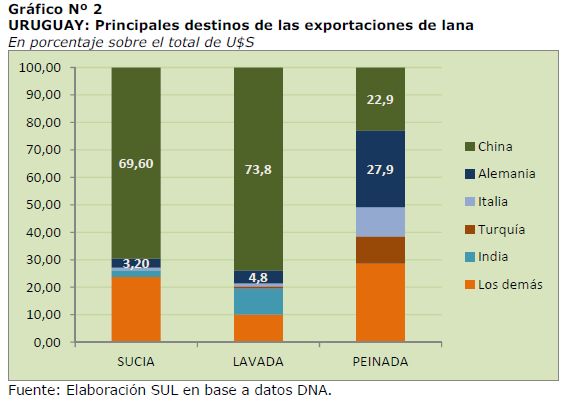
6

Per la stagione 2017/2018 si stima una produzione di 345 MKG (circa 5 mkg di più rispetto alla
scorsa stagione).

AUSTRALIA

In 2017 the australian wool market tended to be fairly stable in the first six months (second half
of wool season 2016/2017) with only small market fluctuations (market indicator from 1350 to
1500 cents / kg).
From the second half of the season the trend has been very positive and the rise in prices
(especially the fine types) has been significant.

From January to December 2017 a significant figure is the increase of 30% in prices recorded
in AUD (January opening auction: index indicator AWEX 1422 cents / kg; December 1760
AWEX indicator cents / kg 15/12/17).
At the end of the 2016/2017 season (29/06/2017) the indicator touched 1500 cents/kg .

For the buyer in euros, the weak australian dollar helped, starting from 0.70 in the first part of
the year and then dropping to 0.64 in December.
In the euro area both currency and market movement led to a 25% price increase on the
merinos types.

For the us dollar area (the biggest market - 90% of exports head to China and India), the
currency fluctuations usd/ausd have gone from 0.76 (January) to 0.80 (July) before falling back
to 0.75 (end Dicember).
Despite these currency cross rates, the market in USDollars climbed continuously(see red line).

             Corso Risorgimento Nr. 7 – 13900 Biella - Italia Tel./Fax +39 015 405 818   e-mail info@iwta.it
7
Finally, the prices of super fine wool have increased in price in the Newcastle auction (new clip
and superior wool quality). From October onwards there was a strong increase in demand
(especially for best strength and style wools).
Stable production figures for wool finer than 19.5 mic (45% of the total clip and approximately
0,7% more than the previous clip - see table below).
Corso Risorgimento Nr. 7 – 13900 Biella - Italia Tel./Fax +39 015 405 818 e-mail info@iwta.it8
The happiest woolgrowers who are producing types from 19.0 / 22 mic are receiving very good
returns on wools relatively easy to produce and under constant demand from China / India.
With the launch "fake fur" on the Chinese internal market, we will see good pressure for this
micron range, pushing wools form other origins to a level never seen before (Argentina/Cape).
Change in trend for wools from 24 to 30 micron after several years of good results.
Carpet wool prices have fallen strongly (with consequences in the wool markets of New
Zealand / South America).
The sale of lambs for meat coninuous to be profitable with very sustained prices.
In 2017 the carding types, especially lambswool for open tops/short tops and carbonised types
(especially for the Chinese market), have slightly increased in the first six months, and then
increased sharply.
Good and consistent demand on the classic good pieces for knitting (19.5 mic).
Carded market seems not to undergo any slowdown or crisis, even in the face of the decline of
orders from China for double face cloth.
Further changes likely in China.
For the season 2017/2018 the production is estimated of 345 mkg (5 million kilos more than
last season).
Corso Risorgimento Nr. 7 – 13900 Biella - Italia Tel./Fax +39 015 405 818 e-mail info@iwta.it9
NUOVA ZELANDA
Nel 2017, a causa di un forte abbassamento dei prezzi, l’ammontare delle esportazioni di lana
dalla Nuova Zelanda sono state inferiori rispetto alle previsioni di circa il 18%.
Dal momento che i principali mercati a cui si rivolgono le esportazioni di lana neozelandese
sono: l’Asia Settentrionale, guidata dalla Cina che rappresenta il 43% delle esportazioni totali e i
Paesi dell’Unione Europea (Italia, Germania, Spagna, Regno Unito…), che rappresentano un
considerevole 34%; per far fronte ai nuovi ordinativi, il mercato cinese ha iniziato ad attingere
dalle scorte della stagione precedente, invece di provvedere a nuovi acquisti. Una politica di
mercato che ha inciso notevolmente sui volumi di esportazione della Nuova Zelanda nel 2017.
Considerando le condizioni economiche generali in cui il mercato della lana opera, nel 2018 è
previsto un graduale miglioramento. Di conseguenza le stime per il 2018 sono decisamente più
positive con una previsione di crescita delle esportazioni del 16% circa, in considerazione dei
bassi livelli raggiunti dalla Cina che deve ancora trovare il giusto equilibrio tra investimenti e
consumi.
Infine, per quanto riguarda l’Europa, sicuramente il fenomeno BREXIT, ha causato notevole
incertezza ma le prospettive di crescita economiche sono comunque positive.
Infatti, malgrado l’economia inglese sia più debole di quanto ci si aspettasse, le altre grandi
economie europee hanno ottenuto risultati migliori delle aspettative, con un incremento della
domanda interna.
Alla luce di questa prospettiva globale moderatamente ottimista, la crescita economica in Nuova
Zelanda dovrebbe rimanere costante nel corso del 2018.
Corso Risorgimento Nr. 7 – 13900 Biella - Italia Tel./Fax +39 015 405 818 e-mail info@iwta.it10 Corso Risorgimento Nr. 7 – 13900 Biella - Italia Tel./Fax +39 015 405 818 e-mail info@iwta.it
11

NEW ZEALAND
In 2017, due to a strong drop in prices, the amount of wool exports from New Zealand was
lower than expected by around 18%.

Considering that the main markets for New Zealand wool exports are: Northern Asia, led by
China, which accounts for 43% of total exports and European countries (Italy, Germany, Spain,
Great Britain..), which accounts an appreciable 34%; in order to meet the new orders, the
Chinese market began to draw from the stocks of the previous season instead of making new
purchases. A market policy that significantly affected New Zealand's export volumes in 2017.

Considering the general economic conditions in which the wool market operates, a gradual
improvement is expected in 2018. Consequently, the estimates for 2018 are definitely more
positive with a forecast of growth of exports of about 16% in consideration of the low levels
reached by China that still has to find the right balance between investments and consumptions.

Finally, as far as Europe is concerned, BREXIT phenomenon has caused a considerable
uncertainty but the outlooks for an economic growth are still positive.
As a matter of fact, despite the British economy is weaker than expected, the other major
European economies have achieved better results than expected, with an increase in domestic
demand.

In light of this moderately optimistic global outlook, the economic growth in New Zealand is
expected to remain steady during 2018.

             Corso Risorgimento Nr. 7 – 13900 Biella - Italia Tel./Fax +39 015 405 818   e-mail info@iwta.it
12
SUD AFRICA
In Sud Africa, durante la prima vendita della nuova stagione (16 Agosto 2017), l’indicatore di
mercato è salito del 16% base USD rispetto alla chiusura della precedente stagione (7 Giugno
2017). Il mercato è rimasto piuttosto stabile, sempre in termini di USD, nel periodo
Agosto/Dicembre 2017, poi ha avuto un forte slancio nell’ultimo mese ed ha guadagnato un
ulteriore 15% nelle ultime 4 settimane.
Da parecchi anni ormai la produzione di lana sud africana è cresciuta in modo lento e costante.
Nella stagione 2016/17 la produzione in Sud Africa è aumentata a più di 50 milioni di kg
(malgrado l’estrema siccità a cui hanno dovuto far fronte vaste zone del Paese). Purtroppo,
questa terribile siccità è proseguita anche nella stagione 2017/18 e ne è risultato che il peso
della tosa per ciascuna pecora (peso del vello) è diminuito drasticamente e, dall’inizio dell’anno,
i magazzini dei brokers hanno ricevuto l’8% di lane in meno.
A questo punto, si prevede un calo della produzione del 5-8% per il 2017/18.
La Cina si è riconfermata anche in questa stagione il mercato dominante in Sud Africa, infatti il
70% delle esportazioni dal Sud Africa è diretto in Cina. Al 2° posto delle esportazioni c’è la
Repubblica Ceca (13%), tallonata dall’Italia in terza posizione (11%). Seguono la Germania
(1,8%), la Bulgaria (1,6%), l’India (1,5%) e l’Egitto (1,2%) come maggiori Paesi destinatari delle
esportazioni, sebbene acquistino piccoli quantitativi dal Sud Africa.
La maggiore disponibilità di lane in Sud Africa è nel periodo tra il tardo mese di Ottobre e
Gennaio, con un picco nelle offerte che raggiunge le 10.000-15.000 balle a settimana.
Durante il periodo Febbraio-Marzo, in genere le vendite si attestano su una media settimanale
di circa 9.000 balle. A partire da Aprile la quota di lana disponibile diminuisce tanto che, fino alla
fine della stagione (metà Giugno 2018), le vendite hanno luogo solo ogni 2 settimane.
Corso Risorgimento Nr. 7 – 13900 Biella - Italia Tel./Fax +39 015 405 818 e-mail info@iwta.it13
SOUTH AFRICA
In South Africa, on the first sale of the new season (16 August 2017), the market indicator was
16% dearer in USD terms than our closing sale of the previous season (7 June 2017). The
market remained fairly stable during August – December 2017 in USD terms, but then gained
strong momentum this past month and gained a further 15% during the past 4 weeks.
For several years the production of South African wool has shown slow and steady growth. For
the 2016/17 season production increased in South Africa, to over 50 million kgs (despite severe
drought conditions experienced over large parts of the country). Unfortunately during the
2017/18 season, the severe drought conditions have continued – as a direct result of the
drought, the weight shorn per sheep (fleece weights) has declined sharply and currently wool
receipts into brokers stores are down 8% year to date. Production for the 2017/18 season is
expected to be down 5-8% at this stage.
China is once again the dominant market force in the SA market this season with 70% of the
exports from South Africa being shipped to China. The second largest export destination is the
Czech Republic (13%), followed closely by Italy in third place (11%). Thereafter, Germany
(1.8%), Bulgaria (1.6%), India (1.5%) and Egypt (1.2%) are the next largest export destinations,
but purchase small quantities from South Africa.
The peak of the wool offering in South Africa is during the late October – January period, when
the offerings range between 10,000 – 15,000 bales per week. During the February - March
period approximately the sales normally average around 9000 bales per week. WEF April, the
wool available for sale decreases, resulting in wool sales being held every 2 weeks until the end
of the season (mid June 2018)
Corso Risorgimento Nr. 7 – 13900 Biella - Italia Tel./Fax +39 015 405 818 e-mail info@iwta.it14
ARGENTINA
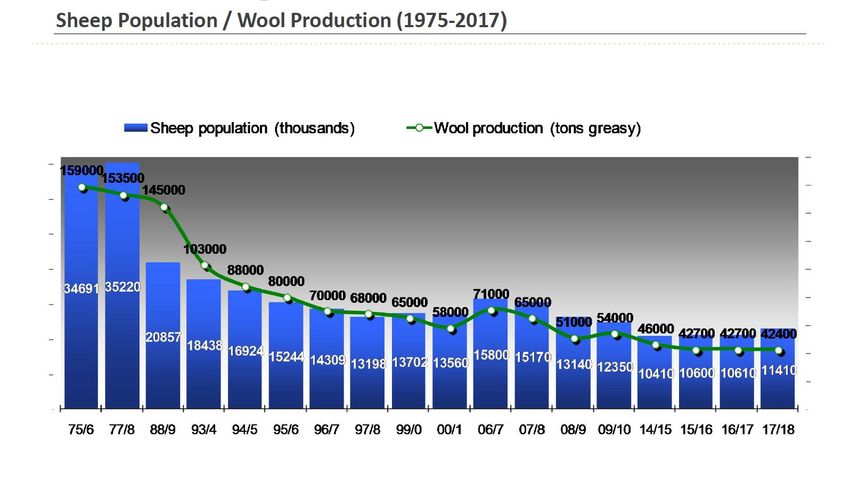
La stima di produzione per la stagione 2017/2018 ha evidenziato un quantitativo totale di
produzione pari a 42.400 tonnellate in leggera flessione rispetto alle 42.700 tonnellate dell'anno
precedente. In aumento invece il numero di capi che passa da 10,4 milioni a 11,6 milioni.
ARGENTINA
Production (greasy)
Production estimation for the 2017/2018 season shows a total of 42.400 tons in the production
of greasy wool, down from 42.700 tons in 2016/2017. On the other hand the number of sheep
increased from 10.6 millions to 11.4 millions.
Corso Risorgimento Nr. 7 – 13900 Biella - Italia Tel./Fax +39 015 405 818 e-mail info@iwta.it15
URUGUAY
Da Novembre 2016 a Ottobre 2017 l'esportazione dei principali prodotti ottenuti dall'allevamento
ovino (lana e sottoprodotti, carne ovina, pelli di pecora, pecore vive e grasso di lana e lanolina)
ha raggiunto un valore pari a 275 milioni di dollari; tale importo rappresenta un aumento del 3%
rispetto allo stesso periodo dell'anno precedente, secondo i dati del"exportaciones cumplidas" e
comparati con il Secretariado Uruguayo de la Lana (S.U.L.) por la Dirección Nacional de
Aduanas.
Questi dati comprendono le importazioni del prodotto.
.
Il 74.4% delle vendite all'estero dei prodotti ovini corrisponde a lana e derivati della lana e
ammontano a 204 milioni di dollari, registrando un calo dell’1.4%, rispetto al periodo Novembre
2015 - Ottobre 2016.
Nell’analizzare le esportazioni degli altri elementi che compongono l'allevamento ovino, si
osserva che l’esportazione di carne di pecora totalizza 60 milioni di dollari, evidenziando un
aumento del 19.2%; l'esportazione delle pelli di pecora ammonta a 2 milioni di dollari,
aumentando del 65%. L’esportazione delle pecore vive ammonta a US$ 236.801, l’esportazione
relativa al grasso di lana e lanolina è aumentata dell’8.8% rispetto allo stesso periodo
precedente (8.3 milioni di dollari).
Esportazioni di lana e sottoprodotti
In termini di volume fisico nel corso del periodo considerato l'Uruguay ha esportato un totale di
39.1 milioni di chili di lana base grezza (considerando lana grezza, lavata e pettinata), 2% in più
rispetto allo stesso periodo precedente.
Il 54,7% della lana è stato esportato come lana pettinata, il 18.8% lana base grezza e il restante
come lana lavata.
Rispetto allo stesso periodo dell’anno precedente, il volume delle vendite all’estero è diminuito
del 11% per la lana grezza, del 5% per la lana pettinata, ma ha registrato un aumento del
35.2% per la lana lavata.
Corso Risorgimento Nr. 7 – 13900 Biella - Italia Tel./Fax +39 015 405 818 e-mail info@iwta.it16
Destinazioni principali
Sono state 30 le destinazioni principali per le vendite all'estero di lana e sottoprodotti nel
periodo considerato. Analizzando in termini di valore le esportazioni di lana grezza, lavata e
pettinata, si registra un calo dell’1.2% rispetto al periodo precedente, per un totale di 192 milioni
di dollari.
La destinazione principale in termini di valore delle esportazioni per questo gruppo di prodotti è
rimasta la Cina, con 44.25% del totale. A seguire troviamo Germania (17.4% del totale), Italia
(6.4%), Turchia (5.7%), Bulgaria (3.1%), India (2.8%), Messico (2.1%) e Brasile (2%).
La Cina ha acquistato il 70% del totale della lana grezza, seguita da Bulgaria con il 9% ed
Egitto (6.8%). In questa sottocategoria e rispetto allo stesso periodo precedente, si osserva un
calo del guadagno in valuta estera che è pari al 7.4% (totale del periodo 37.5 milioni di dollari).
Per quanto riguarda la lana lavata le percentuali sono le seguenti: Cina 74 %, seguita da India
(9%), Germania (4%), Brasile (3.3%). In questa categoria la destinazione più importante è stata
la Cina, che ha aumentato i propri acquisti, in termine di valore, del 52%. Rispetto allo stesso
periodo dell’anno precedente, l’aumento registrato è stato del 29.9%,raggiungendo 47 milioni di
dollari.
Per quanto riguarda la lana pettinata, i maggiori acquirenti del periodo considerato sono:
Germania con il 30% del totale (29.8 milioni di dollari) registrando un incremento del 2.7%
rispetto allo stesso periodo precedente, seguita per importanza dalla Cina (22,9%) che registra
un calo del 7%, l’Italia (10,7%) con un calo del 12% e la Turchia (9.9%) che incrementa le
importazioni in termini di valore del 9%.
Rispetto allo stesso periodo precedente le esportazioni sono diminuite dell’8.7%.
Corso Risorgimento Nr. 7 – 13900 Biella - Italia Tel./Fax +39 015 405 818 e-mail info@iwta.it17
Proventi in valuta estera per prodotto
Quando si esegue l'analisi dei diversi fattori che compongono l'esportazione di lana e
sottoprodotti, si osservano le diverse varianti che si verificano nelle vendite. Quasi tutte le
categorie hanno registrato un calo nelle vendite all'estero rispetto all’anno precedente.
Corso Risorgimento Nr. 7 – 13900 Biella - Italia Tel./Fax +39 015 405 818 e-mail info@iwta.it18
URUGUAY
During the period November 2016 -October 2017 exports of main products obtained by sheep
farming (wool and by-products, sheep meat, sheepskins, live sheep for export, wool wax and
lanolin) reached a value of 275 million dollars; This amount represents an increase of 3%
compared with the same period of the previous year, as per the last data of the "exportaciones
cumplidas" and compared with the Secretariado Uruguayo de la Lana (S.U.L.) por la Dirección
Nacional de Aduanas. Data include imports of the product.
74.4% of exports of the products obtained by sheep farming is about wool and wool derivatives
with the total amount of 204 million dollars and a decrease of 1.4%, if compared with the same
season November 2015 - October 2016. Analysing the exports of other elements that make up
the sheep farming, it is observed that the export of sheep meat reaches 60 million dollars,
showing a growth of 19.2%. Exports of sheepskins also registered an increase of 65% with total
amount of 2 million dollars. Exports of live sheep increased too, for a total of $ 236.801, and
exports of wool grease and lanolin increase of 8.8% (8.3 million dollars), compared to the same
period of the previous year.
Wool and by-products exports
In terms of volume during the period considered Uruguay exported a total of 39.1 million Kg of
greasy wool (considering more precisely greasy wool, clean wool and combed wool), which
represents 2% more than the same period of the previous year. 54.7% of the whole wool was
exported as combed wool, 18.8% as greasy basis, and the remaining as clean wool.
The volume of exports decreased by 11% referring to greasy wool, by 5% referring to clean
wool, although an increase has been registered for the combed wool, 35.2%.
Corso Risorgimento Nr. 7 – 13900 Biella - Italia Tel./Fax +39 015 405 818 e-mail info@iwta.it19
Wool exports: destination breakdown
During November 2016 -October 2017 there have been 30 destinations for the export wool and
by-products. In value terms, exports (greasy wool, clean and combed wool) registered a
reduction of 1.2% over the previous period, for a total of 192 million dollars.
The leading country remains China, with 44.5% of total imports, followed by Germany (17.4% of
the total), Italy (6.4%), Turkey (5.7%), Bulgaria (3.1%), India (2.8%), México (2.1%)and Brazil
(2.0%).
China bought 70% of the total greasy wool, followed by Bulgaria with 9% and Egypt with 6.8%.
In this sub-category, and always compared to the same period of 2015/2016, there has been a
decline in the foreign exchange value gain, that corresponds at 7.4% (total for the period: 37.5
million dollars).
As for scoured wool, the percentages are the following: China 74%, followed by India (9%),
Germany (4%) and Brazil (3.3%). In this category, the most important destination was China
that increased its purchases (52%). Compared to the same period of 2015/2016, exports
increased to 47 million dollars, 29.9% more than in the previous period.
Regarding wool tops, Germany remains the main buyer acquiring 30% of the total (US$ 29.8
million) registering a rise of 2.7% on the same period of the previous year, followed in
importance by China (22.9%) which decreased its purchases by 7%, Italy (10.7%) that
decreased its purchases 12% and Turkey (9.9%) that increased its imports in terms of value by
9%.
Compared to the same period of 2015/2016, exports decreased by 8.7%.
Corso Risorgimento Nr. 7 – 13900 Biella - Italia Tel./Fax +39 015 405 818 e-mail info@iwta.it20
Foreign currency incomes: products breakdown
Studying all different factors that make up exports of wool and by-products, it is useful to
observe all variations that occur in sales in general. Almost all categories registered a decline in
exports over the previous year, 2015/2016.
Corso Risorgimento Nr. 7 – 13900 Biella - Italia Tel./Fax +39 015 405 818 e-mail info@iwta.it21
CILE
Un inverno mite e una primavera/estate con più piogge sono stati favorevoli per i contadini nella
Regione del Magallanes.
Significativamente maggiore il numero degli agnelli rispetto ai due anni precedenti. Si attende
un aumento del numero delle pecore grazie ai migliori pascoli che si rifletterà in un incremento
della produzione di lana dalla prossima stagione. La stima della produzione di lana per la
stagione 2017/18 è di 5,8 milioni di chili (base sucido), in leggero aumento (+ 1,5 / 2%) rispetto
al 2016/2017.
Basandoci sui risultati dei core test, si nota che la lana merino è leggermente più fine mentre i
Corriedale sono appena più ordinari a causa dei migliori pascoli. Il micronaggio medio è stimato
pressoché identico alla scorsa stagione = tra 26-26,5 my.
Il mercato della lana è stato molto attivo, specialmente su tipi più fini. I prezzi ottenuti dagli
allevatori per la lana merino sono stati a livelli record.
Alla fine di Febbraio 2018 il 73% della lana era già stata venduta, la lana rimanente (tosa di fine
stagione) ci si aspetta venga acquistata non appena arriveranno i risultati dei core test.
La pettinatura locale continua ad essere il compratore principale in Cile, seguito dalla Cina.
Nessuna altra destinazione per l'esportazione di lana è stata registrata per questa stagione.
CHILE
A mild winter and higher rain fall in spring and summer have been welcome news for the
Magallanes farmers.
Lamb weights are significantly higher than the previous 2 years. We would expect an increase
in sheep stock due to more grass on the land which will reflect in an increase in wool production
from next season on. The estimated wool production for 2017/18 season is 5.8 million kilos
(greasy basis), a slight increase (+1.5/2%) compared to 2016/2017.
Based on core test results, we have seen merino wool move slightly finer and corriedale wools
a touch coarser, due to the better pastures/grass growth. The average micron we estimate with
no significant change is between 26-26.5mic.
The wool market has been very active, especially on finer types. The prices obtained by farmers
for merino wool have been at record levels.
At the end of February 2018 73% of the wool has been sold with the remaining wool expected
to be sold as soon as core test certificates are received for wool shorn late in the season.
Local combing mill continue to be the largest buyer in Chile, followed by China. No other
destination for wool export has been recorded for this season.
Corso Risorgimento Nr. 7 – 13900 Biella - Italia Tel./Fax +39 015 405 818 e-mail info@iwta.it22
LANE BRITANNICHE E EUROPEE
Il mercato britannico della lana ha visto un calo dei prezzi negli ultimi 12 mesi e per la prima volta
in molti anni i valori della lana sono in linea con quelli della Nuova Zelanda. Il mercato globale
negli ultimi 12 mesi è stato impegnativo e ha registrato una riduzione della domanda di lane
incrociate. Si tratta di lane che nel Regno Unito come in Nuova Zelanda sono prodotte in volumi
significativi e questo si è riflesso nei prezzi pagati nelle aste di lana britanniche. Altre lane
europee incrociate, come sempre, sono costrette a seguire il mercato, come le lane di pecora da
latte di bassa qualità che arrivano al “cancello della fattoria” con prezzi di vendita irrisori per
l’allevatore. I problemi relativi alla Brexit hanno causato la svalutazione della sterlina nel 2016,
con un beneficio minimo o nullo verso l'agricoltore britannico, poiché in quel momento non c’era
domanda per la lana. Alcuni economisti prevedono l’aumento della sterlina contro l'euro dopo la
Brexit, altri ne prevedono la parità 1 a 1. Tipico delle previsioni economiche, di nessuna utilità per
il mondo rurale.
Le lane merino europee hanno registrato molto più interesse nei vari mercati ed è essenziale che
le varie istituzioni governative riconoscano che ci sono opportunità per migliorare notevolmente la
qualità della lana investendo nelle migliori pratiche all’interno della fattoria. Ciò può avere un
effetto positivo sull'intera produzione di lana europea, con benefici per l'ambiente, l'agricoltore,
l'industria e il consumatore.
La lana in generale è probabilmente all'inizio di un periodo di crescita a lungo termine dato che le
fibre naturali stanno tornando alla ribalta. La contaminazione delle materie plastiche è un
problema quotidiano e anche se siamo pienamente consapevoli che la vita moderna non può
farne a meno, l’alternativa naturale, rinnovabile e sostenibile non è solo uno slogan, ma deve
diventare uno stile di vita. Esistono molti settori, come quello per l’imbottitura di divani/materassi
ecc, che potrebbero trarre grandi vantaggi dall'utilizzo di lana di valore inferiore anziché di miscele
sintetiche. Molte lane non sono adatte a causa della cattiva gestione del gregge, provocata da
decenni di bassi prezzi di vendita e da costi sempre crescenti di tosa e trasporto. Si prevede che
diversi paesi europei dovranno organizzare programmi di gestione della lana nazionali,
trasformando la lana sucida in un prodotto apprezzato dal consumatore finale. Tuttavia l'Italia
deve muoversi rapidamente per competere con la lana proveniente da altre origini europee,
altrimenti continuerà a essere considerata fornitore di lane solo di qualità inferiore.
Corso Risorgimento Nr. 7 – 13900 Biella - Italia Tel./Fax +39 015 405 818 e-mail info@iwta.it23
BRITISH AND EUROPEAN WOOL
The British wool market has seen decline in prices over the last 12 months, with wool values now
in line with New Zealand for the first time in many years. The global market over the last 12
months has been challenging and there has been a reduced demand for crossbred wools. These
are wools which both the UK and New Zealand produce in significant volumes and this has been
reflected in the prices paid at British Wool auctions. Other European crossbred wools, as always,
are forced to follow the market, with the lower milk sheep wools having very little value at all at the
farm gate. Brexit issues caused the devaluation in the pounds in 2016, with little or no benefit
spilling through to the British farmer, as the demand for the wool was just not there. Some
economists see the pound increasing against the euro post Brexit, others see parity 1 to 1 against
the euro. Typical of economic predictions and of no use whatsoever.
European merino wools have had much more interest from various markets and it is essential that
the various governmental institutions recognize that there are opportunities to greatly improve the
quality of the wool by investing in best practice on the farm. This can only have a positive effect
on the whole European wool production, with benefits for the environment, the farmer, the
industry and the consumer.
Wool in general is possibly at the very beginning of a long term growth period as natural fibres are
coming to the fore. Plastics contamination is a daily issue and although we are fully aware that it
is essential to modern living, surely natural, renewable and sustainable is not only a slogan, but it
can be a way of life. There are many sectors, such as fillings for furniture, that could greatly
benefit from the use of lower value wool rather than synthetic blends. But many wools are not
suitable due to poor flock management, caused by decades of low sales prices and increasing
shearing and transport costs. It is felt that several European countries should organize national
wool programs, transforming the greasy wool from an environmental problem into a valued
product to be appreciated by the final consumer. However Italy has to move quickly and
constructively to compete with wool from other European origins, otherwise it will always be
considered a supplier of inferior quality wools.
Corso Risorgimento Nr. 7 – 13900 Biella - Italia Tel./Fax +39 015 405 818 e-mail info@iwta.it24
MERCATO DELLE FIBRE SPECIALI
CASHMERE
Cina
Nonostante abbia avuto una produzione inferiore nel 2017, la Cina si conferma come il più
grande produttore ed esportatore di cashmere al mondo. La Cina inoltre è di molto il più grande
importatore di cashmere sucido e lavato dalle altre origini (Mongolia, Iran, Afghanistan) per oltre
il 90% dei volumi disponibili.
All’inizio di febbraio 2017, dopo il Capodanno cinese, il cashmere ha affrontato cospicui e
costanti aumenti di prezzo, principalmente per la crescente domanda da parte delle filature.
Poiché all’inizio della stagione importanti quantità di cashmere cinese sono state portate in
Italia, i filatori cinesi hanno dovuto reperire il sucido direttamente dai pastori per assicurarsi il
cashmere a loro necessario, di fatto causando ingenti diminuzioni dello stock di materia prima e
un conseguente rapido aumento dei prezzi.
Nel 2017 si è anche assistito a continui acquisti da parte di compratori cinesi in Iran e in
Afghanistan; il cashmere proveniente da queste aree è largamente utilizzato in tessitura e in
parte in maglieria per produrre stoffe, sciarpe e maglie a basso costo.
Nella seconda metà dell’anno il mercato è stato piuttosto attivo in Cina, i prezzi hanno subito un
costante aumento di circa il 10% per i tipi di buona lunghezza e del 20% per i tipi di media
lunghezza.
Mongolia
La nuova stagione è iniziata il 20 marzo 2017 e già all’inizio di aprile già l’80% del cashmere
sucido della Mongolia orientale era stato venduto. Rispetto al 2016, all’inizio della stagione i
prezzi erano superiori di circa il 10%.
La gran parte del cashmere è stato acquistato dai cinesi, c’è comunque stata una buona attività
dei compratori italiani.
La produzione totale di cashmere sucido in Mongolia è stata di circa 10'000 tonnellate nel 2017,
di cui circa l’80% è stato importato dai cinesi, un 10% esportato verso gli altri paesi ed il
rimanente 10% è rimasto in Mongolia per la produzione di prodotti finiti. Per quanto riguarda il
cashmere dejarrato invece il maggiore importatore è stata l’Italia (450 tons), seguita con volumi
inferiori da Cina (31 tons), Inghilterra (28 tons), Germania (18 tons) e India (11 tons).
La nuova tosa era già terminata in Giugno, con l’eccezione di poche regioni.
Per via di un’annata molto arida e secca, con l’assenza di piogge, c’è il rischio che il foraggio
non sia sufficiente per nutrire le capre durante l’inverno. Per questo motivo molti pastori stanno
prendendo in considerazione l’ipotesi di ridurre il numero dei capi nei loro greggi.
Nel 2017 i cinesi hanno confermato di avere quasi totalmente il monopolio del mercato in
Mongolia e sono quindi in grado di stabilire il prezzo del cashmere sucido e dejarrato. La
debolezza finanziaria spesso non permette alle aziende mongole di avere una forza economica
tale da competere con i players cinesi.
Inoltre quest’anno i compratori inglesi hanno ridotto drasticamente le loro importazioni di
cashmere dejarrato mongolo passando da 55 tonnellate nel 2016 a 28 tonnellate nel 2017.
Corso Risorgimento Nr. 7 – 13900 Biella - Italia Tel./Fax +39 015 405 818 e-mail info@iwta.it25
Iran
Il mercato Iraniano del cashmere si è dimostrato molto instabile nel 2017 rispetto all’anno
precedente. Nel 2016 infatti non si sono verificate significative oscillazioni di prezzo e questo
dovuto al fatto che i cinesi, che avevano comprato grandi volumi in Iran nel 2015, hanno avuto
perdite importanti a causa del crollo dei prezzi a livello internazionale quando dovettero vendere
nel 2016. Questa la ragione per la quale sono stati assenti dal mercato, garantendo una relativa
calma, nel 2016.
Ma con l’aumento dei prezzi nel mercato internazionale ad iniziare dall’estate 2017, i cinesi
sono riapparsi in maniera decisa e questa volta i traders afghani ne hanno approfittato per
importare cashmere iraniano in Afghanistan e rivenderlo sul mercato cinese.
Questo ha portato ad un aumento dei prezzi di circa il 45% in Iran, che è stato parzialmente
compensato dal deprezzamento della moneta locale (Rial) nei confronti del dollaro americano,
causando un effettivo aumento sul mercato del 30%. Si tratta di una fortissima escursione dei
prezzi se comparata alle quotazioni del cashmere nel resto del mondo dove l’aumento è stato
“solo” del 15%.
Ci sono altri due effetti collaterali per la ricomparsa dei cinesi nel mercato iraniano: innanzitutto
il peggioramento della qualità, dato che i cinesi hanno comprato grosse quantità in brevi periodi,
i commercianti hanno voluto approfittare della situazione mischiando qualità inferiori e di minor
prezzo con le tipologie standard. Il secondo problema è che il prezzo della nuova stagione che
inizierà ad aprile, si baserà di partenza su questi prezzi elevati e se il mercato internazionale
assisterà ad un ulteriore aumento dei prezzi, allora anche la materia prima in Iran vedrà i suoi
prezzi schizzare ancora più in alto.
SPECIAL FIBERS MARKET
CASHMERE
China
Inspite of it’s lower production level in 2017, China remains the largest producer, processor
and exporter of cashmere in the world.
China is also by far the biggest importer of greasy and scoured cashmere from other origins
(Mongolia, Iran , Afghanistan,..) accounting for over 90% of the volume.
The Chinese cashmere market faced consistent price increases at the very beginning of
February 2017, after the Chinese New Year. This was mainly because of a bigger demand of
cashmere from spinners. As large quantities of Chinese cashmere had been delivered to Italy
for consignment at the beginning of the season, Chinese spinners had to collect greasy
cashmere directly from grasslands, causing a massive reduction of greasy stock and
consequential rapid price increases.
In 2017 we also witnessed continuous purchases in Iran and in Afghanistan by Chinese buyers;
cashmere coming from this area has been largely used in weaving and knitting manufacturing,
e.g. woven fabrics, scarves and some low-price sweaters.
In the second half of 2017 the market has been quite active in China. Prices have faced a slow
but continue increase of about 10% for the longer types and about 20% for the those of medium
length.
Corso Risorgimento Nr. 7 – 13900 Biella - Italia Tel./Fax +39 015 405 818 e-mail info@iwta.it26
Mongolia
The new season opened on the 20th of March and by the very beginning of April almost 80% of
greasy cashmere from East Mongolia was already sold. In comparison with the 2016 season,
prices had increased by almost 10%. Most of the cashmere was bought by Chinese buyers but
the Italians were also active.
The total production in Mongolia is about 10.000 tons of raw cashmere, with China importing
about 80% of total production, 10% being exported to other countries and the remaining 10%
has remained in Mongolia for the manufacturing of finished products. The main importers of
dehaired cashmere for 2017 have been: Italy (450 tons),China (31 tons),England (28 tons),
Germany (18 tons) and India (11 tons).
The new clip was already sold by June, with the exception of few regions.
Due to a very dry and arid year, due to the lack of rain, there will be a big risk this winter that
there won’t be enough forage . That’s why breeders have taken into consideration the
opportunity to reduce livestock numbers.
In 2017 Chinese basically confirmed they have the monopoly on the Mongolian market, and
they are thus able to set the prices on both the greasy and the dehaired cashmere. Due to
financial weakness, Mongolian plants often don’t have enough economic strength to compete
with the Chinese .
This year English buyers have reduced drastically their importation of dehaired cashmere from
Mongolia, passing from 55 tons in 2016 to 28 tons in 2017.
Iran
The local market of Iranian cashmere in 2017 was, unlike 2016, very volatile. In 2016, there
were almost no significant price changes throughout the year and this was mainly because in
the previous year (2015) the Chinese had bought large quantities in Iran. Subsequently they
suffered big losses due to international price falls when selling in 2016 and the Chinese were
fairly absent from trading and the market was generally calm.
With price increases in the international market starting from summer in 2017, suddenly the
Chinese emerged again and this time Afghans took the opportunity to import Iranian cashmere
to Afghanistan and then sell on to the Chinese market.
This resulted in a price increase of around 45% in Iran, which was partially compensated by
local money depreciation against US dollar and the actual effective price increase in hard
currency which was about 30%. This is an incredible price hike when it is compared to
cashmere fibre prices in the world which experienced “only” a 15% increase.
There are two more side effects of China’s return to the Iranian market. Firstly, one is a drop
in quality because the Chinese bought large quantities in short periods of time and traders
wanted to profit from this by mixing inferior cheaper qualities into the standard ones and sell as
standard. The second problem is the price of new clip which in April, that it will be set at high
prices and if world market prices tend to increase, then raw material in Iran will increase even
more.
Corso Risorgimento Nr. 7 – 13900 Biella - Italia Tel./Fax +39 015 405 818 e-mail info@iwta.it27
ALPACA
Quest’anno è stato eccezionale per l’Alpaca. A causa di un importante aumento nei consumi in
Asia, la Cina è stata in modo evidente il più grande compratore, addirittura triplicando le
importazioni nel 2017. Come risultato si sono avuti aumenti del 25-30% che hanno coinvolto
tutte le tipologie, dal Baby agli Adulti. Già in Luglio la domanda era aumentata notevolmente,
con la Cina e la Turchia che facevano da apripista. L’Italia ha seguito più tardi, a partire da
Settembre, e la domanda è continuata durante il resto dell’anno.
Alla fine del 2017 la richiesta superava ancora l’offerta e le scorte hanno raggiunto un livello
molto basso. I produttori nei paesi d’origine hanno avuto difficoltà a reperire le materie prime e
le pettinature hanno lavoro per diversi mesi.
Le destinazioni dell’esportazioni dal Perù sono state le seguenti:
2016 2017
Cina 1244t 3326t
Italia 1012t 1059t
Gran Bretagna 78t 86t
Giappone 65t 71t
Corea 161t 55t
Altri 202t 150t
Totale 2762t 4747t
Sulla base di una tosa invariata di circa 8 milioni di chili di sucido,equivalente a 6 milioni di
pettinato, il consumo domestico è diminuito notevolmente favorendo le esportazioni per la Cina.
La domanda per le tipologie Suri è stata abbastanza buona ma gli aumenti sono arrivati solo
successivamente rispetto alle altre tipologie di Alpaca.
L’esportazione di filato di Alpaca è diminuito del 30% a 908t contro 1264t nel 2016. La Norvegia
come al solito è prima con 240t seguita dall’Italia con 120t, gli Stati Uniti con 103t, la Svezia con
96t, poi la Corea con 49t, la Germania con 40t ed altri con 260t.
Fare previsioni per il 2018 è ora più difficile ma sembra che la domanda per l’Alpaca debba
rimanere forte anche per la prossima stagione. Il valore rispetto alle altre fibre è di grande
vantaggio e inevitabilmente metterà questa bella fibra in risalto .
Corso Risorgimento Nr. 7 – 13900 Biella - Italia Tel./Fax +39 015 405 818 e-mail info@iwta.it28
ALPACA
This year has been quite exceptional for Alpaca. Generated by a sharp increase in consumption
in Asia, China has been by far the principal operator, tripling the imports in this period. As a
result, prices have increased by 25-30% on all types from Baby to Adult. Already in July there
was a significant improvement in the demand with China and Turkey leading the way. Italy
followed, slightly later, in September and the demand has continued throughout the year. At the
end of 2017 demand was still outstripping the offering and stocks world wide have reached very
low levels. Early stage processors have had difficulties in sourcing sufficient raw material and
the combing mills are busy for many months ahead.
The destinations for exports for 2017 were as follows:
2016 2017
China: 1244t 3326t
Italy: 1012t 1059t
UK: 78t 86t
Japan: 65t 71t
Korea: 161t 55t
Others: 202t 150t
Total: 2762t 4747t
Given an unchanged clip of approx. 8 million kgs converted into 6 million kgs of tops domestic
consumption has decreased considerably in the face of higher exports to China.
Suri types have enjoyed a reasonable level of demand but became dearer after Huacaya price
increased.
Alpaca yarn exports decreased by 30% to 908t against 1264t in 2016. Norway as usual was first
with 240t followed by Italy with 120t, United States with 103t, Sweden with 96t, then Korea with
49t, Germany with 40t and others with 260t.
Making a forecast for 2018 is now more difficult but it looks like the Alpaca fibre will remain in
strong demand for the coming season as well. The relative value compared to other fibres is of
great advantage and will inevitably place this beautiful fiber in focus.
Corso Risorgimento Nr. 7 – 13900 Biella - Italia Tel./Fax +39 015 405 818 e-mail info@iwta.it29
SETA
Pettinati Mulberry
Nel primo quadrimestre abbiamo assistito ad aumenti principalmente a causa di mancanza di
kibiso di qualità. Ad inasprire la situazione, terminate le vacanze del Capodanno cinese (2017),
sono stati molti gli operai specializzati che non sono ritornati dai loro villaggi d’origine tanto che
alcune aziende hanno dovuto anche ridurre la produzione.
A maggio un calo della domanda sia europea che da parte del mercato domestico, ha
stabilizzato i prezzi. I rialzi sono ripartiti durante l’estate trainati da un costante interesse del
mercato cinese per la produzione di quilt e da una maggiore richiesta dei filati di seta atti a
sostituire, laddove possibile, la bava continua che ha avuto rialzi di prezzo molto forti.
Due fattori ulteriori hanno reso più complesso quest’anno: più speculazione e la valuta locale
che si è sempre più rafforzata sul dollaro USA. Altrettanto però calmierato dal cambio
USD/EURO, utile compensatore di un mercato altrimenti ancora più instabile.
Pettinati Tussah
Eredi di un forte aumento dei prezzi a fine 2016, nel 2017 abbiamo assistito ad una domanda
generalmente costante affiancata da lievi rincari osservati in particolare sugli ultimi mesi
dell’anno, ma contenuti sul mercato europeo dal mercato valutario definendo stabilità nei prezzi.
SILK
Tops Mulberry
In the first quarter increases were mainly due to the lack of good quality kibiso.
After the Chinese New Year (2017) the situation worsened when many specialized workers did
not return from their villages to the mill, to such an extent that some companies had to reduce
their production.
In May, a fall in both European and domestic demand stabilized prices. Increases started again
during the Summer led by a constant interest of the Chinese market for the quilts production
and by a stronger request of silk yarns to replace, where possible, silk filaments that had
consistent price increases.
2017 has been a complex year due to two further issues: more speculation and the constant
strengthening of the local currency against the US dollars whilst USD/EURO exchange rates
have been able to compensate this very unsteady market.
Tops Tussah
After strong price increases at the end of 2016, in 2017 we have generally seen a steady
demand with small rises in price especially during the last part of the year but which didn't
influence the European market because currencies compensated for them.
Corso Risorgimento Nr. 7 – 13900 Biella - Italia Tel./Fax +39 015 405 818 e-mail info@iwta.it30
SILK MATERIALS EXPORT STRUCTURE IN 2017
YEAR-ON- YEAR AMOUNT(10 YEAR- ON- YEAR
DESCRIPTION QUANTITY (KG)
(%) THOUSAND USD) (%)
SILK (A+B) 11.667.725,00 -11,53 54.487,93 2,96
A、LONG FIBRE 7.565.820,00 -14,52 42.364,90 2,47
B、SHORT FIBER (1+2+3) 4.101.905,00 -5,43 12.123,03 4,72
1、WASTE (TOP/SLIVER+NOILS) 1.637.682,00 12,48 3.908,06 12,36
2、SPUN SILK YARN+SILK NOIL
YARN [1)+2)]
2.449.522,00 -14,54 8.145,94 1,33
1)SILK NOIL YARN 683.561,00 -39,42 957,35 -28,68
2) OTHERS SPUN SILK YARN 1.765.961,00 1,61 7.188,89 7,34
3、FOR RETAIL USE 14.701,00 -3,05 69,03 16,07
Corso Risorgimento Nr. 7 – 13900 Biella - Italia Tel./Fax +39 015 405 818 e-mail info@iwta.it31
MOHAIR
Buona la domanda di Mohair per tutto l’anno. Verso Settembre gli Young Goats e gli Adulti sono
aumentati di prezzo a causa di una forte richiesta e il divario tra Super Kids e Adulti è diminuito
notevolmente, portando il prezzo per le finezze ordinarie ad un livello mai visto.
Confrontando il 2017 con il 2016, in Euro, i Super Kid sono rimasti invariati, gli Young Goats
hanno guadagnato circa il 10% e gli Adulti circa il 15%.
La siccità devastante in Sud Africa, in certe zone non ha piovuto per due anni, è stata una delle
ragioni per il cambiamento nella composizione della tosa che è diventata più fine, con rese più
basse e più corta con conseguente estremo interesse sui lotti migliori. Meno nascite di agnelli
porteranno meno Super Kids ma ci saranno anche meno chili di Adult perché gli animali
produrranno fibre più fini. Attualmente la siccità è ancora molto severa e si spera che le piogge
molto desiderate arrivino entro Marzo.
Le stime di produzione per il 2018 parlano di circa il 10% in meno per Sud Africa.
Anche quest’anno il cambio Euro/Rand ha oscillato molto, da un minimo di 14,3 a Marzo ad un
massimo di 17,00 a Dicembre.
La maglieria continua a dominare il mercato del Mohair mentre la tessitura e il velluto
rimangono meno attivi. Si osserva un certo miglioramento dall’aguglieria.
Esportazioni dal Sud Africa :
2016 2017
Cina 688t 1086t
Italia 480t 765t
Taiwan 310t 367t
Gran Bretagna 147t 171t
Bulgaria 131t 152t
Giappone 71t 96t
Egitto 32t 69t
Corea 13t 27t
Altri 58t 78t
Totali 1930t 2811t
L’esportazione di Mohair lavato é diminuito da 128t nel 2016 a 118t nel 2017. L’esportazione di
Mohair sucido è diminuita da 131t nel 2016 a 67t nel 2017.
La Cina e l’Italia insieme hanno assorbito 2/3 del totale di pettinato e blousses ma tutte le
destinazioni tradizionali hanno migliorato i loro volumi.
Corso Risorgimento Nr. 7 – 13900 Biella - Italia Tel./Fax +39 015 405 818 e-mail info@iwta.it32
MOHAIR
Mohair remained in good demand throughout the year. Towards September Young Goats and
Adults became dearer due to strong demand and the gap between Super Kids and Adults
narrowed considerably up, bringing the price level of the coarse microns to an unprecedented
high level. For the year as a whole Super Kids remained firm in Euros, Young Goats gained
approx. 10% and Adults approx. 15%.
The devastating drought in South Africa, in certain areas there has been no rain for 2 years, has
been one of the reasons for a change in the composition of the clip. The clip is becoming finer,
lower yielding and shorter with consequent pressure on the better performing lots. Lower
kidding rates will bring less Super Kids but there will also be less Adults as the animals will
produce finer fibers. The drought is still severe at this moment in time and the hope is that
some much needed rain will start falling around March.
Estimates for 2018 production figures indicate as much as – 10% less for South Africa.
Also this year the exchange rate Euro/Rand moved quite markedly from a low of 14,3 in March
to a peak of 17,0 in December.
Knitting yarns continue to dominate the market for mohair whereas weaving and velvet is less
active. A certain improvement is coming from the hand knitting sector.
Exports figures from South Africa :
2016 2017
China 688t 1086t
Italy 480t 765t
Taiwan 310t 367t
UK 147t 171t
Bulgaria 131t 152t
Japan 71t 96t
Egypt 32t 69t
Corea 13t 27t
Others 58t 78t
Totals 1930t 2811t
Scoured Mohair exports decreased from 128t in 2016 to 118t in 2017. Greasy exports
decreased from 131t in 2016 to 67t in 2017.
China and Italy together absorbed 2/3 of the total Tops and Noils exports but all the traditional
destinations improved on their figures.
Corso Risorgimento Nr. 7 – 13900 Biella - Italia Tel./Fax +39 015 405 818 e-mail info@iwta.itPuoi anche leggere