Assemblea Generale Annuale Ordinaria del 1 aprile 2019 Mercati e Materie Prime anno 2018
←
→
Trascrizione del contenuto della pagina
Se il tuo browser non visualizza correttamente la pagina, ti preghiamo di leggere il contenuto della pagina quaggiù
1

    Assemblea Generale Annuale Ordinaria

                                            del

                                 1 aprile 2019

                           R e l a z i o n e

                     Mercati e Materie Prime

                                    anno 2018

Corso Risorgimento Nr. 7 – 13900 Biella - Italia Tel./Fax +39 015 405 818   e-mail info@iwta.it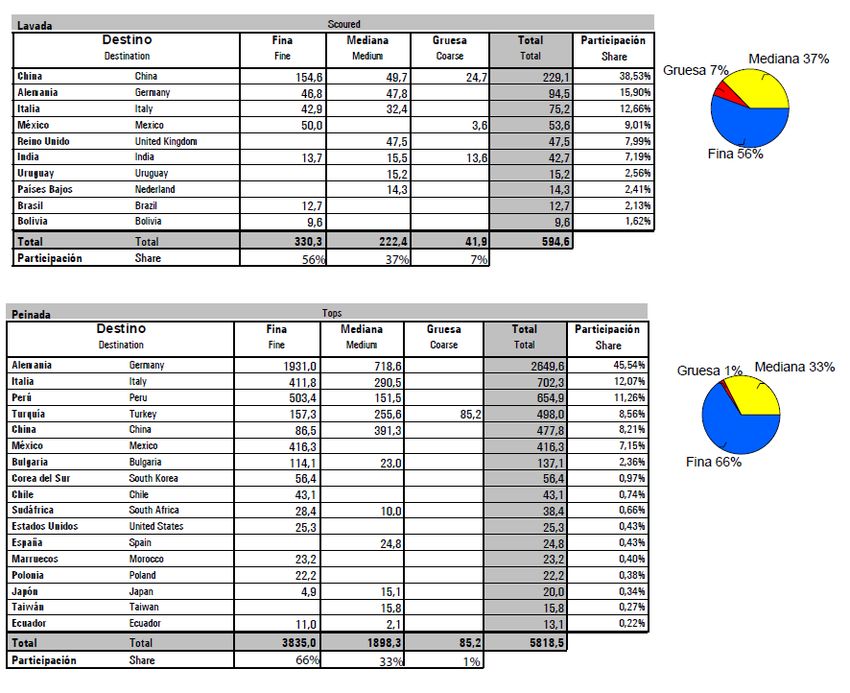
2

Cari Colleghi,

il 2018 è stato un anno molto positivo per gli allevatori dal punto di vista dei prezzi della lana,
che hanno visto l’indice EMI (estern market indicator australiano) salire per la prima volta nella
storia sopra i 2100 cents di dollari australiani/kg.

Nella stagione 2014/2015 il valore medio dell’EMI era stato di 1102 ac/kg con una produzione di
341 mln/kg base sucido e nella stagione 2017/2018 l’EMI è stato di 1739 ac/kg con una
produzione di 341 mln/kg. Nella stagione in corso a causa della siccità si prevede una perdita di
produzione di circa 36 mln di kg che porterà la produzione a circa 305 mln/Kg base sucido.
In Nuova Zelanda per la stagione 2018/2019 si prevede una produzione di 139 mln di kg base
sucido in leggero calo rispetto alla stagione precedente e circa il 10% in meno rispetto alla
stagione 2014/2015.
In Sud Africa la produzione della stagione 2017/2018 si è attestata sui 49 mln base sucido e si
prevede per la stagione 2018/2019 un calo di produzione di circa il 2% e, a causa del venir
meno delle lane provenienti dal Lesotho, i quantitativi disponibili potrebbero ridursi del 13%.
In Argentina si prevede per questa stagione una produzione di circa 43,7 mln di kg base sucido.
In Uruguay nel periodo Gennaio-Dicembre 2018 sono stati esportati circa 41 mln di kg di lana
base sucido.

La produzione totale di lana si attesta a circa l’1,1% con 1,155 mln di tons della produzione
mondiale di fibre pari a 103,3 milioni di tonnellate, il 5,94% in più rispetto allo scorso anno.
Le altre fibre di origine animale rappresentano lo 0,5% pari a 0,54 mln/tons, il cotone circa il
26% pari a 26,89 mln/tons in crescita dallo scorso anno del 13,8%, lino e seta circa lo 0,9% pari
a 0,97 mln/tons e le fibre artificiali e sintetiche circa il 71,5% pari a 74,3 mln/tons con un
incremento dall’anno scorso del 3,4%. In questo scenario la Cina continua ad essere in
assoluto il più importante acquirente, produttore e anche consumatore di prodotti in lana in
grado di creare repentine variazioni di mercato.

Nella sfida globale di ripensare il futuro del pianeta, il tema della sostenibilità rappresenta
sempre più una fondamentale leva competitiva e, in particolar modo per l’Italia, primo produttore
di moda e di lusso al mondo. In questo contesto, la lana, fibra ecosostenibile, biodegradabile,
rinnovabile, riciclabile e con un basso impatto energetico può portare un valido contributo e
anche le fibre naturali rigenerate e certificate quali lana e cashmere, prodotti di eccellenza
dell’industria pratese, possono dire la loro.

Nel 2018 la nostra Associazione è stata molto attiva sia sul fronte dello sviluppo associativo
dando il benvenuto a nuovi Associati, sia sul fronte della partecipazione ad eventi in Italia e
all’estero.

Abbiamo dato il nostro sostegno alla candidatura di Biella a Città Creativa Unesco raccogliendo
lettere di sostegno provenienti dai principali paesi di produzione laniera.

Dal 14 al 16 maggio abbiamo partecipato all’87mo Congresso IWTO ad Hong Kong. Il 26
Giugno, si è tenuta una riunione di Consiglio a Prato a cui ha partecipato una buona
delegazione di associati da Biella e dal Veneto.

Il 3 e 4 Dicembre abbiamo partecipato a Buenos Aires alla IWTO Wool Round Table. Il 17
Dicembre abbiamo avuto una riunione di Consiglio con cena pre natalizia.

Saremo a Venezia dal 9 all’11 Aprile per l’88mo Congresso IWTO.

A seguire le relazioni su tutte le Fibre e i Mercati d’Origine.

                 Corso Risorgimento Nr. 7 – 13900 Biella - Italia Tel./Fax +39 015 405 818   e-mail info@iwta.it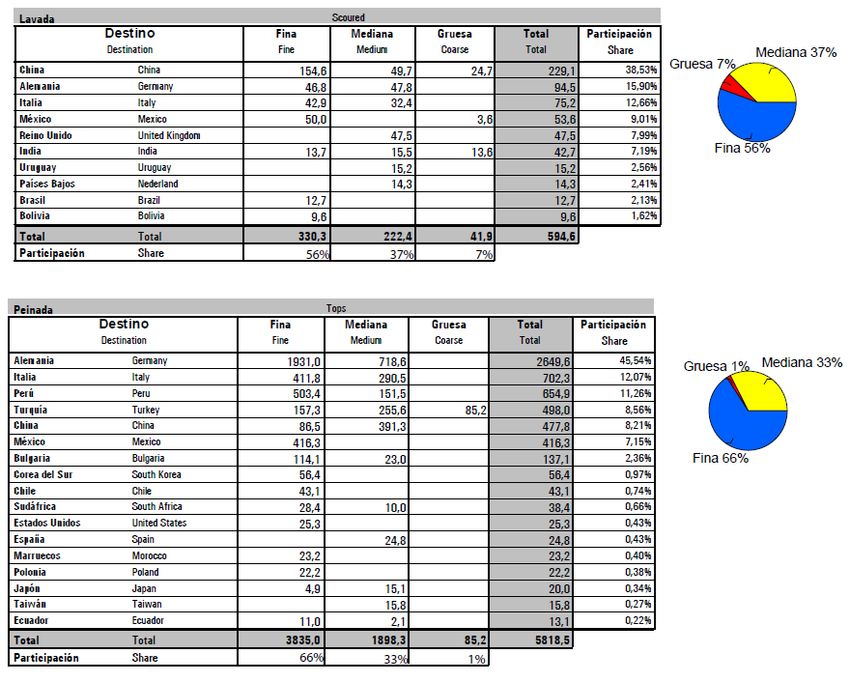
3

Dear Colleagues,

by introducing our Annual Report I would like to highlight how wool prices in 2018 have
continued their rise. The Eastern Market Indicator rose, for the first time, to over 2100 ac/kg.

In comparison, in the season 2014/2015 the average EMI was 1102 ac/kg with a production of
341 mln greasy and in the season 2017/2018 the average EMI was 1739 ac/k with almost the
same production. In this season, a production 305 mlnKg greasy is expected , due to severe
drought.
In New Zealand, for the season 2018/2019, production is expected to be 139 mln/kg greasy , in
small reduction compared with the previous season and approximately 10% less than the
season 2014/2015.
In South Africa, the 2017/2018 production was about 49 mln/kg greasy, whereas for the season
2019/2019 is expected a reduction of 13% is to be expoected, also due to the lack of Lesotho’s
wool. Argentina forecasts for the season a wool production of 43,7 mln/kg greasy. Uruguay
export of greasy wool from January- December 2018 was appoximately 41 mln/kg greasy.

The world wool production is almost stable at 1.1%, 1,155 mln/tons of the world’s total fibre
production up 103,3 mln tons an increase of +5,94% compared to last year. The other animal
fibres represent 0,5%, 0,54 mln/tons; cotton represents 26% 26,89 mln/tons with an increase of
13,8% compared with last year; linen and silk about 0.9% 0.97 mln/tons; artificial and synthetics
fibres represent 71,5% 74,3 mln/ton with an increase of 3,4% compared with last year. China
continues being the largest buyer, producer and consumer of wool products and can strongly
influence the market.

In the global challanges of re-designing the future of our planet, sustainability can be a
fundamentally important and competitive lever for Italy, the world’s biggest luxury fashion
producer.
Wool, a sustainable, biodegradable, renewable, recyclable fibre and with low manufacturing
energy impact can play a positive role. The certified wool and cashmere recycled products of
from Prato will also contribute.

During the 2018, our Association has been very active, welcoming new members, and
participating at events in Italy and abroad.

We gave our contribution to the Biella Unesco Committee collecting letters of support in the
nomination of Biella as Unesco Creative City from all the main woolgrower and textile
associations in the world.

From the 14th to the 16th of May we attended the 87th IWTO congress in Hong Kong.
On the 26th of June, many delegates from Biella and from Veneto, participated at an open
board meeting held in Prato.

On the 3th and 4th of December we attended the IWTO Round Table in Buenos Aires.
On the 17th of December a board meeting was held with a pre-Christmas dinner.

From the 9th to the 12th of April 2018 we will be in Venice to attend the 88th IWTO Congress.

             Corso Risorgimento Nr. 7 – 13900 Biella - Italia Tel./Fax +39 015 405 818   e-mail info@iwta.it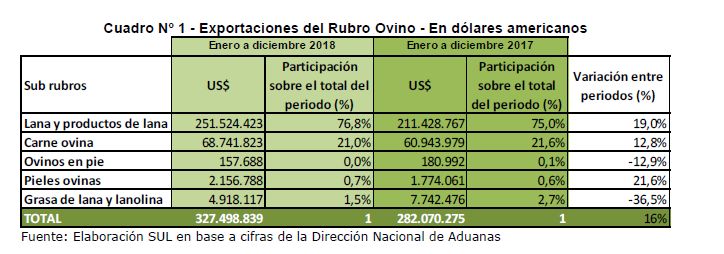
4

AUSTRALIA
Nell'anno di calendario 2018 il mercato delle lane australiane ha evidenziato nei primi sei mesi
(seconda metà della stagione laniera 2017/2018) una tendenza in forte rialzo con fluttuazioni
del mercato importanti (indicatore mkt da 1760 a 2056 centesimi / kg).
A metà Agosto il mercato ha raggiunto il livello storico record di 2120 cents!

Dalla seconda metà dell'anno la tendenza è stata stabile per poi segnare un calo dei prezzi (in
particolare i tipi fini). Indicatore mkt da 2056 a 1849 centesimi/kg.

Per i compratori area euro, il dollaro australiano ha aiutato, partendo da 0.65 nella prima parte
dell’anno per poi indebolirsi fino 0.63 in Dicembre.

Mercato completamente stravolto per l’area USD (dove si concentra il 90% delle esportazioni –
Cina/India): le oscillazioni sono andate da 0.76 di Gennaio fino 0.78 di metà Luglio per poi
riscendere a 0.70 a fine Dicembre.
Nonostante queste oscillazioni valutare, il mercato in USD ha seguito una leggera e costante
salita nella prima parte di stagione, per poi affievolirsi (vedere linea rossa).

Purtroppo la forte siccità ha ridotto fortemente i volumi di lana prodotta, sconvolgendo
completamente gli equilibri degli ultimi anni.
Nella prima parte della stagione 2018/2019 sono state messe in asta il 16,2% in meno di balle
(circa 183.000)!

Le prime stime parlano di un calo di produzione del 10/11% in meno della scorsa stagione.

Lo storno del mercato in Ottobre/Novembre è stato associato a due fattori:
   - trade war fra Cina e USA;
   - forte percentuale di offerta di lane super fini, arrivata al 55% del totale della tosa
       (vedere tabella sotto)!

              Corso Risorgimento Nr. 7 – 13900 Biella - Italia Tel./Fax +39 015 405 818   e-mail info@iwta.it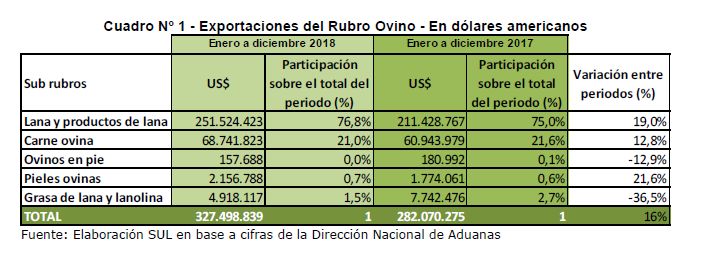
5

I prezzi delle lane super fini hanno registrato un forte aumento di prezzo nella prima parte del
2018; alla riapertura delle aste ex Newcastle (nuova tosa e disponibilità di ottime lane), solo le
lane di ottimi stili e resistenza, hanno ricevuto ottimi premi.
A causa della siccità la selezione di lane molto tenere e corte è aumentata.
Gli allevatori più soddisfatti sono sicuramente quelli che producono tipologie dal 19,0/24,0 mic.
Prezzi molto sostenuti e con ottimi ritorni sulle lane di facile produzione grazie alla consistente
richiesta da Cina e India.
Continua il buon trend delle lane da 24/30 mic posizionandosi su alti livelli.
Le lane sopra i 30 mic continuano a soffrire la tendenza al ribasso/depressiva del mercato in
Nuova Zelanda.
Ancora molto redditizia la vendita di agnelli da carne con prezzi decisamente sostenuti.
Nel 2018 le tipologie da carda, specialmente agnelli e pezzami per produrre open tops / tops
corti e lane da carbonizzo (in particolare per il mercato cinese), hanno subito uno storno
improvviso a inizio anno per poi risalire nei primi sei mesi del 2018; da Settembre in poi c’è
stato un forte crollo del mercato.
Il mercato del cardato incomincia a subire rallentamenti, anche a fronte del calo di ordinativi da
parte della Cina per le tipologie double face.
Si attendono novità dalla Cina.

                    2017/18 (red graph line) and 2018/19( black graph line) in Australian Cents

              Corso Risorgimento Nr. 7 – 13900 Biella - Italia Tel./Fax +39 015 405 818   e-mail info@iwta.it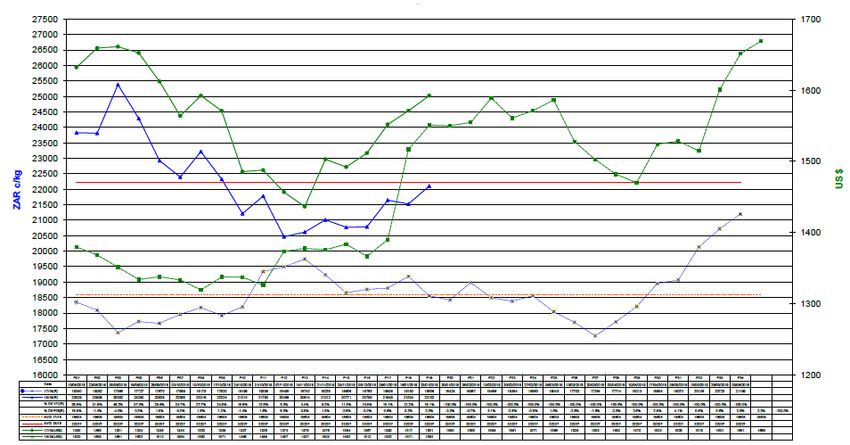
6

Alcuni dati riferiti alle esportazioni per la prima parte della stagione 2018/2019 (ultimi sei mesi
del 2018) paragonati allo scorso anno:

- calo del 20,5% di esportazioni dall’Australia;
- la Cina ha importato il 24,0% in meno dall’Australia;
- immesse sul mercato 183,000 balle in meno (16,2%).

              Corso Risorgimento Nr. 7 – 13900 Biella - Italia Tel./Fax +39 015 405 818   e-mail info@iwta.it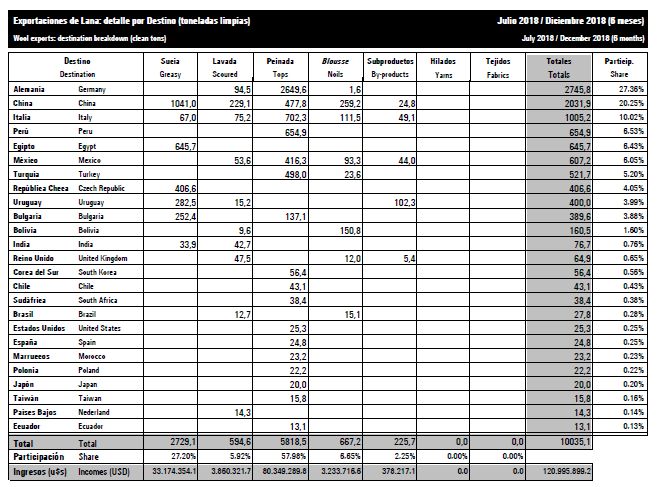
7

AUSTRALIA
In calendar year 2018 the Australian wool market highlighted in the first six months (second half
of the wool season 2017/2018) a strong upward trend with major market fluctuations (market
indicator from 1760 to 2056 cents/Kg).
In mid-August the market reached the record historical level of 2120 cents!

From the second half of the year the trend was stable and then marked a drop in prices (in
particular the fine types). Market indicator from 2056 to 1849 cents/Kg.

For Euro buyers, the Australian dollar helped, starting from 0.65 in the early part of the year and
then weakening until 0.63 in December.

Market completely disrupted for the USD area (where 90% of exports are concentrated –
China/India): the swings went from 0.76 January to 0.78 in the middle of July and then back to
0.70 at the end of December.
Despite these fluctuations evaluate, the market in USD followed a slight and constant ascent in
the first part of the season, then fade (see red Line).

Unfortunately, the strong drought has strongly reduced the volumes of wool produced, upsetting
completely the balances of recent years.
In the first part of the 2018/2019 season, 16.2% less than bales were auctioned (approx.
183,000)!

The first estimates speak of a decrease in production of 10/11% less than last season.

The market reversal in October/November was associated with two factors:
-Trade War between China and USA;
-Strong offer percentage of super fine wool, arrived at 55% (see table below) of the total of the
wool shorn!

              Corso Risorgimento Nr. 7 – 13900 Biella - Italia Tel./Fax +39 015 405 818   e-mail info@iwta.it
8

The prices of the super fine wool showed a sharp price increase in the first part of 2018; at the
re-opening of the ex Newcastle auctions (new clip and excellent wool availability), only wool of
excellent styles and strength have received excellent prices.
The selection of very tender wool and short is increased.
The most satisfied breeders are definitely those that produce types from the 19,0/24,0 mic. Very
high prices and with excellent returns on wool of easy production thanks to the consistent
demand of China/India.
Continues the good trend of wool by 24/30 mic. positioning itself on high levels.
Wool over 30 mic. continues to suffer the downward/depressive trend of the market in New
Zealand.

Still very profitable the sale of meat lambs with decidedly sustained prices.

In 2018 the carding types, especially lambs and pieces, to produce short open tops/tops and
carbonised wool (in particular for the Chinese market), underwent a sudden reversal at the
beginning of the year and then traced back in the first six months of 2018; from September
onwards there was a strong market crash.

The carding market is beginning to suffer slowdowns, even in the face of China's drop in orders
for the double face types.
We await news from China

                    2017/18 (red graph line) and 2018/19( black graph line )in Australian Cents

              Corso Risorgimento Nr. 7 – 13900 Biella - Italia Tel./Fax +39 015 405 818   e-mail info@iwta.it
9

Some export data the first part of the 2018/2019 season (last six months of 2018) compared to
last year:

-20.5% drop in export from Australia;
-China imported 24.0% less from Australia;
-Placed on the market 183.000 bales less (16.2%).

             Corso Risorgimento Nr. 7 – 13900 Biella - Italia Tel./Fax +39 015 405 818   e-mail info@iwta.it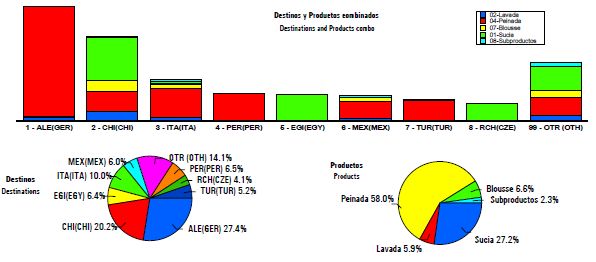
10

NUOVA ZELANDA
Nel 2017 a causa dei prezzi bassi, dovuti alla minor richiesta di lana per tappeti e moquettes, le
esportazioni di lana Neozelandese sono diminuite notevolmente con la lana rimasta invenduta e
stoccata nei magazzini e la conseguente scelta da parte dei produttori di lana di non vendere a
prezzi così bassi.
Nel 2018 la produzione di lana sucida da tosa è stata di 139.000 tonnellate con una
diminuzione del 2.2% rispetto all’anno precedente, mentre la produzione di lana di slanatura ha
subito un calo dell’1.3% rispetto al 2017, diminuzione dovuta sia alla bassa resa delle pelli che
alla lana esportata in Cina, sucida, per essere lavorata.
Per queste ragioni, le esportazioni nel corso dell’anno 2018 hanno avuto un relativo incremento
del 18%, a seguito della vendita delle lane stoccate per ottenere una maggiore liquidità
finanziaria.
L’Asia Settentrionale, guidata dalla Cina, è il principale mercato a cui si rivolgono le esportazioni
neozelandesi con un incremento del 5%, mentre le esportazioni verso i Paesi dell’Unione
Europea hanno avuto un incremento del 2.4%.
Nel corso del 2018, la media stagionale dei prezzi della lana fine ha avuto un aumento
dell’8.8% rispetto all’anno precedente.
Per il 2019 si prevede un moderato aumento (4.3%) del prezzo globale della lana d’asta, che
rispecchia un lieve miglioramento rispetto agli storici livelli raggiunti dal mercato neozelandese
nel 2018.
La lavorazione del filato per tappeti rimane messa da parte, mentre i produttori Cinesi ed
Europei continuano a trarre vantaggio da questo storico indebolimento dei prezzi.
Infine, per il 2019 le prospettive della Nuova Zelanda sono per la stabilità e il consolidamento
del mercato.

NEW ZEALAND
In 2017, due to low prices caused by a lower demand of crossbred wool for carpets and floor
furnishings, New Zealand wool exports diminished, with unsold wool held as greasy wool stocks
on-hand, with wool growers choosing not to sell at such low price levels.
In 2018, greasy wool production was 139.000 tons with a decrease of 2.2% compared to the
previous year, while slipe wool production had a drop of 1.3% compared to 2017. This decrease
was due to low yield of the skins, as well as wool being left on the skins being exported on a
greasy basis to China for processing.
We can finally state that the NZ wool exports during 2018 had a relative increase of 18%, as
unsold greasy wool stock was finally sold in order to realise cashflows.
North Asia, led by China, is New Zealand’s largest market region with a wool export increase of
5%, while wool shipped to EU countries increased by 2.4%.
In 2018, the season average crossbred merino wool prices jumped of 8.8% compared to the
previous year.
For 2019, the overall auction wool price is forecast to be up moderately by 4.3%, an increase
which reflects a slight improvement against 2018’s historically low price levels.
Carpet spinning remains subdued, wheras Chinese and European top makers look to take
advantage of the historically low NZ wool levels.
Finally, for 2019, due to steady global economic growth stable government, NZ’s outlook is for
on-going stability and market consolidation.

              Corso Risorgimento Nr. 7 – 13900 Biella - Italia Tel./Fax +39 015 405 818   e-mail info@iwta.it
11
SUD AFRICA
In Sud Africa, durante la prima vendita della nuova stagione (15 Agosto 2018) l’indicatore di
mercato è sceso dell’1%, base Dollaro Usa, rispetto alla chiusura della precedente stagione (6
Giugno 2018). Il mercato ha continuato ad indebolirsi, sempre in termini USD, nel periodo
Agosto - metà Novembre 2018 fino a toccare -11%, per poi riprendersi bene verso la fine di
Gennaio 2019 e chiudere solo al 2,5% in meno rispetto alla prima vendita della stagione.
Da parecchi anni la produzione laniera in Sud Africa è piuttosto stabile. La tosa Lesotho, che è
sempre stata venduta alle aste, in questa stagione non lo sarà più, in quanto un uomo d’affari
cinese è riuscito ad accaparrarsi in esclusiva il diritto di commercializzare e vendere questa
lana e sembra che la totalità della tosa laniera Lesotho finirà per essere spedita in Cina. Gli
allevatori vorrebbero vendere questa lana tramite le aste in SA, poiché otterrebbero dei prezzi
nettamente più alti, ma purtroppo non sono in grado di farlo a causa di un decreto ministeriale
che lo vieta. A tal proposito, sono attualmente aperte parecchie pendenze giudiziarie; tuttavia
pare altamente improbabile che nella corrente stagione la lana del Lesotho venga venduta in
SA.
La produzione nazionale per il 2018/19 è prevista in calo del 2% circa e, aggiungendo la
mancata offerta di lana Lesotho in Sud Africa, si può prevedere che l’offerta totale in SA calerà
del 13% ca. rispetto alla stagione precedente.
La Cina si riconferma il mercato dominante in SA in questa stagione, infatti il 71% delle
esportazioni dal SA è diretto in Cina. La Rep. Ceca col 16% è al secondo posto, seguita
dall’Italia al 3° posto col 6%. Seguono la Bulgaria e l’India, entrambe col 2,2%, che acquistano
piccoli quantitativi dal SA.
In Sud Africa il picco dell’offerta laniera si registra tra il tardo mese Ottobre e Gennaio, quando
si raggiungono le 10.000/15.000 balle alla settimana. Durante il periodo Febbraio-Marzo le
vendite si attestano in media a ca. 9.000 balle alla settimana.
A partire da Aprile la lana disponibile per la vendita diminuisce tanto che fino alla fine della
stagione (inizio Giugno 2019) le vendite avranno luogo solo ogni due settimane.
Corso Risorgimento Nr. 7 – 13900 Biella - Italia Tel./Fax +39 015 405 818 e-mail info@iwta.it12
SOUTH AFRICA
In South Africa, on the first sale of the new season (15 August 2018), the market indicator was
1% down in USD terms compared to the closing sale of the previous season (6 June 2018). The
market continued to be weaker from August through to mid November 2018, declining by a
further 11% (in USD terms) during this period.
However, since mid of November until 23 January 2019, the market rebounded nicely to end up
only 2.5% below the opening sale .
For several years now the production of South African wool has remained fairly stable.
Unfortunately however, the Lesotho wool clip which was always sold through the South African
auction system, will not be offered on the SA auction system this season.
A Chinese businessman has managed to secure sole rights to market and sell this wool and it
seems that the entire Lesotho wool clip will end up being shipped to China. The Lesotho wool
growers desperately want to sell on the SA auction system (as they achieve far higher prices),
but unfortunately due to a government decree forbidding this, they have been unable to sell
their wool in South Africa.
Several court cases are currently in progress with regard to this issue, but unfortunately it
seems highly unlikely that any Lesotho wool will be sold in SA during the current season.
Production within SA for the 2018/18 season is expected to be down around 2% at this stage,
so together with the Lesotho wool not being offered in SA, we can expect the total offering in SA
to decrease by around 13% compared to last season.
China is once again the dominant market force in the SA market this season with 71% of the
exports from South Africa being shipped to China. The second largest export destination is the
Czech Republic (16%), followed by Italy in third place (6%). Thereafter, Bulgaria (2.2%) and
India (2.2%) are the next largest export destinations, but purchase small quantities from SA.
The peak of the wool offering in South Africa is during the late October – January period, when
the offerings range between 10,000 – 15,000 bales per week. During the February - March
period approximately the sales normally average around 9000 bales per week.
WEF April, the wool available for sale decreases, resulting in wool sales being held every 2
weeks until the end of the season (early June 2019).
Corso Risorgimento Nr. 7 – 13900 Biella - Italia Tel./Fax +39 015 405 818 e-mail info@iwta.it13
ARGENTINA
La stima fatta sulla produzione di lana grezza nel 2018 ha evidenziato un quantitativo totale pari
a 43.750 tonnellate.
Esportazione base lana grezza (clean tons)
Nell’anno 2018 le esportazioni della lana, base clean, vedono tra i principali paesi destinatari la
Cina (47.89%), la Germania (47.34%), l’Italia (17.45%), la Turchia (12.32%), il Perù (11.85%),
l’Egitto (10.51%), il Messico (9.91%) e la Repubblica Ceca (9.64%).
Corso Risorgimento Nr. 7 – 13900 Biella - Italia Tel./Fax +39 015 405 818 e-mail info@iwta.it14 Corso Risorgimento Nr. 7 – 13900 Biella - Italia Tel./Fax +39 015 405 818 e-mail info@iwta.it
15
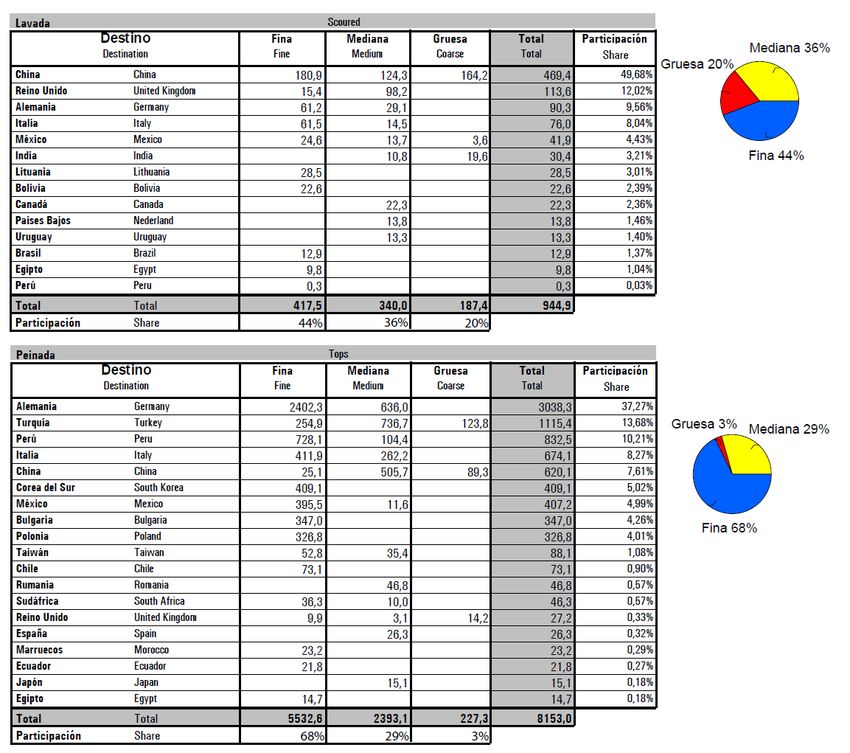
Stagione Gennaio – Dicembre 2018
Per tipologia di prodotto i paesi destinatari delle esportazioni sono stati i seguenti:
LANA GREZZA
Per questa stagione troviamo la Cina in prima linea (86.76%) seguita dall’Egitto (35.56%),
Repubblica Ceca (31.96%) e Uruguay (22.38%).
LANA LAVATA
Per questa stagione troviamo la Cina in prima linea (88.21%) seguita dalla Germania (25.46%),
Italia (20.07%) e Regno Unito (20.01%).
LANA PETTINATA
Nel 2018 la Germania ha importato l’82.81%, la Turchia il 22.24% il Perù il 21.47% e l’Italia il
20.34%.
Corso Risorgimento Nr. 7 – 13900 Biella - Italia Tel./Fax +39 015 405 818 e-mail info@iwta.it16 Corso Risorgimento Nr. 7 – 13900 Biella - Italia Tel./Fax +39 015 405 818 e-mail info@iwta.it
17

Le quantità prodotte nel 2018, a seconda delle finezze della lana base clean, sono state le
seguenti:
                                    Grafico 1periodo Gennaio – Luglio 2018

             Corso Risorgimento Nr. 7 – 13900 Biella - Italia Tel./Fax +39 015 405 818   e-mail info@iwta.it
18
Grafico 2periodo Luglio – Dicembre 2018
Dai grafici si evince che le finezze quantitativamente più importanti in Argentina sono state:
my 20; my 21; my 19, my 19.50; my 23 per i fini (fine)
my 27, my 29; my 30; my 28 per gli ordinari (coarse).
ARGENTINA
Production (greasy)
Production estimation for January – December 2018 season shows a total of 43.750 tons in the
production of greasy wool.
Wool exports: destination breakdown (clean tons)
During the considered period, January – December 2018 the main destinations to export wool
(clean tons) have been the followings: China (47.89%), Germany (47.34%), Italy (17.45%),
Turkey (12.32%), Perù (11.85%), Egypt (10.51%), Mexico (9.91%) and Czech Republic
(9.64%).
Corso Risorgimento Nr. 7 – 13900 Biella - Italia Tel./Fax +39 015 405 818 e-mail info@iwta.it19 Corso Risorgimento Nr. 7 – 13900 Biella - Italia Tel./Fax +39 015 405 818 e-mail info@iwta.it
20

Corso Risorgimento Nr. 7 – 13900 Biella - Italia Tel./Fax +39 015 405 818   e-mail info@iwta.it
21

Season January– December 2018

Wool exports main destinations: products breakdown (clean tons)
GREASY WOOL
China is the leader with 86.76%, followed by Egypt (35.56%), Czech Republic (31.96%) and
Uruguay (22.38%).
SCOURED WOOL
China is the leader with 88.21%, followed by Germany (25.46%), Italy (20.07%) and United
Kingdom (20.01%).
WOOL TOPS
Germany imported 82.81%, Turkey 22.24%, Perù 21.47% and Italy imported 20.34%.

            Corso Risorgimento Nr. 7 – 13900 Biella - Italia Tel./Fax +39 015 405 818   e-mail info@iwta.it
22 Corso Risorgimento Nr. 7 – 13900 Biella - Italia Tel./Fax +39 015 405 818 e-mail info@iwta.it
23

Having a look to the quantity produced in the period January– December 2018, depending by
the micron profile of the wool (clean tons), the study shows the following:

Wool exports: micron profile (clean tons) January - July 2018

Wool exports: micron profile (clean tons) July – December 2018

The above chart shows the success in exports quantity, referring to micron profile (clean tons)
registered in Argentina:
my 20; my 21; my 19; my 19.50; my 23 (fine)
my 27; my 29; my 30; my 28 (coarse).

                 Corso Risorgimento Nr. 7 – 13900 Biella - Italia Tel./Fax +39 015 405 818   e-mail info@iwta.it
24
URUGUAY
Da Gennaio a Dicembre 2018 l'esportazione dei principali prodotti ottenuti dall'allevamento
ovino (lana e sottoprodotti, carne ovina, pelli di pecora, pecore vive e grasso di lana e lanolina)
ha raggiunto un valore pari a 327milioni di dollari; tale importo rappresenta un aumento del 16%
rispetto allo stesso periodo dell'anno precedente, secondo i dati del"exportacionescumplidas" e
comparati con il Secretariado Uruguayo de la Lana (S.U.L.) por la Dirección Nacional de
Aduanas.
Questi dati comprendono le importazioni del prodotto.
.
Il 76% delle vendite all'estero dei prodotti ovini corrisponde a lana e derivati della lana e
ammonta a 251 milioni di dollari, registrando un aumento del 19%, rispetto al periodo Gennaio –
Dicembre 2017.
Nell’analizzare le esportazioni degli altri elementi che compongono l'allevamento ovino, si
osserva che l’esportazione di carne di pecora totalizza 69 milioni di dollari, evidenziando un
aumento del 12.8%; l'esportazione delle pelli di pecora ammonta a 2.1 milioni di dollari,
aumentando del 21%.
L’esportazione delle pecore vive ammonta a US$ 157.688. L’esportazione relativa al grasso di
lana e lanolina ha registrato un calo del 37% rispetto allo stesso periodo precedente (4.9 milioni
di dollari).
Esportazioni di lana e sottoprodotti
In termini di volume fisico, nel corso del periodo considerato, l'Uruguay ha esportato un totale di
41 milioni di chili di lana base grezza (considerando lana grezza, lavata e pettinata), il 2% in più
rispetto allo stesso periodo precedente.
Il 52% della lana è stato esportato come lana pettinata, il 20% lana base grezza e il restante
28% come lana lavata. Rispetto allo stesso periodo dell’anno precedente, il volume delle
vendite all’estero è aumentato del 9% per la lana grezza e dell’1.5% per la lana lavata. Per
quanto riguarda la lana pettinata, il volume delle vendite all’estero è rimasto pari a 21,8 milioni
di Kg di lana sucida.
Corso Risorgimento Nr. 7 – 13900 Biella - Italia Tel./Fax +39 015 405 818 e-mail info@iwta.it25
Destinazioni principali
Le destinazioni principali per le vendite all'estero di lana e sottoprodotti nel periodo considerato
sono state 30. Analizzando in termini di valore le esportazioni di lana grezza, lavata e pettinata,
si registra un aumento del 19% rispetto al periodo precedente, per un totale di 235 milioni di
dollari.
La destinazione principale in termini di valore delle esportazioni per questo gruppo di prodotti è
rimasta la Cina, con 43% del totale. A seguire troviamo Germania (17% del totale), Italia (8%),
India (4%), Turchia (4%), Bulgaria (3%).
La Cina ha acquistato il 58% del totale della lana grezza, seguita da Italia con il 16% e Bulgaria
con il 9%.
In questa sottocategoria e rispetto allo stesso periodo dell’anno precedente, si osserva un
aumento del guadagno in valuta estera pari al 32% (totale del periodo 52.7 milioni di dollari).
Per quanto riguarda la lana lavata, le percentuali sono le seguenti: Cina 75%, India (10%) e
USA (2%). In questa categoria la destinazione più importante è stata la Cina, che ha aumentato
i propri acquisti, in termine di valore, del 5%. Rispetto allo stesso periodo dell’anno precedente,
l’aumento registrato è stato del 10%, raggiungendo 52 milioni di dollari.
Per quanto riguarda la lana pettinata, i maggiori acquirenti del periodo considerato sono:
Germania con il 29% del totale (39 milioni di dollari) registrando un incremento del 37% rispetto
allo stesso periodo del 2017, seguita per importanza dalla Cina (25%) che registra un aumento
del 25%, l’Italia (8%) con un calo del 13% e la Turchia (6%), che ha ridotto le importazioni in
termini di valore del 13%.
Rispetto allo stesso periodo precedente, le esportazioni hanno registrato un aumento del 18%,
per un totale di US$ 130.829.458.
Corso Risorgimento Nr. 7 – 13900 Biella - Italia Tel./Fax +39 015 405 818 e-mail info@iwta.it26
Proventi in valuta estera per prodotto
Analizzando i diversi fattori che compongono l'esportazione di lana e sottoprodotti, osserviamo
che la maggior parte delle vendite all’estero registrano un aumento delle esportazioni in termini
di valore rispetto allo stesso periodo precedente.
Corso Risorgimento Nr. 7 – 13900 Biella - Italia Tel./Fax +39 015 405 818 e-mail info@iwta.it27
URUGUAY
During the period January – December 2018 exports of main products obtained by sheep
farming (wool and by-products, sheep meat, sheepskins, live sheep for export, wool wax and
lanolin) reached a value of 327 million dollars; this amount represents an increase of 16%
compared with the same period of the previous year, as per the last data of the
"exportacionescumplidas" and compared with the Secretariado Uruguayo de la Lana (S.U.L.)
por la Dirección Nacional de Aduanas. Data include imports of the product.
76% of exports of the products obtained by sheep farming is about wool and wool derivatives
with the total amount of 251 million dollars and an increase of 19%, if compared with the same
season January - December 2017.
When analysing the behaviour of the other items that make up the sheep farming, it is observed
that exports of sheep meat reaches 69 million dollars, showing a growth of 12.8%; those of
sheepskins registered an increase of 21% with total amount of 2.1 million dollars. Exports of live
sheep decreased by totalling US$ 157.688 and exports of wool wax and lanolin reached 4.9
million, 37% less than the same period before.
Wool and by-products exports
In terms of volume, during the period considered, Uruguay exported a total of 41 million Kg of
greasy wool (considering more exactly greasy wool, clean wool and combed wool), which
represents 2% more than the same period of 2017. 52% of the whole wool was exported as
combed wool, 20% as greasy basis, and the remaining 28% as clean wool.
Exports, in physical volume, increased in greasy wool by 9% and in clean woolby1.5%, while in
combed wool it remained at 21.8 million kg of sucid wool.
Corso Risorgimento Nr. 7 – 13900 Biella - Italia Tel./Fax +39 015 405 818 e-mail info@iwta.it28
Wool exports: destination breakdown
During January – December 2018 the main destinations to export wool and by-products have
been 30.
In terms of value, the study of exports (greasy wool, clean and combed wool) registered a rise
of 19% compared to the same period before, for a total of 235 million dollars.
The Country leader in importation remains China, with 43% of total imports, followed by
Germany (17%), Italy (8%), India (4%), Turkey (4%) and Bulgaria (3%).
China obtained 58% of the total greasy wool, followed by Italy with 16% and Bulgaria with 9%.In
this sub-item, there is an increase in foreign currency compared to the previous period of 32%
(total for the period 52.7 million dollars).
As per clean tons, you can find China with 75%, followed by India (10%) and USA (2%).In this
category, the most important destination is China that increased its purchases by 5%, in terms
of value. Compared to the same period of 2017, incomes increased to 52 million dollars that
means10% more than in the previous period.
In combed wool, Germany is still at the first place, getting 29% of the total (US$ 39 million) and
registering a rise of 37% in the same previous period, followed in importance by China (25%)
that increased its purchases by 25%, Italy (8%) that reduced its purchases 13% and Turkey
(6%) that decreased its importsby 13%, in terms of value. Compared to the same period before,
exports registered an increase of 18% in current rates, total US$ 130,829,458.
Corso Risorgimento Nr. 7 – 13900 Biella - Italia Tel./Fax +39 015 405 818 e-mail info@iwta.it29
Foreign currency incomes: products breakdown
Studying all different factors that make up exports of wool and by-products, it is useful to
observe that most of categories registered increases in exports in terms of value compared with
the same period before.
Corso Risorgimento Nr. 7 – 13900 Biella - Italia Tel./Fax +39 015 405 818 e-mail info@iwta.it30
CILE
Per la stagione 2018/2019 in Punta Arenas si prevedono circa 5,5 milioni di chili di lana (base
sucido) con una riduzione del 5% rispetto alla stagione precedente. Anche per gli agnelli ci sarà
una percentuale simile di riduzione.
Si prevede inoltre che 1 milione di chili di lana, provenienti da altre aree del Cile, saranno
venduti durante questa stagione.
E’ stato venduto il 70% della tosa di Punta Arenas entro Febbraio 2019. In questa stagione la
media della tosa è di 26,3 micron. La lana più fine testata finora è di 17,2 micron.
Per tutta la stagione i prezzi hanno seguito quelli del mercato australiano e i prezzi più alti sono
stati pagati nel mese di Febbraio 2019, sia per lana merino che per i crossbred.
Ci si aspetta che il rimanente 30% della tosa sarà venduto presto, grazie al livello alto dei prezzi
attuali.
CHILE
The forecast of wool production in the Punta Arenas area for this season is 5.5 million kilos
(greasy basis) a 5% reduction on the previous season. Production of lambs have also reduced
by a similar percentage.
1 million kilos of wool from other areas of Chile is forecast to be sold during this season.
To date 70% of the Punta Arenas clip has been sold.
The average micron of the clip is 26.3 micron. The finest wool tested to date is 17.2 microns.
Prices have followed the Australian market prices throughout the season with the highest prices
being paid in February 2019 for both xbred and merino wool.
It is expected that the remaining 30% of wool unsold will be sold soon due to current high wool
prices.
Corso Risorgimento Nr. 7 – 13900 Biella - Italia Tel./Fax +39 015 405 818 e-mail info@iwta.it31
LANE BRITANNICHE E EUROPEE
Lane inglesi
Nel passato, un aumento della richiesta per lane merinos portava degli effetti positivi anche
sulle lane mezzofini e incrociate e i commercianti erano sicuri che il trend positivo portasse
benefici a tutto il settore laniero.
Purtroppo, non è più così. Mentre le lane merinos in Australia, Nuova Zelanda, Sud Africa e
Sud America hanno riscontrato grandi richieste, in Inghilterra i prezzi delle lane più ordinarie
sono rimasti molto bassi per tutto l’anno, con un leggero aumento in estate, ma a fine anno
l’indicatore di mercato è quasi sullo stesso livello dell’inizio del 2018.
Inoltre la ―Brexit‖, che effettivamente ha svalutato la sterlina di oltre il 15 % in 2 anni, non ha
portato nessun beneficio agli allevatori.
Lane italiane
Con la buona richiesta di lane merinos, si spera che gli allevatori siano stimolati a migliorare sia
la qualità dei loro greggi sia il sistema di tosatura e della preparazione della tosa.
Situazione diversa per quanto riguarda la lana italiana ordinaria.
Negli ultimi anni varie associazioni di allevatori hanno creato una nuova nicchia di mercato
trasformando le lane autoctone in prodotti finiti.
La chiusura dell’ultimo lavaggio di lana italiana a Bergamo ha causato un blocco nella raccolta
della lana nella primavera 2018 e tanti allevatori si trovano ancora le lane nei magazzini, e la
nuova tosa è appena iniziata.
Ci sono stati tentativi di riaprire il lavaggio ma non hanno per ora avuto esito positivo.
L’ Europa e l’Italia in particolare, nel decennio scorso, ha visto buona parte degli impianti di
lavaggio e pettinatura, chiudere i battenti dopo ingenti investimenti per applicare le migliori
pratiche di responsabilità sociale e ambientale a causa della globalizzazione, della mancanza di
reciprocità e degli aiuti governativi dei paesi extraeuropei che producendo a basso costo hanno
reso non competitivo il prodotto fatto in Europa.
.
Corso Risorgimento Nr. 7 – 13900 Biella - Italia Tel./Fax +39 015 405 818 e-mail info@iwta.it32
BRITISH AND EUROPEAN WOOL
English wools
In the past, an increase in demand of merino wool had also a positive effects on half bred and
crossbred wool, traders were confident that the positive trend would benefit the entire wool
sector. Unfortunately this is no longer the case. Whilst the merino wools in Australia, New
Zealand, South Africa and South America have been in great demand, in England the prices
have remained very low throughout the year, with only a slight increase in the summer, but at
the end of the year the market indicator is almost on the same level as at the beginning of
2018.
More, "Brexit", which actually devalued pound by over 15% in 2 years, has not brought any
benefit to the farmers.
Italian wools
Good demand for merino wools, brings hope that breeders will be stimulated to improve the
quality of their flocks, and devote more efforts to shearing and preparing their "clip".
Coarse Italian wool is facing a very difficult situation. due to the closure of the last Italian wool
scourer in Bergamo that stopped the collection of wool in spring 2018, and many breeders
have still wool in the ware house when the new clip has just begun.
In the last years wool growers associations developed a new niche market sector with the
transformation of native wool into finished products that threaten to abandon for this reason.
Due to globalization, Europe and particularly Italy, in the last decade have seen most of the
scouring and combing plants to shut down after large investments to apply the best social
responsibility practices and to control and minimize negative environmental impacts.
The lack of reciprocity, the extra-European governments help their mills to make uncompetitive
the products made in Europe.
Corso Risorgimento Nr. 7 – 13900 Biella - Italia Tel./Fax +39 015 405 818 e-mail info@iwta.it33
MERCATO DELLE FIBRE SPECIALI
CASHMERE
Cina
Per quanto riguarda il mercato cinese del cashmere, la produzione annuale totale è stata di
circa 15.000 tonnellate di sucido e sono stati esportati 2.000 tons di ejarrato. La Cina produce
intorno al 60% del cashmere mondiale, contando 120 milioni di capre sui circa 700 milioni di
capi nel mondo.
Da Gennaio a Giugno 2018 l’esportazione totale di cashmere è stata 1.230 tons (+1.8% rispetto
al 2017) per un fatturato totale di 90 milioni di dollari americani (+17.8% rispetto al 2017).
Nei mesi di Gennaio e Febbraio, erano presenti sul mercato soltanto le rimanenze a stock della
stagione 2017, dato che la nuova stagione è iniziata soltanto a Marzo, partendo dalla regione
dello Shangxi. Il prezzo del cashmere a Marzo si aggirava attorno a 600 RMB/kg (circa 90
USD/kg). Ad Aprile, il nuovo cashmere è iniziato ad arrivare dalla Mongolia interna e dalle
regioni di Ningxia e Shanxi, ma il mercato si è mantenuto tranquillo dato che la maggior parte
dei compratori hanno atteso i primi movimenti di mercato.
Dopo la Festa dei Lavoratori del 1 Maggio, i prezzi sono cresciuti in maniera decisa,
raggiungendo il picco massimo alla fine di Giugno / inizio Luglio con 850 RMB/kg (127 USD/kg).
Una delle ragioni principali è stata la nuova regolamentazione del governo cinese che ha
emanato norme severe per la protezione dell’ambiente ed ha portato ad una diminuzione
dell’allevamento di capre.
Da Luglio a Settembre i prezzi hanno continuato a salire lentamente con un mercato stabile
senza grossi scossoni. Da Ottobre fino a fine anno gli stock sono andati esaurendosi.
Il mercato della filatura in cashmere è stato molto positivo sia per l’esportazione che per il
mercato domestico, supportando i prezzi delle materie prime.
In breve, la produzione di cashmere e il numero di capre sta leggermente diminuendo in Cina,
ma i prezzi sono saliti notevolmente rispetto al 2017. Per motivi legati ai mutamenti climatici il
cashmere fine è sempre meno e sempre più corto.
Mongolia
Il cashmere rappresenta il terzo prodotto per l’esportazione in Mongolia, dopo il rame e l’oro, e
fornisce guadagni ad oltre 100.000 persone, di cui il 90% sono donne e l’80% sono cittadini
sotto i 35 anni.
La Mongolia conta circa 27 milioni di capre sul suo territorio, con una produzione annuale di
circa 9.400 tonnellate di sucido.
L’anno scorso la Mongolia ha prodotto 5.413 tonnellate di cashmere lavato (90% della
produzione totale), 509 tonnellate di dejarrato e 915.000 capi di maglieria. I maggiori importatori
di cashmere dejarrato sono stati l’Italia (409.5 tonnellate), l’Inghilterra (50.5 tonnellate), la Cina
(38.4 tonnellate), la Germania (3.2 tonnellate) e il Giappone (1.3 tonnellate).
La maggior parte della produzione si concentra su materia prima semilavorata, mentre la
produzione di prodotti finiti rappresenta solo il 10%.
Questa stagione i pastori hanno venduto il loro cashmere ad un prezzo medio di 100.000-
110.000 MNT (42 USD), che equivale a circa 40.000 MNT (16 USD/kg) in più rispetto alla
stagione 2017.
La qualità del cashmere in Mongolia si è abbassata nel corso degli ultimi anni per colpa di una
mancanza di strategia a livello nazionale sul bestiame, disorganizzazione dei pascoli e
l’interesse dei pastori ad accrescere il numero dei capi invece che produrre cashmere di qualità.
Espandere le opportunità per l’esportazione di carne di capra incentiverebbe anche la
produzione di cashmere di alta qualità. Infatti se il prezzo della carne e dei pellami crescesse, i
pastori sarebbero maggiormente invogliati ad abbattere le capre maschie più anziane,
riducendo così la raccolta di cashmere ordinario di bassa qualità.
Corso Risorgimento Nr. 7 – 13900 Biella - Italia Tel./Fax +39 015 405 818 e-mail info@iwta.it34
Programma Cashmere
Il governo mongolo ha lanciato il Programma Cashmere a Febbraio 2018. Questo programma
quadriennale si focalizza sulla produzione nazionale di prodotti finiti in cashmere, innovazioni
tecnologiche ed un supporto finanziario per i produttori.
Ora che i processi di lavaggio e dejarratura sono stati notevolmente migliorati e sviluppati, il
programma si concentra sulle fasi successive della lavorazione: filatura, produzione di prodotti
da maglieria ed esportazione. In particolare l’idea principale è di consentire e favorire la
realizzazione di prodotti finiti in cashmere all’interno del paese e ridurre l’esportazione di
cashmere lavato, principalmente verso la Cina.
Il governo si aspetta che il programma possa aiutare a mantenere 5.500 posti di lavoro
nell’industria tessile e crearne 3.600 di nuovi.
- Dalla stagione 2019-2020 il governo ha in mente di utilizzare il 40% del cashmere sucido per
la produzione nazionale, migliorare la legislazione attuale sulla produzione e vendita di
cashmere, aumentare la produzione, promuovere la cooperazione tra le piccole aziende locali,
migliorare la reputazione del cashmere mongolo e rafforzare il sistema di raccolta delle materie
prime.
- Nella stagione 2020-2021 il governo pianifica di portare al 60% l’utilizzo del cashmere sucido
per il mercato nazionale e migliorare la qualità dei prodotti finiti in cashmere attraverso l’utilizzo
di tecnologie avanzate.
Nello specifico, l’industria per la pettinatura del cashmere riceverà un investimento di capitali da
parte del governo per 6/8 mesi mentre l’industria dei prodotti maglieria potrà ricevere
investimenti di capitali fino a 2 anni. Gli investimenti per lo sviluppo tecnologico verranno forniti
per un periodo non inferiore a 5 anni.
Iran
Nel 2018 il mercato iraniano del cashmere è stato fortemente influenzato dalla valuta locale
Rial, essendo stata soggetto della più grande svalutazione della storia del paese.
Il 2018 è iniziato con la moneta stabile e i prezzi del cashmere erano anch’essi fermi. Poco
dopo l’inizio della stagione a Marzo, la valuta è arrivata a perdere fino all’80% del suo valore,
con conseguente aumento verticale dei prezzi. Quando ad Ottobre il Rial ha iniziato a
riacquisire parte del suo valore, anche i prezzi sono tornati a scendere. Durante questo periodo
è stato stimato che più del 60% del cashmere iraniano è stato acquistato dai traders cinesi sia
direttamente, sia attraverso i loro agenti iraniani e afghani.
La produzione totale è rimasta invariata rispetto al 2017 e la quantità di cashmere si è attestata
attorno alle 1.000 tonnellate.
È stata prevista la stessa quantità di cashmere per il 2019 e la stessa struttura di acquisto.
Negli ultimi mesi il prezzo della carne è cresciuto fortemente ed il governo sta importando
sempre di più. In questa situazione i pastori sono tentati di vendere le proprie capre dato che il
rincaro sui prezzi della carne è maggiore rispetto a quello del cashmere. Se ciò dovesse
verificarsi assisteremo ad una drastica diminuzioni della disponibilità di cashmere sucido e
ovviamente ad aumenti dei prezzi.
Corso Risorgimento Nr. 7 – 13900 Biella - Italia Tel./Fax +39 015 405 818 e-mail info@iwta.it35
SPECIAL FIBERS MARKET
CASHMERE
China
As per Chinese Market for cashmere, it is about 15.000 tons in total production and exported
around 2.000 tons in dehaired cashmere in 2018. China produces around 60% of the cashmere
of the world. China counts for about 120 million of goats out of around 700 million in the world.
From January to June 2018 the total exporting of dehaired cashmere is around 1.230 tons
which has increased 1.8% compared to 2017, and the total amount is around 90 million USD,
17.8% more compared to 2017.
In January and February 2018, there was only stock materials since the cashmere came out
from March onwards (starting from Shangxi Province). The price of cashmere in March was
around 600RMB/KG. In April, the new cashmere started to come from Inner Mongolia, Ningxia,
Shanxi etc, but the market kept quiet since main buyers were waiting to see market moves.
After May 1st labour day, the price went up sharply. It was up to the peak at RMB850/KG at the
end of June/beginning of July. The reason was that the Chinese government issued very strict
rules on environment protection which led to a decreasing on goats breeding. At the same time
the cost of feeding materials went up a lot. Another point is that the price and demand on lamb
went up sharply in China. In this case, the numbers of goats got reduced a lot as well as
cashmere production.
From July to September, prices kept going up very slowly since the market had been stable
without big fluctuation. Until the end of year the stocks were basically over.
The business for cashmere yarn has been very positive both for exporting and domestic market.
This situation supported the market price.
All in all, the production of cashmere and goats in China is slightly reducing. The production in
2018 reduced and prices went up compared to 2017. Due to environment changing the fine
cashmere is less and less, with shorter length.
.
Mongolia
Cashmere is Mongolia’s third largest official export, after copper and gold, and provides income
to over 100.000 people, 90% of whom are women, and 80% are people below the age of 35.
Mongolia has an estimated total of 27 million goats and an annual cashmere production
capacity of 9.400 tons.
Last year, Mongolia produced 5.413 tons of washed cashmere (90% of total cashmere
production), 509 tons of dehaired cashmere, and 915.000 pieces of knitwear. Main importers of
dehaired cashmere are Italy – 409.5 tons, England- 50.5 tons, China- 38.4 tons, Germany-3.2
tons, Japan-1.3 tons.
The majority of production was first stage processing, with final product manufacturing only
accounting for 10%.
This spring, herders are selling their cashmere for an average price of 105.000-110.000 MNT/kg
(42 USD/kg), which is almost 40.000 MNT (16 USD/kg) higher than last year’s price.
The quality of raw cashmere in Mongolia has degraded over the years due to the lack of a
proper national strategy for livestock, health, disorganized breeding and herders’ interests to
grow goat population rather than produce high-quality products. Expanding opportunities for
goat meat exports would also incentivize higher quality cashmere. If the price of goat meat and
skin increases, herders would be more tempted to butcher their older and male goats — rather
than continue harvesting lower quality cashmere.
Corso Risorgimento Nr. 7 – 13900 Biella - Italia Tel./Fax +39 015 405 818 e-mail info@iwta.it36
The Cashmere Program
The government of Mongolia launched the Cashmere Program in February 2018. The four-year
program focuses on domestic production of final cashmere products, technological innovations,
and financial support for cashmere producers.
Now that washing and dehairing processes of cashmere production have been upgraded, the
program focuses on supporting the next stages: spinning process, yarn production, production
of knitted products, and exportation. In particular, its main idea is to keep domestically
producible cashmere, use it to make final products within the country, and reduce exportation of
washed cashmere to China.
The government expects the program to help keep 5.500 existing jobs in the textile industry,
while creating 3.600 new jobs.
- From 2019-2020 the government plans to use 40% of total raw cashmere in domestic
production, improve current legislation on cashmere production and sales, increase production
and export volumes through accurate financial support to businesses, promote clustering,
enhance reputations of Mongolian cashmere, and strengthen the preparation system of raw
materials.
- From 2020 to 2021 the government plans to use 60 percent of total raw cashmere, and
improve productivity and quality of final cashmere products using advanced technologies.
In specific, the cashmere combing industry will receive a working capital investment for six to
eight months, while knitting (final processing) will receive investment for up to two years. The
investment for technological innovation, will be provided for no less than five years.
Iran
In 2018 market of Iranian cashmere has been severely under the shadow of local money Rial,
being subject to strongest devaluation in its history.
2018 started with stable Rial and price of cashmere was steady. Soon after new season started,
currency lost up to 80% of its value and in accordance prices rose very sharply and as Rial
value gained some of its weight back from October, prices dropped too. During this period it is
estimated that more than 60% of Iranian cashmere was bought by Chinese traders directly or
through their Iranian and Afghan agents.
Production was unchanged and quantity of worthy cashmere is estimated around 1,000 tons.
It is expected the same quantity in 2019 and same buying structure. In recent months price of
meat has risen sharply and the government is importing a lot. If this is not sufficient the herders
will be tempted to sell goats for meat because the surge on meat price is a lot bigger than
cashmere. In that case we may witness a drop on quantity of raw cashmere and naturally price
will be higher.
Corso Risorgimento Nr. 7 – 13900 Biella - Italia Tel./Fax +39 015 405 818 e-mail info@iwta.it37
ALPACA
Il 2018 può essere archiviato come un altro anno molto attivo per l’Alpaca. Prezzi stabili per il
Baby e domanda robusta e prezzi in aumento per Superfine, Huarizo e Adulto. L’Alpaca è una
delle fibre più richieste dalla moda. Il consumo, particolarmente in Italia, è stato regolare
durante l’anno e ha raggiunto il picco da Giugno a Settembre quando si doveva addirittura far
arrivare la merce via aerea dal Perù per rispettare certe scadenze di consegna. Come si può
vedere dalle statistiche d’esportazione per il periodo Gennaio/Novembre 2018 l’Italia ha
aumentato l’importazione del 5,6% rispetto all’intero anno 2017. Meno coerente è stata la Cina
che aveva triplicato dal 2016 al 2017 ma diminuito del 24% (2017 vs. Gennaio/Giugno 2018).
La tosa è probabilmente aumentata fino a circa 6,5 milioni di chili di pettinato. Si stima che circa
1,2 milioni di chili siano stati esportati come filato nel 2018. Resta quindi ancora una cifra
importante di 1,3 milioni di chili che sono stati consumati dal mercato domestico Peruviano.
L’Alpaca Fiesta ha avuto luogo ad Arequipa in Ottobre ed ha, ancora una volta, dimostrato
d’essere un veicolo promozionale molto importante per l’industria.
Il Suri è stata l’unica tipologia rimasta stabile durante l’anno e i prezzi non sono oscillati molto.
Le pettinature hanno lavorato a piena capacità durante l’anno e gli avanzi di stock sono bassi.
L’esportazione di filato ha visto la Norvegia come top performer, quasi raddoppiando le
importazioni da 240t nel 2017 a 454t (Gen/Nov 2018), l’Italia 120t nel 2017 contro131t Gen/Nov
2018, gli Stati Uniti 103t nel 2017 contro 96T Gen/Nov 2018, la Svezia 96t nel 2017 contro 88t
Gen/Nov 2018 e la Corea 49t nel 2017 contro 54t Gen/Nov 2018. Altre destinazioni: 260t nel
2017 contro 232t Gen/Nov 2018.
Totale 908t nel 2017 contro 1055t Gennaio/Novembre 2018.
Le destinazioni per l’esportazioni sono state le seguenti:
2016 2017 2018 (Gen/Nov)
Cina 1244t 3326t 2524t
Italia 1012t 1059t 1122t
Gran Bretagna 78t 86t 97t
Giappone 65t 71t 67t
Corea 161t 55t 63t
Altri 202t 150t 262t
Totale: 2762t 4747t 4135t
I prezzi dell’Alpaca sono ancora relativamente alti ma ancora molto competitivi se paragonati ad
altre fibre naturali. Le aspettative per il 2019 sono positive e, considerando la tendenza verso
materiali sostenibili ed ecologici, rimane molto potenziale per questa fibra nel futuro.
Corso Risorgimento Nr. 7 – 13900 Biella - Italia Tel./Fax +39 015 405 818 e-mail info@iwta.it38
ALPACA
2018 can be filed as yet another very active year for Alpaca. Stable prices for Baby and robust
demand and increasing prices for Superfine, Huarizo and Adults. Alpaca has been one of the
most requested fibres in fashion.The consumption, particularly in Italy, has been regular during
the year and reached moments of urgency from June to September where goods even had to
be flown in from Perù in order to meet specific deadlines. As can be seen from the export
figures covering the period January/November 2018 Italy increased the imports by 5,6%
compared to the whole year 2017. Less consistent was China which tripled from 2016 to 2017
but decreased with 24% (2017 vs. Jan/Nov. 2018).
The clip has probably increased to approx. 6,5 million kgs of tops. It is estimated that approx.
1,2 million kgs were exported as yarn for 2018. This leaves still an important figure of 1,3t which
was consumed domestically in Perù. The Alpaca Fiesta was held in Arequipa in October and
proved again to be an important promotional vehicle for the industry.
Suri has been the only type performing with stability during the year and prices have not
oscillated very much.
The combing mills have been working at full capacity during the year and carry over of stock is
reported to be low.
Yarn exports saw Norway top performer with almost doubling the imports from 240t in 2017 to
454t (Jan/Nov 2018), Italy 120t in 2017 vs. 131t Jan/Nov 2018, United States 103t in 2017 vs.
96t Jan/Nov 2018, Sweden 96t in 2017 vs. 88t Jan/Nov 2018 and Korea 49t in 2017 vs. 54t
Jan/Nov 2018. Others 260t 2017 vs. 232t Jan/Nov 2018.
Total 908t in 2017 against 1055t Jan/Nov. 2018.
Corso Risorgimento Nr. 7 – 13900 Biella - Italia Tel./Fax +39 015 405 818 e-mail info@iwta.itPuoi anche leggere