WP5 - Identification of river corridors and definition of indicators of human-induced pressure for the Autonomous Province of Bolzano - South Tyrol
←
→
Trascrizione del contenuto della pagina
Se il tuo browser non visualizza correttamente la pagina, ti preghiamo di leggere il contenuto della pagina quaggiù
WP5 – Identification of river corridors and
definition of indicators of human-induced
pressure for the Autonomous Province of
Bolzano - South Tyrol
- VERSION 1
- Bolzano/Bozen, 2014
Autonomous Province of Bolzano - South Tyrol, Department of
          Hydraulic Engineering • Ripartizione 30, Via Cesare Battisti 23 • 39100
          Bolzano, Italy
          Bruno Mazzorana • T: +39 0471 414567 • F: +39 0471 0414599 •
          Bruno.Mazzorana@provincia.bz.it

WP5 – Identification of river corridors and definition of
indicators of human-induced pressure for the Autonomous
Province of Bolzano - South Tyrol
- VERSION 1 -

                    State-of-the-Art in Risk Management Technology: Implementation and Trial for
        Project:
                    Usability in Engineering Practice and Policy
                    Ingegneri Patscheider & Partner Srl
        Authors:    Dr. Ing. Walter Gostner
                    Dr. Ing. Matilde Welber
                    Autonomous Province of Bolzano - South Tyrol, Department of Hydraulic
     Institution:
                    Engineering
           Date:    June 2014

                                                                                                   2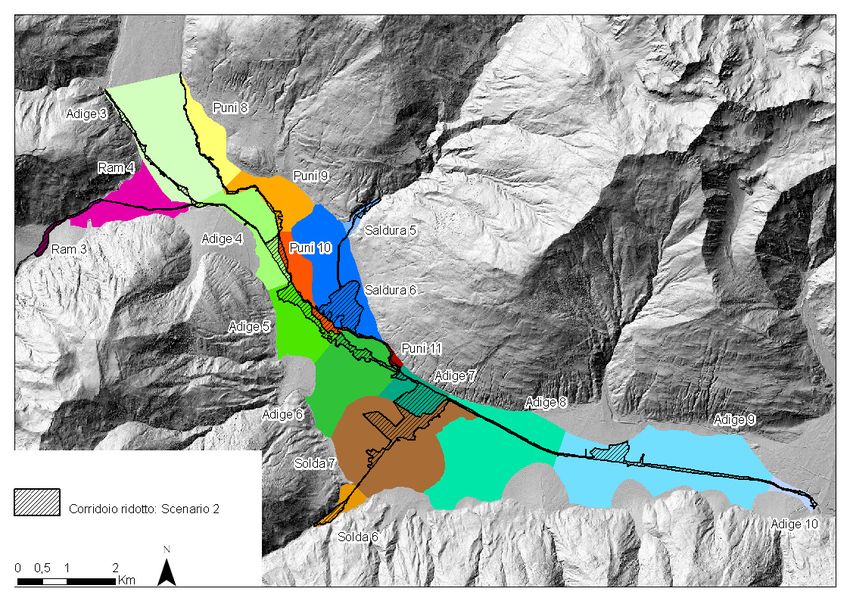
Autonomous Province of Bolzano - South Tyrol, Department of
           Hydraulic Engineering • Ripartizione 30, Via Cesare Battisti 23 • 39100
           Bolzano, Italy
           Bruno Mazzorana • T: +39 0471 414567 • F: +39 0471 0414599 •
           Bruno.Mazzorana@provincia.bz.it

DELIVERABLE SUMMARY

                                  PROJECT INFORMATION
            Project acronym:      START_it_uP
                Project title:    State-of-the-Art in Risk Management Technology: Implementation and
                                  Trial for Usability in Engineering Practice and Policy
           Contract number:       11-5-3-AT
              Starting date:      September 2013
                Ending date:      November 2014
    Project website address:      http://startit-up.eu/
  Lead partner organisation:      Federal Ministry of Agriculture, Forestry, Environment and Water
                                  Management, Dep. IV/5 - Torrent and Avalanche Control Service, Austria
                     Address:     Marxergasse 2, 1030 Vienna
            Project manager:      Florian Rudolf-Miklau
                      E-mail:     florian.rudolf-miklau@lebensministerium.at

                                  DELIVERABLE INFORMATION
     Title of the deliverable:    Identification of river corridors and definition of indicators of human
                                  pressure for the Autonomous Province of Bolzano - South Tyrol
                   WP/activity    Standards and Best Practice
   related to the deliverable:    WP5/ Activity 5.3
                          Type:   Public
                    WP leader:
               Activity leader:
     Participating partner(s):
                    Author(s):    Ingegneri Patscheider & Partner Srl
                                  Dr. Ing. Walter Gostner
                                  Dr. Ing. Matilde Welber
                       E-mail:    w.gostner@ipp.bz.it

                   Keywords:      fluvial corridors, human-induced pressures

This report should be cited in
      bibliography as follows:

                                                                                                            3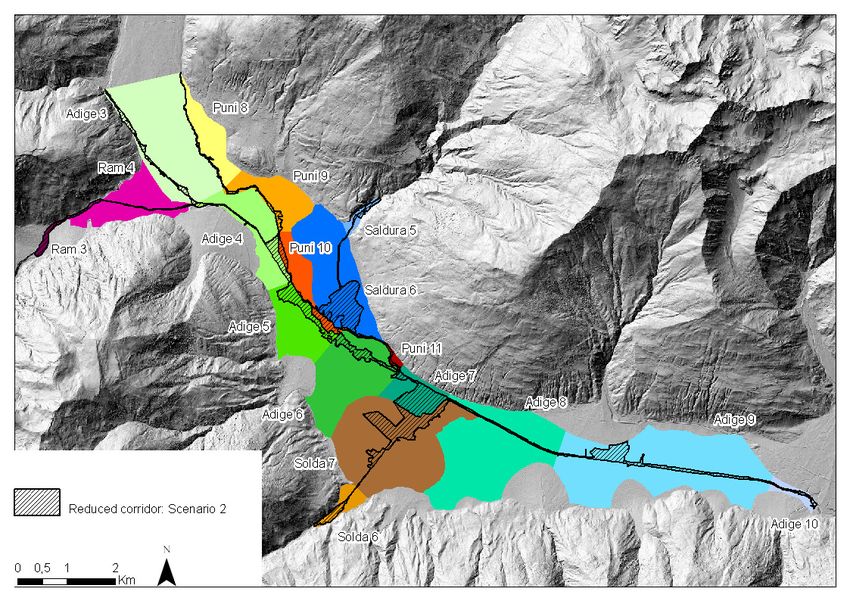
Autonomous Province of Bolzano - South Tyrol, Department of
           Hydraulic Engineering • Ripartizione 30, Via Cesare Battisti 23 • 39100
           Bolzano, Italy
           Bruno Mazzorana • T: +39 0471 414567 • F: +39 0471 0414599 •
           Bruno.Mazzorana@provincia.bz.it

CONTENT

ENGLISH VERSION                                                                       5
1     Introduction / study goals                                                      5
2     Study area                                                                      5
3     Methods                                                                        6
3.1   Overview                                                                       6
3.2   Map database                                                                    7
3.3   Identification of fluvial corridors                                             7
3.4   Segmentation of fluvial corridors                                               7
3.5   Definition of indicators of human pressure                                     8
3.6   Identification of "reduced" river corridors                                    8
4     Results                                                                        9
5.1   Documentation of results                                                       9
5.2   Example of outputs: the Adige River                                            9
5.3   "Reduced" river corridors in the upper Adige valley                            11

VERSIONE ITALIANA                                                                    13
1     Introduzione / obiettivi dello studio                                          13
2     Area di studio                                                                 13
3     Metodi                                                                         14
3.1   Introduzione                                                                   14
3.2   Database cartografico                                                          15
3.3   Identificazione dei corridoi fluviali                                          15
3.4   Suddivisione in segmenti                                                       15
3.5   Definizione degli indicatori di pressione antropica                            16
3.6   Identificazione dei corridoi fluviali ridotti                                  16
4     Risultati                                                                      17
5.1   Documentazione                                                                 17
5.2   Esempio: risultati relativi al fiume Adige                                     17
5.3   Corridoi fluviali ridotti per l'alto corso del fiume Adige                     19

                                                                                          4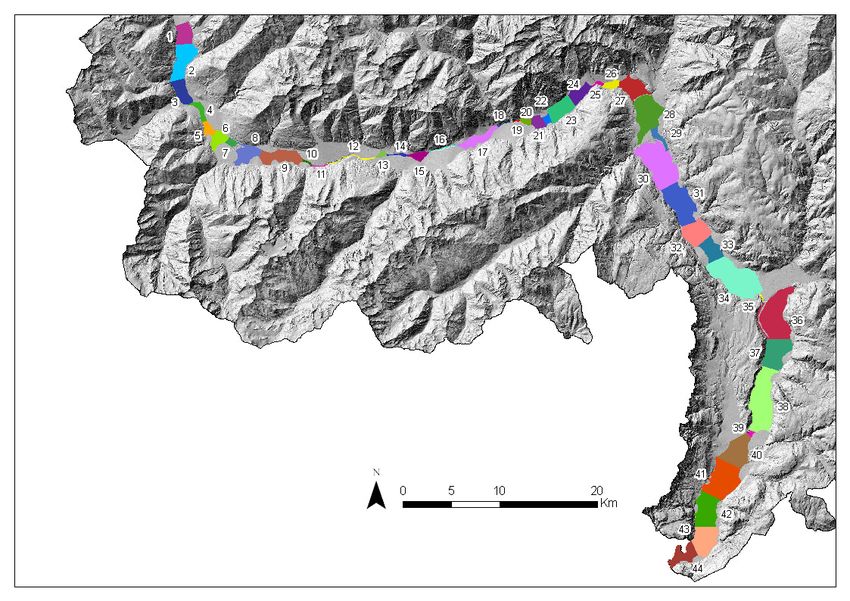
English version

ENGLISH VERSION
1      INTRODUCTION / STUDY GOALS
The purpose of the present study is the definition of a conceptual framework for the identification and analysis
of river corridor areas and the assessment of human-induced pressures on fluvial systems.
The main goals of the study are:
•   developing GIS-based criteria and procedures for the identification of river corridor areas and the
    segmentation of corridors into morphologically homogenous subreaches;
•   defining and applying indicators for the quantification of the intensity of human-induced pressures on river
    corridor areas;
•   assessing the reduction in potential river corridor area caused by the presence of major human-induced
    constraints (settlements, transport infrastructures and agricultural areas).

2      STUDY AREA
The study area covers the entire territory of the Autonomous Province of Bolzano - South Tyrol and belongs to
the Adige/Etsch River basin, with the exception of a small area located in the eastern part that corrresponds to
the headwater sections of the Drava River/Draufluss. The Isarco/Eisack River, the main tributary of the Adige
River, drains approximately one half of the study area.
The analysis was carried out on all major rivers and streams within the study area, for a total of 29 water bodies
and a cumulative length of approximately 710 km (see Image 1 and Table 1). For each river, a study reach was
identified on the basis of the following criteria:
•   drainage area larger than approximately 25.000 m2, or
•   presence of major settlements or transport infrastructures in the valley floor.

Image 1:
Overview of the study
area and the studied
river reaches .

                                                                                                                     5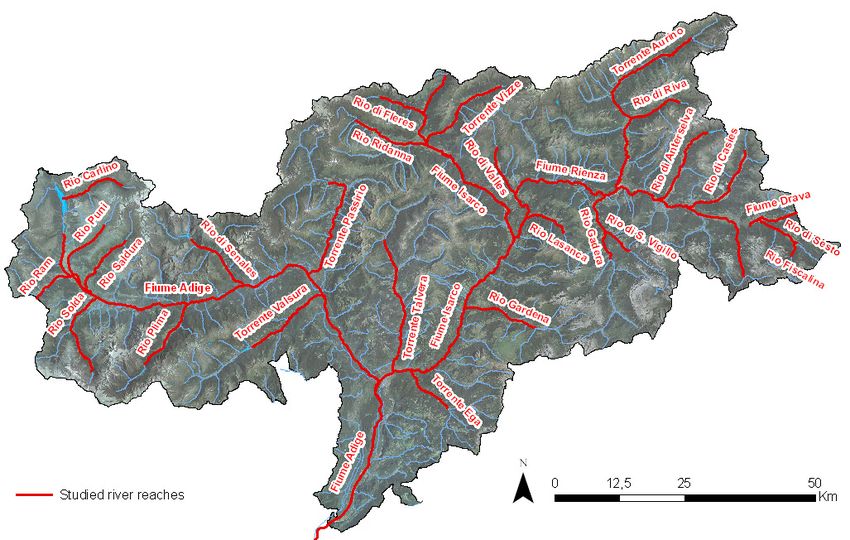
Versione italiana

Table 1: Summary of studied river reaches.
                                                                                Study        Mean        Total        Mean
                                                                     Sub-
                           Water Body                                            reach     subreach     corridor     corridor
                                                                   reaches
                                                                                length      length        area        width
                                                                     [n°]         [km]       [km]        [km2]         [km]
    A          Fiume Adige             Etsch                         44         119.4         2.71       173.08        1.45
    A.230      Rio di Senales          Schnalserbach                  9          15.2         1.68        1.52         0.10
    A.285      Rio Plima               Plimabach                      8          16.3         2.04        4.17         0.26
    A.400      Rio Solda               Suldenbach                     7          19.0         2.72        5.22         0.27
    A.410      Rio Puni                Punibach                      11          20.0         1.82        3.05         0.15
    A.410.5    Rio Saldura             Saldurbach                     6          14.7         2.45        2.88         0.20
    A.420      Rio Ram                 Rambach                        4           8.8         2.20        1.68         0.19
    A.505      Rio Carlino             Karlinbach                     7          13.8         1.97        1.15         0.08
    B          Fiume Isarco            Eisack-Fluss                  46          96.9         2.11       24.87         0.26
    B.25       Torrente Ega            Eggentalerbach                 6          12.6         2.11        0.73         0.06
    B.600      Rio Ridanna             Mareiterbach                  10          16.1         1.61        4.56         0.28
    B.605      Torrente Vizze          Pfitscherbach                 10          20.6         2.06        7.04         0.34
    B.650      Rio di Fleres           Pflerscherbach                 6           9.4         1.57        1.43         0.15
    C          Fiume Rienza            Rienzfluss                    37          77.2         2.09       15.35         0.20
    C.335      Rio di Anterselva       Antholzerbach                  8          18.4         2.31        4.78         0.26
    C.35       Rio Lasanca             Lasankenbach                   5           9.7         1.94        1.42         0.15
    C.370      Rio di Casies o Pudio   Gsieserbach                   11          18.5         1.68        5.35         0.29
    C.80       Rio di Valles           Vallerbach                     6          11.0         1.83        1.11         0.10
    D          Torrente Aurino         Ahrnbach (die Ahr)            19          44.5         2.34       12.69         0.28
    D.150      Rio di Riva             Reinbach                       5          11.3         2.25        1.29         0.11
    E          Rio Gadera              Gaderbach                      5          16.6         3.31        1.67         0.10
    E.80       Rio di S.Vigilio        St. Vigilbach                  3           7.0         2.32        0.36         0.05
    F          Torrente Talvera        Talfer-Bach (die Talfer)      13          30.2         2.32       11.52         0.38
    G          Torrente Passirio       Passer-Bach (die Passer)      15          24.4         1.62        4.51         0.18
    H          Torrente Valsura        Valschauerbach                 7          21.3         3.05        2.97         0.14
    I          Rio Gardena             Grödnerbach                    6          16.0         2.66        0.99         0.06
    J          Fiume Drava             Draufluss                      6          10.5         1.75        2.92         0.28
    J.105      Rio di Sesto            Sextnerbach                    8          10.1         1.27        0.62         0.06
    J.105.40   Rio Fiscalina           Fischleintalbach               2           3.5         1.73        0.15         0.04
    TOTAL                                                            330        712.9         2.16       299.1         0.42

3         METHODS
3. 1 OV E RV I E W
A GIS-based procedure for the identification and analysis of river corridor areas was defined in accordance with
the IDRAIM methodological framework (Italian stream hydromorphological evaluation, analysis and monitoring
system, Rinaldi et al., 20111).
The procedure is structured as follows:
•      Step 1: digitalisation of river corridor boundaries;
•      Step 2: segmentation of river corridors into morphologically homogenous subreaches;
•      Step 3: evaluation of land use and presence of settlements and transport infrastructures for each subreach;
•      Step 4: digitalisation of "reduced" river corridors on the basis of human-induced constraints.

1
 Rinaldi M., Surian N., Comiti F., Bussettini M. 2011, MANUALE TECNICO – OPERATIVO PER LA VALUTAZIONE ED IL MONITORAGGIO DELLO
STATO MORFOLOGICO DEI CORSI D’ACQUA – Versione 1, Istituto Superiore per la Protezione e la Ricerca Ambientale, Roma, 232 pp.
                                                                                                                                 6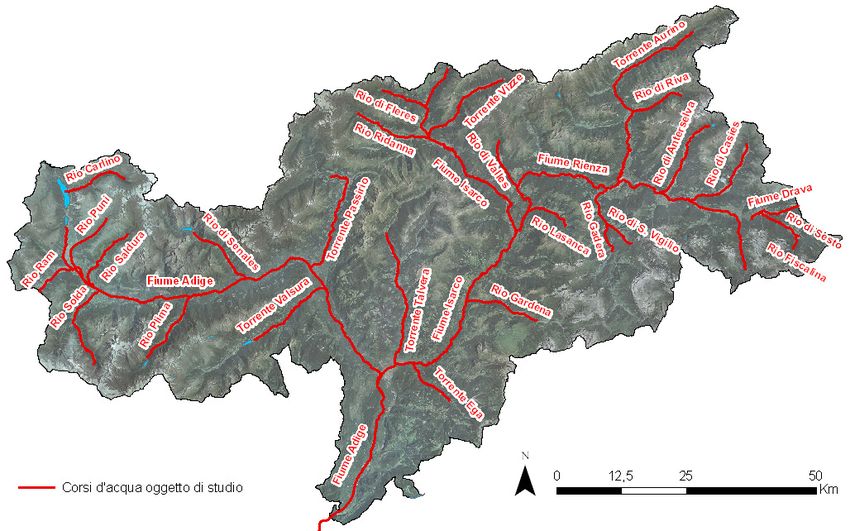
Versione italiana

3. 2 M A P DA TA B A SE
The map database used for the present study was provided by the Autonomous Province of Bolzano - South
Tyrol and comprises the following data:
•   geological map 1:50.000 and 1:100.000;
•   hillshade map 1 px = 2.5 m (2006);
•   orthoimages 1 px = 2.5 m (2011);
•   historical maps: Franziszeische Landesaufnahme 1:28000 (1820) and Culturen – Skelett – Karte 1:36000
    (1856);
•   vector land use map (2000);
•   vector map of settlements/hamlets (2009);
•   vector map of transport infrastructures (2011).

3. 3 I DE N TI FI C A TI ON OF FL U V I A L C ORRI D ORS
For the present study, river corridor area was defined as the maximum potential width of the fluvial area of
investigation. This area, usually referred to as the alluvial plain, corresponds to recent or Holocene alluvium
zones found in the valley floors.
As a first step, the alluvial plain was identified on the geological map as Class 1.1.a "Alluvioni recenti ed attuali,
talora terrazzate / Rezente fluviatile Sedimente: Alluvionen, rezent und aktiv, teilweise Terrassen".
In accordance with IDRAIM guidelines and given the relatively low spatial resolution of geological data,
additional information was used for a more accurate tracing of corridor boundaries. In particular, the following
criteria were defined and applied to the whole study area:
•   the river corridor always includes the current riverbed, defined as the wetted area identifiable on
    orthoimages. This criterion was applied in particular to include narrow gorges and headwater sections
    where the width of the riverbed is too small to appear on the geological map. Moreover, this condition was
    applied to confluences to define the boundary between river corridor areas pertaining to different water
    bodies;
•   areas classified as recent alluvium but corresponding to hillslopes (as detected on the hillshade map) were
    excluded from corridors;
•   riverbed areas identified on historical maps were added to the corridor, provided that these zones do not
    extend beyond the limits of the valley floor. It is worth noting that historical maps, while providing valuable
    information on past river bed configurations, are intrinsically less accurate than present-day data. This
    criterion was applied in particular to identify the boundaries between river corridors around confluences.

3. 4 SE G M E N TA TI ON OF FL U V I A L C ORRI DO RS
River corridor areas were divided into morphologically homogenous subreaches in according with the IDRAIM
methodological framework. Study reaches were divided into segments on the basis of the following aspects:
•   changes in the degree of confinement;
•   major discontinuities in bed morphology;
•   natural and artificial hydrological discontinuities, including major tributaries and lakes/reservoirs;
•   discontinuities in bed substrate, represented in particular by the presence/absence of recent alluvium as
    reported in the geological map.
                                                                                                                         7
Versione italiana
Moreover, for streams ending with an alluvial fan, a subreach was defined as the area extending from the fan
apex to the confluence. Finally, separate subreaches were defined for lakes and reservoirs falling within the
study reach, but these reaches were excluded from further analyses.
Overall, a total of 330 subreaches were defined. Subreach length ranges from approximately 500 m to 7 km, with
a median value of 1.84 km while the interquartile range is 1.14 to 2.87 km. The longest subreaches are
represented by narrow gorges without significant discontinuities (as for example the downstream part of the
Rienza River/ Rienzfluss).
Subreaches are numbered in the downstream direction.
3. 5 DE FI N I TI ON OF I N D I C A TORS OF HU M A N P RE SSU RE
In order to quantify the intensity of human-induced impacts on the riverscape, three spatial-based indicators
were defined, namely i) land use distribution; ii) area of settlements; and iii) length of transport infrastructures.
With respect to land use, six major land use classes were defined for the present study:
• Residential areas (code 11000);
• Industrial, commercial and transport areas (codes 12000 to 16000);
• Agricultural land (code 21000, 22000, 25000);
• Grassland and pasture (code 32000);
• Forest and open areas (code 31000, 41000, 42000, 43000);
• Humid areas and waters (codes 51000 and 52000).
With respect to transport infrastructures, four classes were taken into account, namely motorways
("Autostrada/Autobahn"), state highways ("Strada statale/Staatsstrasse"), provincial roads ("Strada
provinciale/Landesstrasse") and railways ("Ferrovia/Eisenbahn").
The indicators were computed by intersecting source maps (land use map, settlements map and vector map of
transport infrastructures) with the vector map of river corridor subreaches.
3. 6 I DE N TI FI C A TI ON OF "RE DU C E D" RI V E R C ORRI DO RS
The impact of human presence on the riverscape was also evaluated as the portion of river corridor that in the
present state can be considered unavailable for river restoration due to intense anthropic exploitation
(presence of settlements, transport infrastructures and intensive agriculture). Two different scenarios have
been evaluated on the basis of land use:
• Scenario 1: areas excluded from river corridors comprise residential and industrial/commercial/transport
surfaces;
• Scenario 2: areas excluded from river corridors comprise all areas already included in Scenario 1, plus
agricultural surfaces.
Moreover, for both scenarios any surface that is separated from the current riverbed by an excluded area is also
considered unavailable for river restoration (regardless of land use).
Finally, human-induced pressures were assessed as the ratio between "reduced" river corridors identified for
the two scenarios and the corresponding "unconstrained" or total river corridor areas.
8Versione italiana
4 RESULTS
5. 1 DOC U M E N TA TI ON OF RE SU L TS
Steps 1 to 3 of the GIS procedure defined in the present study were applied to the whole study area, while the
identification of "reduced" river corridors (Step 4) was carried out on a smaller zone covering the upstream part
of the Adige River valley.
The complete documentation study outputs is provided in the attached CD. Study outputs include the following
map products covering the entire study area:
• map of study reaches (Shapefile, polyline);
• map of river corridors and subreaches (Shapefile, polygon);
• land use map within river corridor area;
• map of settlements and hamlets within river corridor area;
• map of transport infrastructures within river corridor area.
Moreover, for the upper Adige case study area, maps of reduced river corridors are available. Finally, indicators
of human-induced pressure for each river subreach are summarized in table form.
5. 2 E X A M P LE OF OU TP U TS: THE A DI G E RI V E R
In the following, an example of study outputs for the Adige River is presented. The study reach extends from the
S. Valentino alla Muta lake / Haidersee to the southern border of the Province, for a total length of 119 km. The
river corridor covers an area of approximately 173 km2 and was divided into 44 subreaches (see Image 2).
Images 3 to 5 provide a summary of human-induced pressure indicators for the Adige River.
Image 2:
Adige River corridor
and segmentation
into subreaches .
9Versione italiana
Image 3:
Total subreach area
and land use
distribution for all
subreaches.
Image 4:
Extent of transport
infrastructures within
the river corridor.
Image 5:
Extent of settlements
within the river
corridor.
10Versione italiana
A few considerations can be derived from the analysis of GIS outputs:
• the large variability of subreach area is a direct consequence of segmentation criteria and reflects in
particular the marked changes in the degree of confinement observed along the river;
• land use distribution clearly shows the dominant role of agriculture within river corridor area. Intensive
production of apples is widespread in the whole area especially from reach 8 onwards, while vineyards are
present in the piedmont section (subreaches 39 to 44);
• natural vegetation cover is relevant in the uppermost sections (subreaches 4 to 7) and almost negligible in
the lower sections. It is worth noting that the proportion of natural cover peaks in narrow, confined reaches
where the river corridor essentially comprises the riverbed plus a limited band of riparian vegetation (see
for example subreaches 11, 16 and 35);
• peaks in residential area occur especially for subreaches 10 (corresponding to Lasa/Laas), 15
(Tarces/Tarsch), 20 (Naturno/Naturns) and 26 to 28 (including parts of Lagundo/Algund, Merano/Meran and
Marlengo/Marling). Similar observations can be derived from the settlements map;
• major transport infrastructures exist within the river corridor and in particular the A22 motorway and the
Brenner railway are located within the river corridor from reach 36 onwards. A significant presence of
communication routes occurs also between Merano/Meran and Bolzano/Bozen (reaches 27 to 35) while the
Val Venosta/Vinschgau railway extends upstream up to reach 3.
5. 3 "RE DU C E D" RI V E R C ORRI DORS I N THE U P P E R A DI G E V ALL E Y
"Reduced" river corridors were defined for a smaller study area covering the Adige River valley between
Clusio/Schleis and Lasa/Laas. The study area includes reaches 3 to 10 of the Adige River as well as the terminal
reaches of four tributaries (Rio Ram/Rambach, Rio Puni/Punibach, Rio Saldura/Saldurbach, Rio
Solda/Suldenbach).
"Reduced" corridor areas were identified according to the procedure detailed in the methods section of the
present study. The ratio between "reduced" and entire corridor area for all subreaches is shown in Image 6 and
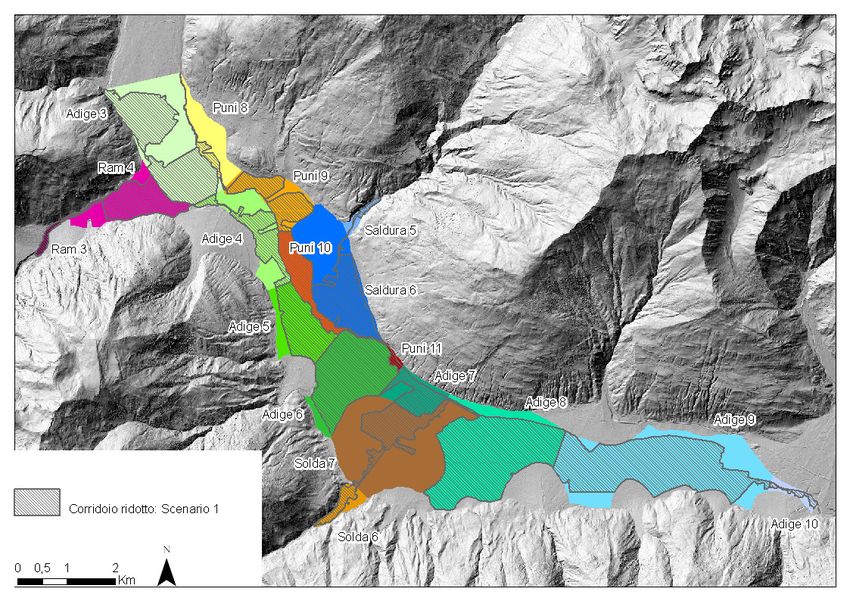
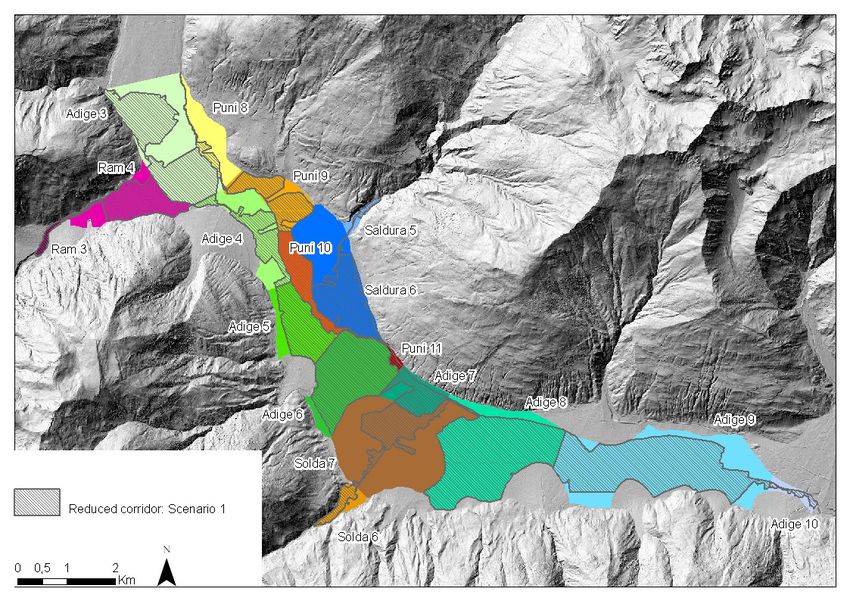
results are show in map form in Images 7 and 8.
It is possible to observe that the presence of settlements and transport infrastructures (Scenario 1) causes a
reduction in corridor area usually ranging from 50 to 90% of the original value, with stronger limitations in reach
10 of the Adige River, reach 7 of Rio Solda/ Suldenbach (flowing through Prato allo Stelvio/Prad) and reach 8 of
Rio Puni/Punibach (flowing through Malles/Mals). If agricultural areas are also taken into account (Scenario 2), a
much stronger reduction is observed especially for reaches 3 to 6 of the Adige River and reach 4 of Rio
Ram/Rambach.
Image 6:
Ratio between
reduced and
entire corridor
area.
11Versione italiana
Image 7:
Reduced river
corridors:
Scenario 1
Image 8:
Reduced river
corridors:
Scenario 2
Bolzano/Bozen, 19.04.2014 The editor
12Versione italiana
VERSIONE ITALIANA
1 INTRODUZIONE / OBIETTIVI DELLO STUDIO
Lo scopo del presente studio è la definizione di un quadro concettuale per l'identificazione e l'analisi dei
corridoi fluviali e la valutazione della pressione antropica sui sistemi fluviali.
I principali obiettivi dello studio sono:
• lo sviluppo di criteri e procedure basati su sistemi GIS per l'identificazione e dei corridoi fluviali e la
suddivisione degli stessi in segmenti morfologicamente omogenei;
• la definizione e l'applicazione di indicatori per la quantificazione dell'intensità delle pressioni antropiche
sui corridoi fluviali;
• la valutazione della riduzione del corridoio fluviale potenziale causata dalla presenza di rilevanti vincoli di
origina antropica (insediamenti, infrastrutture di trasporto e aree agricole).
2 AREA DI STUDIO
L'area di studio copre l'intero territorio della Provincia Autonoma di Bolzano - Südtirol e appartiene al bacino
idrografico del fiume Adige/Etsch, ad eccezione di una piccola area situata nella parte orientale della provincia
che corrisponde all'alto corso del fiume Drava/Draufluss. Il fiume Isarco/Eisack, il principale affluente del fiume
Adige, drena circa metà dell'area di studio.
L'analisi è stata condotta su tutti i principali fiume e torrenti all'interbno dell'area di studio, per un totale di 29
corsi d'acqua e una lunghezza totale di circa 710 km (Vedi Figura 1 e Tabella 1). Per ogni corso d'acqua è stato
identificato un tratto di studio sulla base dei seguenti criteri:
• bacino sotteso superiore a circa 25.000 m2, oppure
• presenza di rilevanti insediamenti o infrastrutture di trasporto nel fondovalle.
Immagine 1:
Corografia dell'area
di studio e mappa
dei tratti di corso
d'acqua oggetto di
studio
13Versione italiana
Tabella 1: Riassunto dei tratti di corso d'acqua oggetto di studio
Lunghezza Lunghezza Larghezza
Area totale
Corso d'acqua Segmenti tratto di media media
corridoio
studio segmento corridoio
[n°] [km] [km] [km2] [km]
A Fiume Adige Etsch 44 119.4 2.71 173.08 1.45
A.230 Rio di Senales Schnalserbach 9 15.2 1.68 1.52 0.10
A.285 Rio Plima Plimabach 8 16.3 2.04 4.17 0.26
A.400 Rio Solda Suldenbach 7 19.0 2.72 5.22 0.27
A.410 Rio Puni Punibach 11 20.0 1.82 3.05 0.15
A.410.5 Rio Saldura Saldurbach 6 14.7 2.45 2.88 0.20
A.420 Rio Ram Rambach 4 8.8 2.20 1.68 0.19
A.505 Rio Carlino Karlinbach 7 13.8 1.97 1.15 0.08
B Fiume Isarco Eisack-Fluss 46 96.9 2.11 24.87 0.26
B.25 Torrente Ega Eggentalerbach 6 12.6 2.11 0.73 0.06
B.600 Rio Ridanna Mareiterbach 10 16.1 1.61 4.56 0.28
B.605 Torrente Vizze Pfitscherbach 10 20.6 2.06 7.04 0.34
B.650 Rio di Fleres Pflerscherbach 6 9.4 1.57 1.43 0.15
C Fiume Rienza Rienzfluss 37 77.2 2.09 15.35 0.20
C.335 Rio di Anterselva Antholzerbach 8 18.4 2.31 4.78 0.26
C.35 Rio Lasanca Lasankenbach 5 9.7 1.94 1.42 0.15
C.370 Rio di Casies o Pudio Gsieserbach 11 18.5 1.68 5.35 0.29
C.80 Rio di Valles Vallerbach 6 11.0 1.83 1.11 0.10
D Torrente Aurino Ahrnbach (die Ahr) 19 44.5 2.34 12.69 0.28
D.150 Rio di Riva Reinbach 5 11.3 2.25 1.29 0.11
E Rio Gadera Gaderbach 5 16.6 3.31 1.67 0.10
E.80 Rio di S.Vigilio St. Vigilbach 3 7.0 2.32 0.36 0.05
F Torrente Talvera Talfer-Bach (die Talfer) 13 30.2 2.32 11.52 0.38
G Torrente Passirio Passer-Bach (die Passer) 15 24.4 1.62 4.51 0.18
H Torrente Valsura Valschauerbach 7 21.3 3.05 2.97 0.14
I Rio Gardena Grödnerbach 6 16.0 2.66 0.99 0.06
J Fiume Drava Draufluss 6 10.5 1.75 2.92 0.28
J.105 Rio di Sesto Sextnerbach 8 10.1 1.27 0.62 0.06
J.105.40 Rio Fiscalina Fischleintalbach 2 3.5 1.73 0.15 0.04
TOTALE 330 712.9 2.16 299.1 0.42
3 METODI
3. 1 I N TRODU Z I ON E
La procedura basata su sistema GIS per l'identificazione e l'analisi dei corridoi fluviali è stata definita sulla base
della metodologia IDRAIM (Sistema di valutazione idromorfologica, analisi e monitoraggio dei corsi d'acqua,
Rinaldi et al., 20111).
La procedura si struttura come segue:
• Step 1: digitalizzazione dei confini dei corridoi fluviali;
• Step 2: suddivisione dei corridoi in segmenti morfologicamente omogenei;
• Step 3: valutazione degli usi del suolo e della presenza di insedimenti e infrastrutture in ogni segmento;
• Step 4: digitalizzazione di corridoi "ridotti" sulla base di vincoli di origine antropica.
11
Rinaldi M., Surian N., Comiti F., Bussettini M. 2011, MANUALE TECNICO – OPERATIVO PER LA VALUTAZIONE ED IL MONITORAGGIO DELLO
STATO MORFOLOGICO DEI CORSI D’ACQUA – Versione 1, Istituto Superiore per la Protezione e la Ricerca Ambientale, Roma, 232 pp.
14Versione italiana
3. 2 DA TA B A SE C A RTOG RA FI C O
la base dati cartografica utilizzata per il presente studio è stata fornita dalla Provincia Autonoma di Bolzano -
Südtirol e si compone delle seguenti carte:
• carta geologica 1:50.000 and 1:100.000;
• mappa hillshade 1 px = 2.5 m (2006);
• ortofoto 1 px = 2.5 m (2011);
• carte storiche: Franziszeische Landesaufnahme 1:28000 (1820) e Culturen – Skelett – Karte 1:36000 (1856);
• carta vettoriale degli usi del suolo (2000);
• carta vettoriale degli insediamenti (2009);
• carta vettoriale delle infrastrutture di trasporto (2011).
3. 3 I DE N TI FI C A Z I ON E DE I C ORRI DOI FL U V I A L I
Nel presente studio i corridoi fluviali sono stati definiti come la massima larghezza potenziale della regione
fluviale di indagine. Questa superficie, usualmente definita pianura alluvionale, corrisponde alle alluvioni attuali
od oloceniche che occupano le aree di fondovalle.
Come primo passo, la pianura alluvionale è stata identificata con le aree indicate nella carta geologica come
"Alluvioni recenti ed attuali, talora terrazzate / Rezente fluviatile Sedimente: Alluvionen, rezent und aktiv,
teilweise Terrassen" (Classe 1.1.a).
In conformità con la procedura IDRAIM e in ragione della limitata risoluzione spaziale dei dati geologici, sono
stati utilizzati ulteriori dati per ottenere una più accurata definizione dei confini dei corridoi. In particolare, i
seguenti criteri sono stati definiti e applicati all'intera area di studio:
• il corridoio fluviale comprende l'alveo nel suo stato attuale, che corrisponde all'area bagnata identificabile
dalle ortofoto. Questo criterio è stato applicato soprattutto per includere gole strette e tratti distali dove la
larghezza dell'alveo è troppo limitata per essere rappresentata sulla carta geologica. Questa condizione è
stata inoltre applicata alle confluenze per definire i confini fra corridoi appartenenti ai diversi corsi d'acqua;
• Le aree classificate come alluvioni attuali ma che ricadono sui versanti (identificate sulla base della mappa
hillshade) sono state escluse dai corridoi;
• gli alvei storici sono stati inclusi nei corridoi laddove queste aree si collocano nel fondovalle. È importante
notare che le mappe storiche forniscono importanti informazioni riguardo alle morfologie del passato, ma
sono intrinsecamente meno accurate dei dati recenti. Questo criterio è stato applicato in particolare per
identificare i confini fra corridoi fluviali nelle aree di confluenza.
3. 4 SU DDI V I SI ON E I N SE G M E N TI
I corridoi fluviali sono stati suddivisi in segmenti morfologicamente omogenei in conformità con la procedura
IDRAIM. I tratti di studio sono stati divisi in segmenti sulla base dei seguenti fattori:
• cambiamento del gradio di confinamento
• principali discontinuità morfologiche;
• discontinuità idrologiche naturali e artificiali, ovvero affluenti principali e laghi/invasi;
• discontinuità del substrato, rappresentate in particolare dalla presenza/assenza di alluvioni attuali, così
come indicato nella carta geologica.
15Versione italiana
Inoltre, per i corsi d'acqua che terminano con una conoide, è stato definito un sottotratto che si estende
dall'apice della conoide alla confluenza. Infine, laghi e invasi che ricadono nei tratti di studio sono stati
identificati come sottotratti indipendenti ed esclusi dalle analisi.
In totale sono stati definiti 330 sottotratti. La lunghezza dei tratti varia da circa 500 ma 7 km con un valore
medio di 1.84 km mentre l'intervallo interquartile corrisponde a 1.14-2.87 km. I tratti più lunghi corrispondono a
gole strette prive di discontinuità rilevanti (come ad esempio il tratto terminale del Fiume Rienza/Rienzfluss).
I sottotratti sono stati numerati da monte verso valle.
3. 5 DE FI N I Z I ON E DE G L I I N DI C A TORI DI P R E SSI ON E A N TRO P I CA
Allo scopo di quantificare le pressioni antropiche sulla regione fluviale sono stati definiti tre indicatori: i)
distribuzione degli usi del suolo; ii) area degli insediamenti; iii) lunghezza delle infrastrutture di trasporto.
Gli usi del suolo sono stati raggruppati nelle seguenti sei classi:
• Territori urbanizzati (codice 11000);
• Aree industriali, commerciali e destinate ai trasporti (codici da12000 a 16000);
• Territori agricoli (codici 21000, 22000, 25000)
• Aree prative (codice 32000)
• Foreste e territori privi di vegetazione (codici 31000, 41000, 42000, 43000);
• Territori umidi e acque (codici 51000 e 52000).
Sono state prese in considerazione quattro classi di infrastrutture di trasporto, ovvero "Autostrada/Autobahn",
"Strada statale/Staatsstrasse", "Strada provinciale/Landesstrasse" e "Ferrovia/Eisenbahn".
Gli indicatori sono stati calcolati come intersezione fra le mappe sorgente (mappa segli usi del suolo, degli
insediamenti e delle infrastrutture di trasporto) e la mappa vettoriale dei corridoi segmentati.
3. 6 I DE N TI FI C A Z I ON E DE I C ORRI DOI FL U V I A L I RI DOTTI
L'impatto antropico sulla regione fluviale è stato valutato inoltre come la porzione di corrdoio che nello stato
attuale può essere considerata non disponibile per la riqualificazione fluviale a causa dell'intenso sfruttamento
(presenza di insediamenti, infrastrutture di trasporto e agricoltura intensiva). Sono stati definiti due scenari
sulla base degli usi del suolo:
• Scenario 1: le aree escluse dai corridoi fluviali comprendono superfici residenziali e
industriali/commerciali/destinate ai trasporti;
• Scenario 2: le aree escluse dai corridoi fluviali comprendono tutte le aree già incluse nello scenario 1 più le
aree agricole.
Per entrambi gli scanari sono state inoltre considerate non disponibili per la riqualificazione fluviale tutte le
aree isolate dall'alveo attuale a causa della presenza di altre aree escluse, indipendentemente dall'uso del
suolo.
Infine, la pressione antropica è stata calcolata come il rapporto fra l'area del corridoio "ridotto" identificato
secondo ciascuno dei due scenari e la corrispondente area totale del corridoio potenziale.
16Versione italiana
4 RISULTATI
5. 1 DOC U M E N TA Z I ON E
La procedura GIS definita nel presente studio è stata applicata per gli step 1-3 sull'intera area di studio mentre
l'identificazione dei corridoi fluviali ridotti (step 4) è stata condotta su un'area più limitata che corrisponde
all’alta Val Venosta/Vinschgau.
La documentazione completa dei risultati dello studio è disponibile nel CD allegato. I risultati dello studio
comprendono i seguenti prodotti cartografici per l'intera area di studio:
• carta dei tratti di corso d'acqua oggetto di studio (Shapefile, polilinee);
• carta dei corridoi fluviali suddivisi in segmenti (Shapefile, poligoni);
• carta dell'uso del suolo entro il perimetro dei corridoi fluviali;
• carta degli insediamenti entro il perimetro dei corridoi fluviali;
• carta delle infrastrutture di trasporto entro il perimetro dei corridoi fluviali;
Sono fornite inoltre le carte dei corridoi fluviali ridotti per i tratti montani del fiume Adige. I valori degli
indicatori di pressione antropica per ogni segmento sono forniti in forma tabellare.
5. 2 E SE M P I O: RI SU L TATI RE L A TI V I A L FI UM E A DI G E
Di seguito si riportano i risultati dello studio per il fiume Adige. Il tratto oggetto di studio si estende dal lago di
Valentino alla Muta / Haidersee al confine meridionale della Provincia per una lunghezza totale di 119 km. Il
corridoio fluviale copre un'area di circa 173 km2 ed è stato suddiviso in 44 segmenti (vedi Figura 2).
Le Figure 3-5 riassumono gli indicatori di pressione antropica per il fiume Adige.
Figura 2:
Area del corridoio
fluviale del Fiume
Adige e suddivisione
in segmenti.
17Versione italiana
Figura 3:
Area totale del
segmento e
distribuzione degli
usi del suolo.
Figura 4:
Estensione lineare
delle infrastrutture di
trasporto all'interno
del corridoio fluviale.
Figura 5:
Area degli
insediamenti
all'interno del
corridoio fluviale.
18Versione italiana
Alcune considerazioni possono essere dedotte dell'analisi dei risultati GIS:
• la grande variabilità dell'area dei segmenti è diretta conseguenza dei criteri di suddivisione e in particolare
riflette le marcate variazioni del grado di confinamento osservate nel tratto di studio;
• la distribuzione degli usi del suolo mostra chiaramente il ruolo dominante dell'agricoltura all'interno del
corridoio fluviale. La coltivazione intensiva di mele è diffusa nell'intera area e soprattutto a partire dal
segmento 8, mentre il vigneto è presente nel tratto più a valle (segmenti 39-44);
• la copertura vegetale naturale mostra percentuali significative nei tratti di monte (segmenti 4-7) ed è
pressoché trascurabile nei tratti più a valle. È bene notare che la copertura vegetale naturale è massima nei
tratti confinati dove l'area del corridoio sostanzialmente coincide con l'alveo più una stretta fascia di
vegetazione perifluviale (si vedano per esempio i tratti 11, 16 e 35);
• i massimi valori di area urbanizzata si hanno nei sottotratti 10 (corrispondente a Lasa/Laas), 15
(Tarces/Tarsch), 20 (Naturno/Naturns) e 26-28 (che comprendono parti di Lagundo/Algund, Merano/Meran
and Marlengo/Marling). Osservazioni analoghe possono essere dedotte dalla mappa degli insediamenti.
• all'interno del corridoio fluviale sono presenti infrastrutture di trasporto strategiche; in particolare,
l'Autostrada A22 e la linea ferroviaria del Brennero si collocano all'interno del corridoio a partire dal
segmento 36. Vie di comunicazione rilevanti sono presenti inoltre fra Merano/Meran e Bolzano/Bozen
(segmenti 27-35) mentre la linea ferroviaria della Val Venosta/Vinschgau si estende verso monte fino al
segmento 3.
5. 3 C ORRI DOI FL U V I A L I RI DOTTI P E R L ' A L TO C ORSO DE L FI U M E A DI G E
I corridoi fluviali ridotti sono stati individuati per un'area di studio più limitata che copre la valle del fiume Adige
fra Clusio/Schleis e Lasa/Laas. L'area di studio comprende i segmenti 3-10 dell'Adige e i tratti terminali di
quattro affluenti (Rio Ram/Rambach, Rio Puni/Punibach, Rio Saldura/Saldurbach, Rio Solda/Suldenbach).
I corridoi fluviali ridotti sono stati individuati sulla base delle procedure descritte nella sezione Metodi del
presente studio. Il rapporto fra area del corridoio ridotto e area del corridoio totale è riassunto in Figura 6 per
tutti i segmenti. I risultati sono mostrati in forma cartografica nelle Figure 7 e 8.
È possibile osservare che la presenza di insediamenti e infrastrutture di trasporto (Scenario 1) riduce il corridoio
fluviale a circa il 50-90% dell'area originaria, con riduzioni più marcate nel segmento 10 del fiume Adige, nel
segmento 7 del Rio Solda/ Suldenbach (che attraversa Prato allo Stelvio/Prad) e nel segmento 8 del Rio
Puni/Punibach (che attraversa Malles/Mals). Se si prendono in considerazione anche le aree agricole (Scenario
2), la riduzione è assai più marcata, in particolare nei segmenti 3-6 del fiume Adige e nel segmento 4 del Rio
Ram/Rambach.
Figura 6:
Rapporto fra area
del corridoio ridotto
e area del corridoio
totale.
19Versione italiana
Figura 7:
Corridoi fluviali
ridotti: Scenario 1
Figura 8:
Corridoi fluviali
ridotti: Scenario 2
Bolzano/Bozen, 19.04.2014 Il tecnico
20Puoi anche leggere