La politica monetaria della Banca Centrale Europea: obiettivi, strumenti, risultati
←
→
Trascrizione del contenuto della pagina
Se il tuo browser non visualizza correttamente la pagina, ti preghiamo di leggere il contenuto della pagina quaggiù
Massimo Rostagno
                                    La politica monetaria della
European Central Bank
                                    Banca Centrale Europea:
                                    obiettivi, strumenti, risultati
                                    Luigi Einaudi Lecture 2018

                                    Campus Universitario Luigi Einaudi – 4 Ottobre 2018

          The views expressed in this presentation are those of the presenter and do not
                     necessarily reflect those of the ECB or the Eurosystem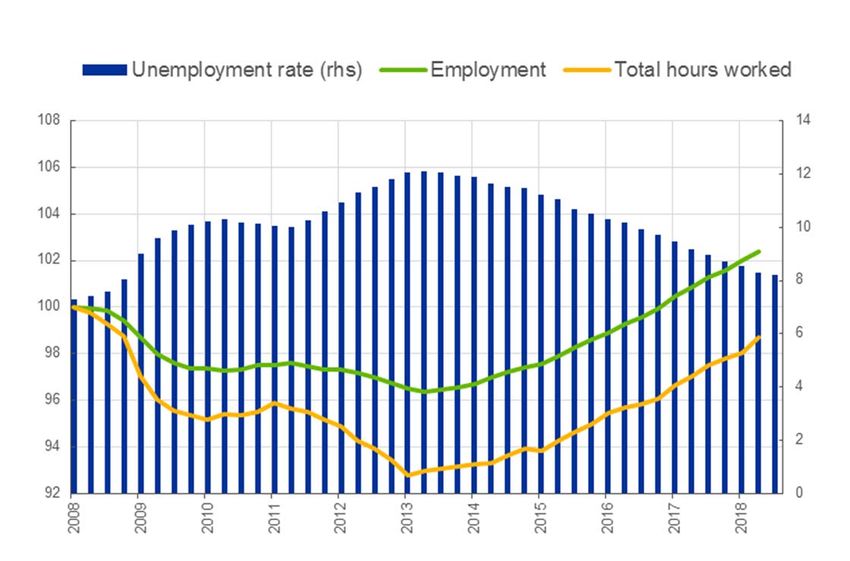
«Conoscere
 Rubric    per deliberare»

                             2   www.ecb.europa.eu ©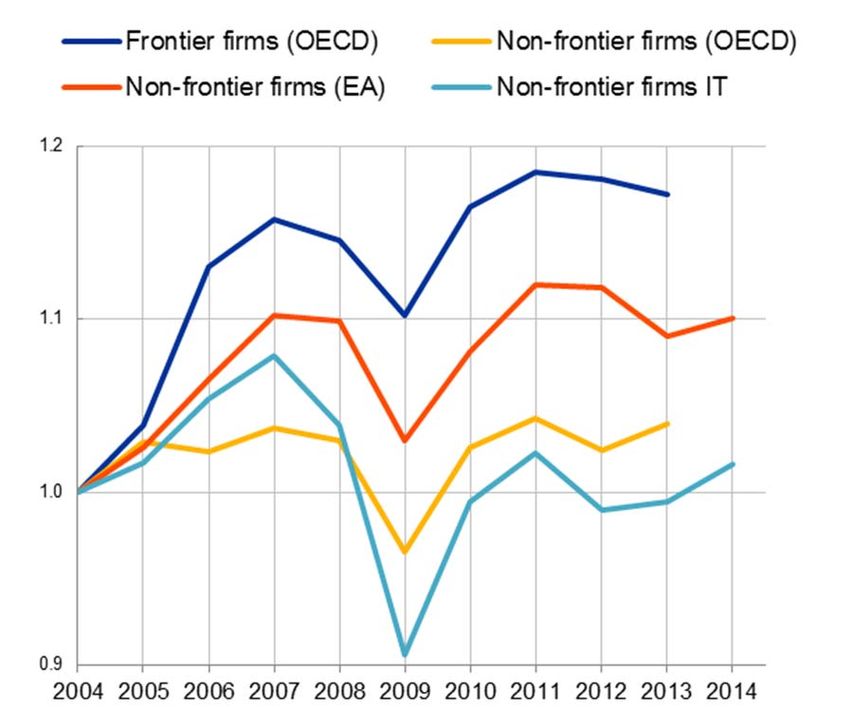
«Conoscere
 Rubric    per deliberare»

                             A   La lunga marcia

                             B   La crisi in tre grafici

                             C   La politica monetaria della BCE dal 2014

                             D   Cosa può e cosa non può fare la BCE

                                   3                           www.ecb.europa.eu ©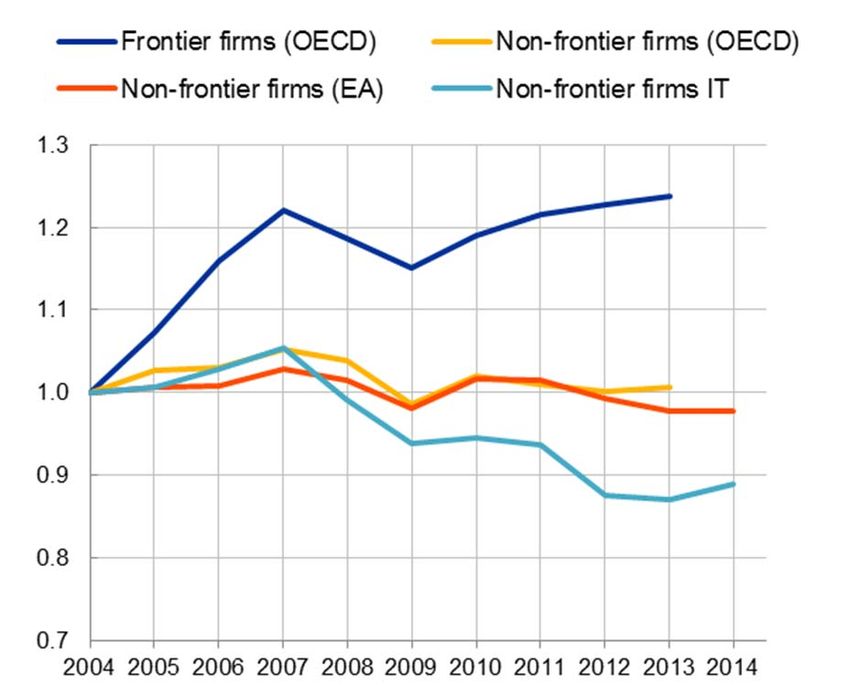
La lunga marcia verso l’Unione Monetaria …
 Rubric

                                                 2002 Introduction of euro banknotes
                                          1999 Irrevocable fixing of conversion rates
                                     1998 Founding of the ECB
                              1994 Founding of the European Monetary Institute
                         1992 Signing of the Maastricht Treaty
                   1988 Delors Report
             1986 Single European Act

       1979 European Monetary System

 1970 Werner Report on economic and monetary union

                                                                           www.ecb.europa.eu ©
…Rubric
E verso la stabilità monetaria
HICP inflation and price stability
(annual percent change)
5 5
Articolo 127 del Trattato sul Funzionamento
4 4
dell’Unione Europea
“The primary objective of the ESCB shall be to
3 3 maintain price stability. Without prejudice to the
objective of price stability, the ESCB shall support the
2 2 general economic policies in the Union with a view to
contributing to the achievement of the objectives of the
Union as laid down in Article 3 of the Treaty on European
1 1
Union. […]”
0 0
Definizione di stabilità monetaria
-1 -1 The Governing Council aims to maintain inflation rates at
1999 2002 2005 2008 2011 2014 2017
levels below, but close to, 2% over the medium term.
Source: Eurostat, ECB computations. (Comunicato-stampa del Consiglio Direttivo BCE, maggio 2003)
Latest observation: August 2018.
5 www.ecb.europa.eu ©Einaudi
Rubric e l’Unione Monetaria come premessa per la stabilità monetaria
«Il disordine attuale delle unità monetarie in tutti i paesi del mondo, le difficoltà
degli scambi derivanti dall'incertezza dei saggi di cambio tra un paese e l'altro e
più dalla impossibilità di effettuare i cambi medesimi, hanno reso evidente agli
occhi di tutti il vantaggio che deriverebbe dall'adozione di un'unica unità
monetaria in tutto il territorio della Federazione.
Il vantaggio del sistema non sarebbe solo di conteggio e di comodità nei
pagamenti e nelle transazioni interstatali. Per quanto altissimo, il vantaggio
sarebbe piccolo in confronto di un altro, che è l'abolizione della sovranità dei
singoli stati in materia monetaria. Chi ricorda il malo uso che molti stati avevano
fatto e fanno del diritto di battere moneta non può aver dubbio rispetto alla
urgenza di togliere ad essi cosiffatto diritto. Esso si è ridotto in sostanza al diritto
di falsificare la moneta e cioè al diritto di imporre ai popoli la peggiore delle
imposte, peggiore perché inavvertita, gravante assai più sui poveri che sui ricchi,
cagione di arricchimento per i pochi e di impoverimento per i più, lievito di
malcontento per ogni classe contro ogni altra classe sociale e di disordine
sociale.
La svalutazione della lira italiana e del marco tedesco, che rovinò le classi medie e
rese malcontente le classi operaie fu una delle cause da cui nacquero le bande di
disoccupati intellettuali e di facinorosi che diedero il potere ai dittatori. Se la
federazione europea toglierà ai singoli stati federati la possibilità di far fronte alle
opere pubbliche col far gemere il torchio dei biglietti, e li costringerà a provvedere
unicamente con le imposte e con prestiti volontari avrà, per ciò solo, compiuto
opera grande.
(L. Einaudi, 1944,
6 I problemi economici della federazione europea, Lugano)
www.ecb.europa.eu ©Perché
Rubric Stabilità Monetaria? Perché l’inflazione non aumenta la crescita
Real GDP growth and
inflation since 1949
(annual percentage change)
Germany France Italy
Real GDP pc Real GDP pc Real GDP pc
Inflation (rhs) Inflation (rhs) Inflation (rhs)
5
4
15
3
2
0
1
0
-1 -15
-2
-3 -30
1949 1959 1969 1979 1989 1999 2009
Sources: AMECO, Jordà, Schularick, and Taylor (2015) and ECB computations.
Note: the bars denote 5-year averages of the difference between actual real GDP growth and the European
Commission estimate of potential output growth over the period 1965-2014. Before 1965, bars show the difference
7
between real GDP growth and a trend estimated by ECB staff. www.ecb.europa.eu ©Perché
Rubric Unione Monetaria? La moneta ha bisogno di un’ancora …
Exchange rate arrangements
(Percent of IMF members as of April 2017)
60 60
50 50
40 Soft peg 40
30 30
20 20
10 10
Hard peg
0 0
Peg Floating Other arrangements
Source: IMF and ECB computations.
Note: Includes 189 IMF member countries and three territories: Aruba, Curaçao and Sint Maarten (both
in the Kingdom of the Netherlands), and Hong Kong SAR (China). Other arrangements include
countries that have no explicitly identified a nominal anchor, but rather monitor various indicators in
conducting monetary policy. Note: the Floating countries include the 19 members of the European
Monetary Union.
Latest observation: 2017. 8 www.ecb.europa.eu ©Adottare
Rubric un’ancora esterna significa rinunciare al governo della moneta
Policy rates, inflation and inflation projections in
Germany and Italy (1990-1993)
(percentage and annual percentage change)
Key interest rate
HICP (rhs)
Consensus inflation projection (rhs)
10 7
8 6
Germany
6 5
4 4
2 3
0 2
16 10
14 9
12 8
10 7
Italy
8 6
6 5
4 4
2 3
Jun.90 Dec.90 Jun.91 Dec.91 Jun.92 Dec.92 Jun.93
Source: Consensus Economics, Eurostat, and ECB computations.
Note: the Consensus inflation projection are from the March and November rounds.
9 www.ecb.europa.eu ©InRubric
un’U.M. si co-determinano le scelte che governano la moneta-ancora
Draghi (2011)
de Guindos (2018) President Cœuré (2012)
Vice President
Weidmann (2011) Costa (2010)
Visco (2011) Georghadji (2014)
Villeroy de Galhau (2015) Hansson (2012)
Vella (2017) Hernándes de Cos
(2018)
Vasiliauskas (2015)
Knot (2011)
To be appointed
Governor, Banka Slovenije
Stournaras (2014) Lane (2015)
Smets (2015) Lautenschläger (2014)
Rimšēvičs (2014) Makúch (2010)
Reinesch (2013) Mersch (1999)
Rehn (2018) Nowotny (2008)
Praet (2011)
10 www.ecb.europa.eu ©«Conoscere
Rubric per deliberare»
A La lunga marcia
B La crisi in tre grafici
C La politica monetaria della BCE dal 2014
D Cosa può e cosa non può fare la BCE
11 www.ecb.europa.eu ©20Rubric
anni di crescita, interrotta da una lunga crisi …
Real GDP in the euro area,
Japan, and the US
(index, 1999Q1=100)
EA US Japan
160 160
140 140
120 120
100 100
80 80
1999 2001 2003 2005 2007 2009 2011 2013 2015 2017
Sources: Eurostat, BEA, Cabinet Office, ECB calculations.
Notes: horizontal dotted lines represent pre-crisis peak real GDP level.
Latest observation: 2018 Q2.
12 www.ecb.europa.eu ©…Rubric
In cui le aspettative e i piani di vita dei cittadini si sono infranti
Euro area real GDP and pre-crisis
and latest expected path
(index, 1999Q1=100)
EA Expected growth path in 2007
Expected growth path in 2011 Expected growth path (latest)
160 160
Projection
horizon
140 140
120 120
100 100
80 80
1999 2001 2003 2005 2007 2009 2011 2013 2015 2017 2019 2021 2023
Sources: Consensus and ECB calculations.
Notes: Expected real GDP path as in Consensus Forecast: October 2007, April 2011, and April 2018.
Latest observation: 2018 Q2.
13 www.ecb.europa.eu ©La crisi ha portato dis-inflazione sostenuta e rischio di de-flazione
Rubric
Actual and projected HICP inflation, and
measures of underlying inflation
(year-on-year percentage change)
Measures of underlying inflation
HICP inflation
Sep-2018 MPE
5.0 5.0
4.0 4.0
3.0 3.0
2.0 2.0
1.0 1.0
0.0 0.0
-1.0 -1.0
-2.0 -2.0
2003 2005 2007 2009 2011 2013 2015 2017 2019
Source: ECB staff projections and calculations.
Notes: The measures of underlying inflation (green range) include HICP inflation excluding food
and energy, PCCI and Super-core.
Latest observation: August 2018 flash for HICP inflation and HICP inflation excluding food and
energy, July for PCCI and Super-core. 14 www.ecb.europa.eu ©ERubric
ha bloccato il meccanismo di trasmissione della politica monetaria
Bank lending rates for loans to non-financial Change in bank lending rates for loans to
corporates (NFCs) NFCs from 07/2011 to 01/2014
(percent per year, 2011-2014) (percentage points, 2011-2014)
DE ES FR IT EA MRO ∆ MRO and ∆ Bank lending rates for NFC
5 5 0.50 0.50
0.25 0.25
4 4
0.00 0.00
-0.25 -0.25
3 3
-0.50 -0.50
2 2
-0.75 -0.75
-1.00 -1.00
1 1
-1.25 -1.25
0 0 -1.50 -1.50
2011 2012 2013 2014 MRO DE FR ES IT
Sources: ECB, ECB calculations.
Notes: Lending rates are calculated by aggregating short and long-term rates using a 24-month moving average of new business volumes.
Latest observation: May 2014
15 www.ecb.europa.eu ©«Conoscere
Rubric per deliberare»
A La lunga marcia
B La crisi in tre grafici
C La politica monetaria della BCE dal 2014
D Cosa può e cosa non può fare la BCE
16 www.ecb.europa.eu ©La road-map ex ante
Rubric
“We have helped further clarify our reaction function by laying out some
contingencies that would warrant a monetary policy reaction.
1. “Tensions in short-term money markets to the extent that these are
propagated to the medium-term curve, in particular in an environment of
receding excess liquidity
“lowering of the interest rate corridor, including a negative deposit rate
2. “Impairments in the transmission of our stance, in particular via the
bank lending channel
“ longer-term refinancing operation targeted towards encouraging bank
lending or an ABS purchase programme
3. “Worsening of the medium-term outlook for inflation
“ a more broad-based asset purchase programme
Mario Draghi, Amsterdam 24 April 2014
17 www.ecb.europa.eu ©La road-map ex post
Rubric
18 www.ecb.europa.eu ©TLTRO
Rubric e acquisti di titoli hanno iniettato liquidità nel sistema …
ECB monetary policy assets
(in billion €)
Start of the Start of the public
Beginning Intensification
2014-2017 sector purchase
of the of the financial
ECB package programme
financial turbulence
of measures (PSPP)
3,500
15 Sep 2008
5 Jun 2014
9 Aug 2007
9 Mar 2015
3,000
2,500
2,000
1,500
1,000
500
0
2007 2009 2011 2013 2015 2017
Main refinancing operations LTROs TLTROs Purchases of private sector securities Purchases of public sector securitites
Source: ECB
Latest observation: 20 September 2018.
19 www.ecb.europa.eu ©…Rubric
E indotto un ri-bilanciamento degli attivi delle banche verso i prestiti
Banks’ loans and securities holdings
(12-month flows in EUR bn, nsa)
Loans - private sector Securities - government
400 400
APP
300 300
200 200
100 100
0 0
-100 -100
-200 -200
-300 -300
2010 2011 2012 2013 2014 2015 2016 2017 2018
Sources: ECB (BSI).
Latest observation: August 2018.
20 www.ecb.europa.eu ©I tassi
Rubricnegativi applicati alle banche hanno azzerato i tassi a breve …
Expectations of future short-term rate over periods of non-standard measures
(percentages per annum)
EA US
1.75 1.75 10 10
1.50 1.50 9 9
Monetary policy package QE
1.25 1.25 8 8
1.00 1.00 7 7
0.75 0.75 6 6
0.50 0.50 5 5
0.25 0.25 4 4
0.00 0.00 3 3
-0.25 -0.25 2 2
-0.50 -0.50 1 1
-0.75 -0.75 0 0
2013 2014 2015 2016 2017 2018 2019 2020 2007 2009 2011 2013 2015 2017 2019 2021
Source: Bloomberg. Source: Bloomberg
Notes: Evolution of the OIS forward curve from pre- Notes: Evolution of Federal Funds Rate futures curves.
negative rate (black-dotted lines) to post-negative rate (red- Latest observation: 24 September 2018.
dotted lines) period.
Latest observation: 24 September 2018.
21 www.ecb.europa.eu ©I tassi
Rubrica breve sono la base su cui le banche calcolano i tassi attivi …
Loans to non-financial corporations by original Loans to households by original maturity or time
maturity or time to interest rate reset to interest rate reset
(percent) (percent)
short-term long-term short-term long-term
100% 100% 100% 100%
80% 80% 80% 80%
60% 60% 60% 60%
40% 40% 40% 40%
20% 20% 20% 20%
0% 0% 0% 0%
Less vulnerable countries Vulnerable countries Less vulnerable countries Vulnerable countries
Source: ECB Source: ECB.
Notes: Breakdown as of June 2018. Based on outstanding amounts of loans. Short-term refers to Notes: Breakdown as of June 2018. Based on outstanding amounts of loans. Short-term refers to
loans with original maturity up to 1 year and overdrafts plus loans with a remaining maturity over 1 loans with original maturity up to 1 year and overdrafts plus loans with a remaining maturity over 1
year and interest rate reset within the next 12 months. year and interest rate reset within the next 12 months.
22 www.ecb.europa.eu ©…Rubric
E ciò ha compresso i tassi bancari sui prestiti alle imprese …
Monetary policy interest rates and bank lending rates on loans to firms
(percentages per annum)
DE ES FR
IT EA DFR
MLF EONIA MRO rate
7 7
June 2014:
Start of the 2014-17
6 ECB package
6
5 5
4 4
3 3
2 2
1 1
0 0
-1 -1
2007 2008 2009 2010 2011 2012 2013 2014 2015 2016 2017 2018
Source: ECB staff calculations.
Notes: Bank lending rates are calculated by aggregating short- and long-term rates using a 24-
month moving average of new business volumes.
Latest observation: July 2018.
23 www.ecb.europa.eu ©…Rubric
E alle famiglie …
Monetary policy interest rates and bank lending rates on loans to households
(percentages per annum)
DE ES FR
IT EA DFR
MLF EONIA MRO rate
7 7
June 2014:
Start of the 2014-17
6 ECB package
6
5 5
4 4
3 3
2 2
1 1
0 0
-1 -1
2007 2008 2009 2010 2011 2012 2013 2014 2015 2016 2017 2018
Source: ECB staff calculations.
Notes: Bank lending rates are calculated by aggregating short- and long-term rates using a 24-
month moving average of new business volumes.
Latest observation: July 2018.
24 www.ecb.europa.eu ©…Rubric
E ha riportato l’occupazione ai livelli pre-crisi
Main labour market indicators
(employment and total hours worked: index, 2008Q1=100, unemployment
rate: percentage)
Source: Eurostat, National Accounts.
Latest observations: 2018Q3 (based on July 2018) for the unemployment rate, 2018Q2 for the
rest.
25 www.ecb.europa.eu ©L’inflazione
Rubric è risalita ed è attesa riconvergere verso l’obiettivo
Actual, projected HICP inflation and risks Sustained Convergence
(year-on-year percentage change)
Sep 2018 MPE interquartile confidence interval
Sep 2018 MPE projection
“We will continue to make net purchases under the asset
HICP inflation purchase programme (APP) at the current monthly pace of €30
2.5 2.5 billion until the end of this month. After September 2018, we will
1.9% reduce the monthly pace of the net asset purchases to €15 billion
2.0 2.0
until the end of December 2018 and we anticipate that, subject to
incoming data confirming our medium-term inflation outlook, we
1.5 1.5
will then end net purchases.
1.0 1.0
“We continue to expect the key ECB interest rates to remain at
0.5 0.5 their present levels at least through the summer of 2019, and in
any case for as long as necessary to ensure the continued
0.0 0.0 sustained convergence of inflation to levels that are below, but
close to, 2% over the medium term.”
-0.5 -0.5
-1.0 -1.0
2013 2014 2015 2016 2017 2018 2019 2020
Source: ECB staff projections and calculations.
Notes: The blue range represents an interquartile confidence interval around the
September 2018 inflation projections.
26 www.ecb.europa.eu ©«Conoscere
Rubric per deliberare»
A La lunga marcia
B La crisi in tre grafici
C La politica monetaria della BCE dal 2014
D Cosa può e cosa non può fare la BCE
27 www.ecb.europa.eu ©La BCE ha rimesso l’euro-area su un percorso di crescita
Rubric
Real GDP in the euro area,
Japan, and the US
(index, 1999Q1=100)
EA US Japan
160 160
ECB
measures
140 140
120 120
100 100
80 80
1999 2001 2003 2005 2007 2009 2011 2013 2015 2017
Sources: Eurostat, BEA, Cabinet Office, ECB calculations.
Notes: horizontal dotted lines represent pre-crisis peak real GDP level.
Latest observation: 2018 Q2.
28 www.ecb.europa.eu ©Rimangono
Rubric differenze notevoli fra Paesi membri …
Real GDP in selected
euro area countries
(index, 1999Q1=100)
Range of selected EA countries EA Italy
160 160
140 140
120 120
100 100
80 80
1999 2001 2003 2005 2007 2009 2011 2013 2015 2017
Sources: Eurostat, ECB calculations.
Notes: The range of selected Euro area countries comprises of real GDP in
Austria, Belgium, Spain, Finland, France, Germany, the Netherlands, and Portugal.
Latest observation: 2018Q2. 29 www.ecb.europa.eu ©Ma la BCE non può far nulla contro le cause strutturali della decrescita
Rubric
Labour productivity in selected
euro area countries
(index, 1999Q1=100)
Range of selected euro area countries Italy Spain
130 130
120 120
110 110
100 100
90 90
1995 1997 1999 2001 2003 2005 2007 2009 2011 2013 2015 2017
Sources: Eurostat, ECB calculations.
Notes: The range of selected Euro area countries comprises of labour productivity
in Austria, Belgium, Finland, France, Germany, the Netherlands, and Portugal.
Latest observation: 2018Q2. 30 www.ecb.europa.eu ©Il Rubric
deficit di produttività dell’Italia ripetto ai partner EU ha quasi 30 anni
Decomposition of GDP growth in Italy
relative to the average of EU-15 countries
(percentage points)
Labour contribution Capital contribution TFP GDP growth
1.0
0.5
0.0
-0.5
-1.0
-1.5
1971-1979 1980-1989 1990-1999 2000-2007 2008-2017
Sources: European Commission and ECB.
Notes: The green points indicate the difference between GDP growth of Italy and GDP growth of the 15 countries which had become EU Members by 1995 (EU-15). The red, yellow
and blue bars in turn indicate the contributions to this difference of total factor productivity (TFP) growth, capital and labour accumulation, respectively.
31 www.ecb.europa.eu ©Il Rubric
deficit di produttività dell’Italia sta per compiere 30 anni
Productivity growth in firms at the technology frontier and laggard firms
(2004=1)
Manufacturing sector Services sector
Sources: OECD and CompNet.
Notes: Full sample of firms available, including firms with less than 20 employees. The non-frontier productivity dynamics for selected euro area (EA) countries (BE, FI, FR
and IT, unweighted averages) are computed as productivity growth of the median firm in each 2-digit sector aggregated with employment weights at the country level.
32 www.ecb.europa.eu ©Einaudi,
Rubric il credito e gli ostacoli strutturali alla crescita dell’Italia
«Se esistono fattori disoccupati; se essi possono essere combinati
economicamente; se manca solo all’uopo la spinta del credito, ben venga anche
la creazione del credito (…). Esistono oggi in Italia questi fattori produttivi
disoccupati, in attesa di combinazione economica? La sola affermazione che si
può fare con sicurezza è che esistono innumerevoli cul di sacco» (bottlenecks),
da cui i fattori disoccupati non possono uscire per combinarsi con quelli che non
possono alla loro volta uscire da altri corrispondenti cul di sacco»
(L. Einaudi, 1965, Lo Scrittoio del Presidente (1948-1955) – Capitolo XIV
“Risparmio e investimento”)
35 www.ecb.europa.eu ©Rubric
Thank you
36 www.ecb.europa.eu ©Puoi anche leggere