L'intelligenza artificiale per l'elaborazione dei dati nello scenario di Industria 4.0 - Roberto Bellotti Dipartimento Interateneo di Fisica "M ...
←
→
Trascrizione del contenuto della pagina
Se il tuo browser non visualizza correttamente la pagina, ti preghiamo di leggere il contenuto della pagina quaggiù
L’intelligenza artificiale per l’elaborazione dei dati
nello scenario di Industria 4.0
Roberto Bellotti
Dipartimento Interateneo di Fisica ”M. Merlin”
Istituto Nazionale di Fisica Nucleare

Indice

ü I Big Data come carburante per i sistemi di Intelligenza
 Artificiale (AI)

ü AI & Reti Complesse
   ü Propaganda politica
   ü Studio delle malattie neurodegenerative con tecniche di AI
   ü Valutazione degli investimenti

ü Conclusioni

                                                              2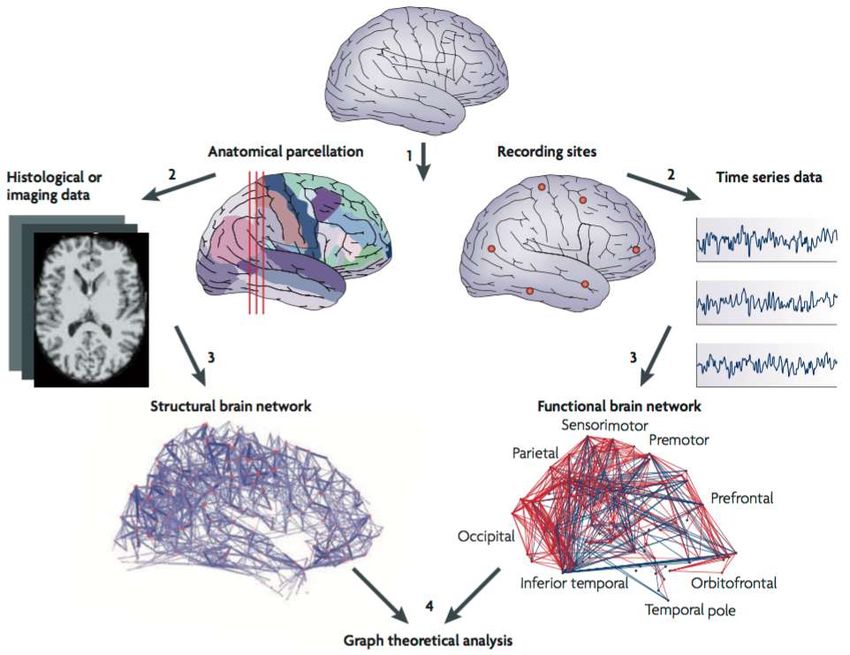
Intelligenza artificiale
                                                         Chi svilupperà la migliore
                                                         intelligenza artificiale,
                                                         diventerà il padrone del
                                                         mondo (Putin, 2017)

Intelligènza Artificiale (IA) Disciplina che studia se
e in che modo si possano riprodurre i processi
mentali più complessi mediante l'uso di un
computer. Tale ricerca si sviluppa secondo due
percorsi complementari: da un lato l'i. artificiale
cerca di avvicinare il funzionamento dei computer
alle capacità dell'intelligenza umana, dall'altro usa
le simulazioni informatiche per fare ipotesi sui
meccanismi utilizzati dalla mente umana
(Treccani)

                                                                                  3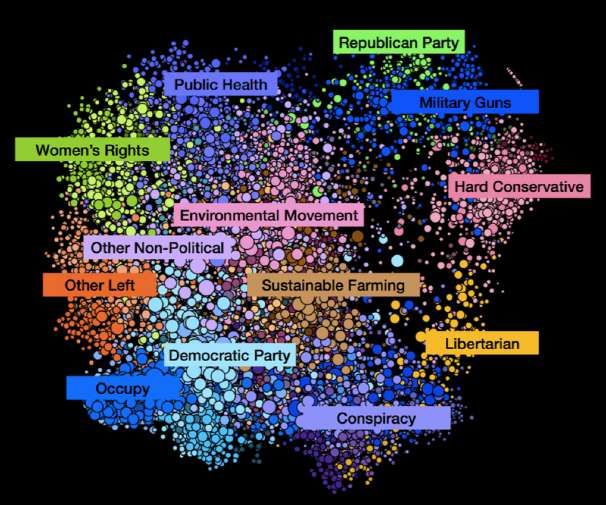
Numeri ed Esempi
1 bit = 0/1 à Una lettera = 1 byte (= 8 bit).
Un libro = una foto di buona qualità = circa 1 Megabyte.
1 Gibabyte = 1.000 libri
1 Terabyte = 1.000.000 di libri

Facebook:
500 Terabyte di dati al giorno, tra cui circa 3 miliardi di “like” e
300 milioni di foto.
Stima dei dati posseduti da FB: 100.000 Terabyte.

Google e Amazon à oltre un milione di Terabyte.

                                                            Un Boeing 737 genera, in un viaggio
Walmart registra più di 1                                   attraverso gli Stati Uniti circa 240
milione di “operazioni” all’ora!                            Terabytes di dati.

                                                                                          4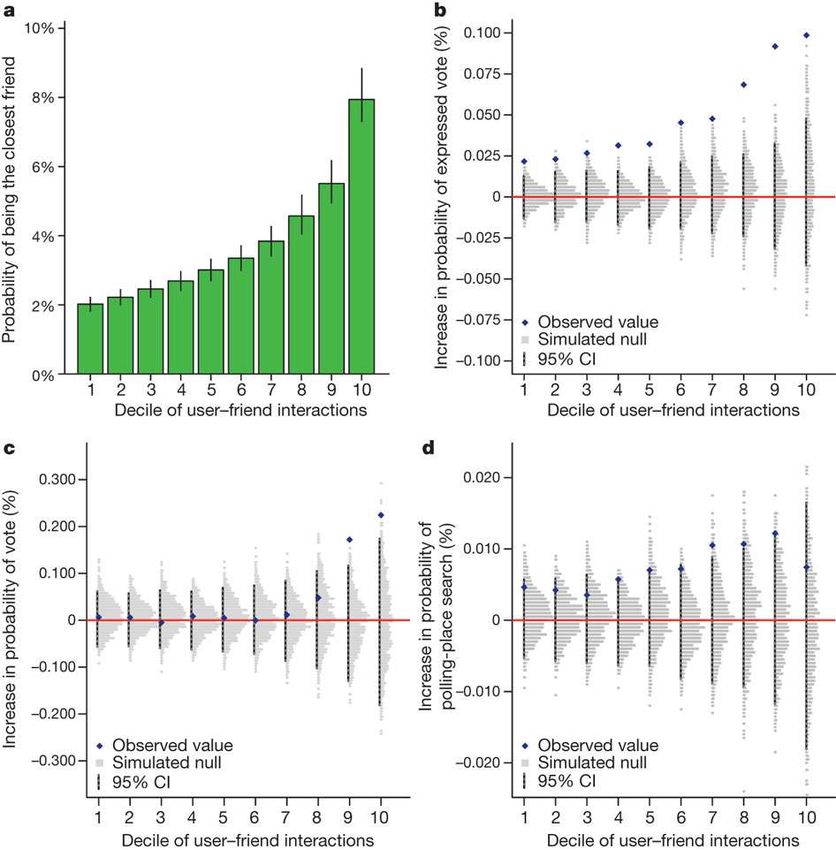
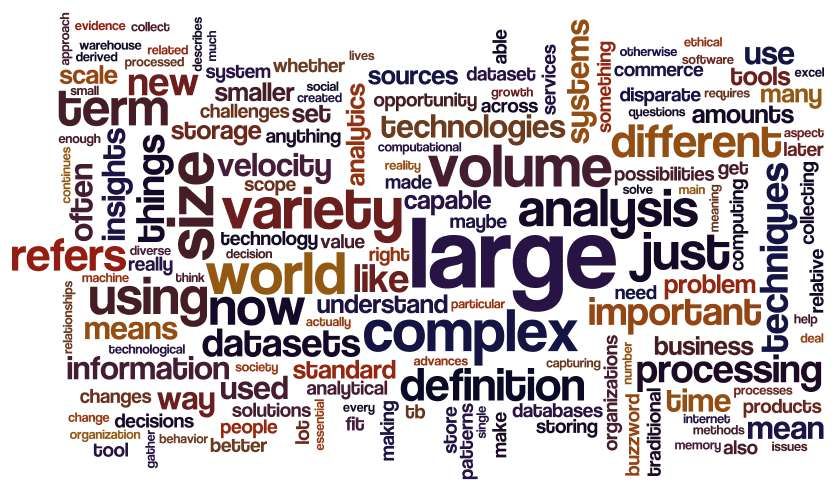
Cosa sono i Big Data?
Le tre V:
     ü Volume
     ü Varietà
     ü Velocità
ü Big Data:
     ü Introdotto nel 2013 nell’Oxford English Dictionary
     ü Introdotto nel 2014 Merriam-Webster’s Collegiate

ü Historically, most decisions — political,
   military, business, and personal — have
   been made by brains [that] have                ü Glossario Gartner:
   unpredictable logic and operate on             “Big data is high-Volume, high-Velocity
   subjective experiential evidence. “Big         and/or high-Variety information assets
   data” represents a cultural shift in which     that demand cost-effective, innovative
   more and more decisions are made by            forms of information processing that
   algorithms with transparent logic,                  enable enhanced insight, decision
   operating on documented immutable              making and process automation”.
   evidence. I think “big” refers more to the
   pervasive nature of this change than to any
   particular amount of data.
 [datascience.berkeley.edu/what-is-big-data/]
                                                                                      5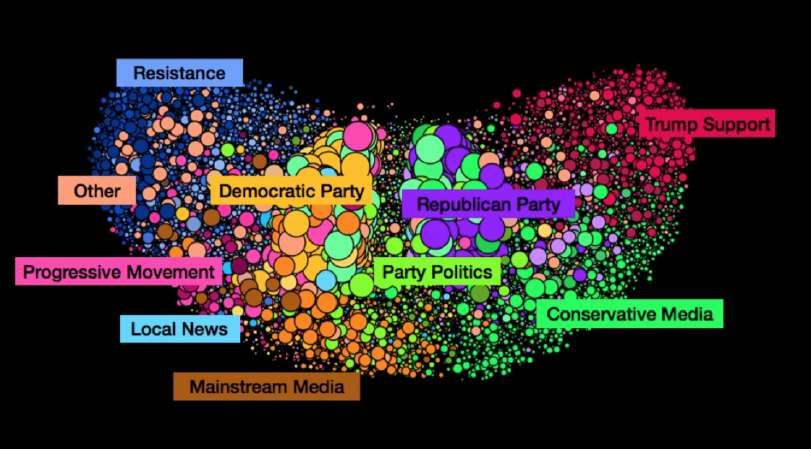
Popolazione vs Dispositivi

Quanti dispositivi
“connessi” possiede
ognuno di voi?

Il McKinsey Global
Institute stima una
crescita del volume
dei dati prodotti
pari al 40% per anno
e un fattore
moltiplicativo di 44
nel periodo 2009-
2020.
                                        N.B. 6.58/0.08 > 8000 (in 17 anni!)   6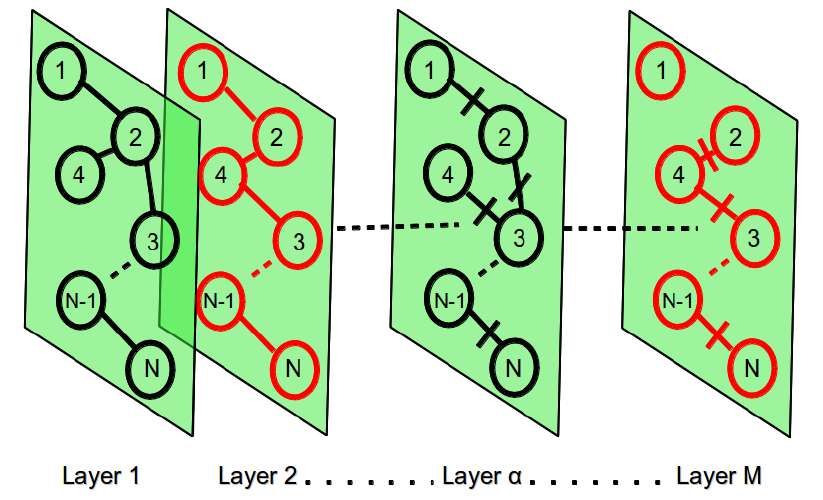
Big data tra loro connessi à reti complesse
• Trasporti
• Reti elettriche
• Mercati finanziari
• Sistemi biologici

                                A

                                                         B
                                                                                     8

  e.g. La nazione A è collegata alla nazione B se A compra/vende un prodotto da B.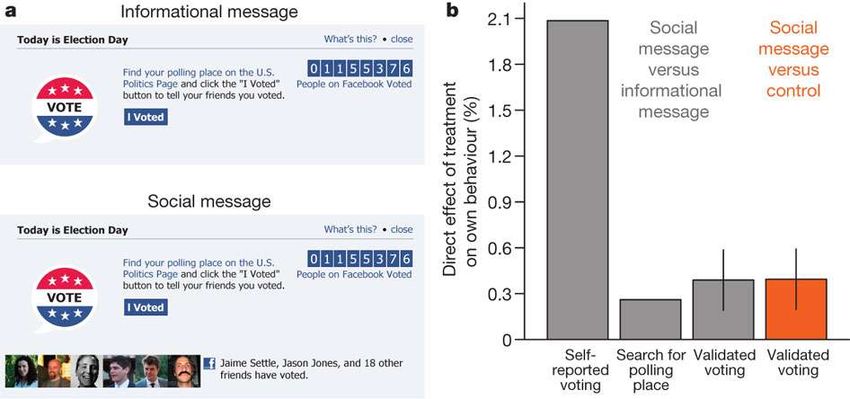
Cosa serve per vincere le elezioni?

Messaggio su LinkedIn del Data Scientist Rayid Ghani:

“Siamo in cerca di esperti data scientist che vogliano fare la differenza.

La campagna di Obama vedrà un ampliamento del team “analitico” per
risolvere problemi di data mining su vasta scala e a forte impatto.

Si presentano diverse opportunità di inserimento professionale a tutti i livelli
di esperienza.

Cerchiamo esperti di statistica, di apprendimento automatico, di text analytics
e di analisi predittiva per lavorare su grandi volumi di dati e contribuire ad
orientare la strategia elettorale”

 Joe McGinnis, Come si vende un Presidente, Mondadori, Milano, 1970
 (sulla Elezione di Nixon)
                                                                                   9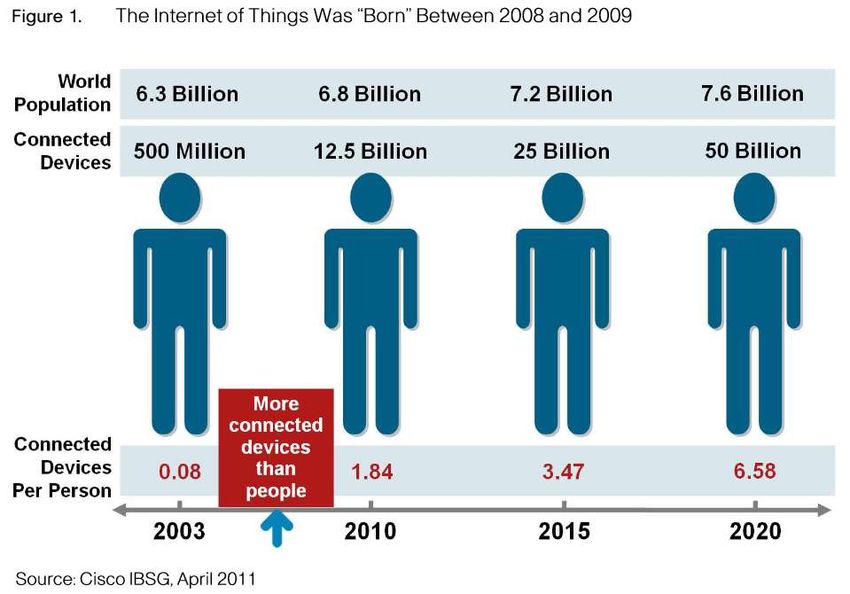
61-million-experiment in Social Influence and
Political Mobilization - Nature, 2012
E’ possibile aumentare l’affluenza alle urne
attraverso gli online social network?

Possono, gli online social network, generare
un “contagio sociale”?

Se si, quanto “vale” questo effetto?

Un effetto, anche piccolo, con i collegi
uninominali può essere rilevante?
                                      Nelle elezioni USA del 2000 George Bush ha battuto
                                      Al Gore in Florida per 537 voti (meno del 0.01% degli
                                      iscritti alle liste elettorali in Florida).

                                       L’esperimento si è svolto il 2 Novembre 2010, giorno
                                       delle elezioni presidenziali USA, sugli utenti facebook
                                       che in quel giorno hanno utilizzato facebook.

                                       L’esperimento è stato condotto a insaputa degli
                                       utenti à In Italia è stato condotto il 4 marzo 2018!
L’esperimento “megafono dell’elettore” di Facebook
Tre gruppi disgiunti.
Gruppo di “controllo”
18%
(=613,096)
Gruppo “informato”
(=611.044)
20%
The social message group
(= 60.055.176)
I dati “social” sono stati incrociati con i dati reali per un
sottocampione di circa 6 milioni di elettori.Inoltre: gli amici non sono tutti uguali
12Polarization, Partisanship and Junk News Consumption
over Social Media in the US
Studio effettuato da:
Università di Oxford,
Dipartimento “Oxford Internet Institute”
(oii.ox.ac.uk )
nell’ambito del progetto:
COMPUTATIONAL PROPAGANDA
13Full Illustration of US Audience Groups on Facebook
Full Illustration of US Audience Groups on Twitter
Analisi di circa 22 milioni di Tweets raccolti nel periodo 1-11
novembre 2016 (le elezioni si sono svolte l’8 novembre 2016) da
siti di “propaganda”
https://www.eticaeconomia.it/propaganda-e-manipolazione-
nelle-elezioni-politiche-il-ruolo-dei-social-network-e-degli-
algoritmi-basati-sulla-intelligenza-artificiale/Studio delle malattie neurodegenerative con tecniche di AI
Mild Cognitive Impairment (MCI):
a potential precursor to Alzheimer’s Disease
MCI is a condition in which an individual has mild but measurable changes in
thinking abilities that are noticeable to the person affected and to family
members and friends, but do not affect the individual’s ability to carry out
everyday activities.
People with MCI, especially MCI involving memory problems, are more likely to
develop Alzheimer’s or other dementias than people without MCI.
An average of 32 percent of individuals
with MCI developed Alzheimer’s
dementia in 5 years.
Identifying which individuals with MCI
are more likely to develop Alzheimer’s
or other dementias is a major goal of
current research.
MCI can develop for reasons other than Alzheimer’s, and MCI does not always lead to
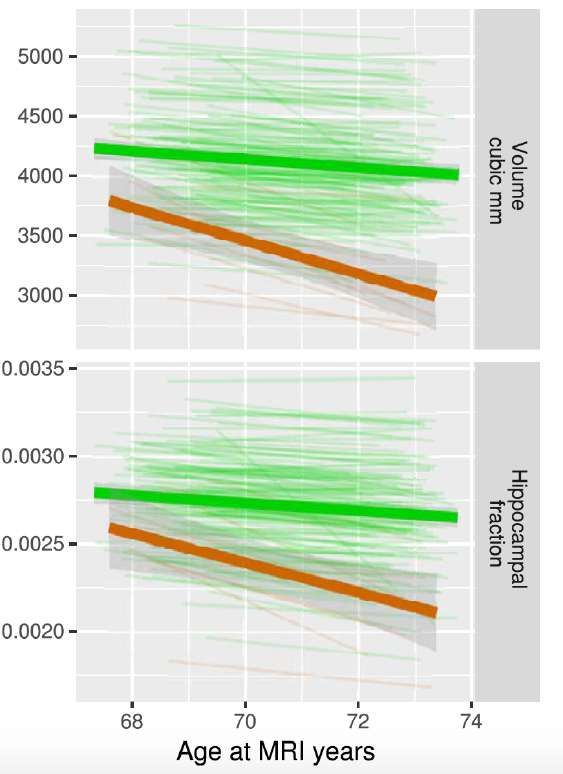
dementia. 16Hippocampal volumetry as a Biomarker for AD
Automated volumetry measuring hippocampal
size at age 69 years and subsequent rate of
change predicts Alzheimer’s dementia
development
Hippocampal size over time. Each thin line
represents one of the 149 participants.
Participants who developed AD are marked
with red lines and the other participants are
marked with green lines.Structural and Functional Networks
Bullmore and Sporns, Nature, 2009
18A novel connectivity model
For each image a weighted graph was built upon a similarity measurement given by
pairwise Pearson’s correlation among the nodes represented by the patches of each
subject.
A multilayer network
G=(G1,G2,…,Gα,...,GM) is a set of
M graphs Gα=(Nα,Eα) with
α=(1,...,M), each of one
representing a layer. If the set of
nodes Nα is fixed then we call it
by definition a multiplex.
19Independent test accuracy
Classification Accuracy
Control - Alzheimer Control - MCI (converter)
0.86 ± 0.01 0.84 ± 0.01
The proposed methodology is intrinsically data-driven and, as a consequence, it
could suffer from typical over-training issues which on turn could mine the reliability
of the findings. As a further assessment we performed a binary classification (NC-
AD and NC-cMCI) on the independent test set.
20The Italian Public Funding Program (2007-2013)
ü Italian Program for the Convergence objective regions (less developed
regions in Southern Italy)
ü (Program: National Operative Program (PON) for Project in research &
development)
ü Goal: Evaluate the impact of public funding at regional level
Total cost of the PON Projects à 2500 Million of Euros
About 300 Different R&D Projects 769 distinct partners
Large#Enterprise# Smart#Ci/es#
6%# 8%#
noFPublic#Research#Ins/tute# 12%#
13%# Cultural#Heritage#&#Ac/vi/es#
28%# 12%#
N.C.#
Transporta/on#&#Logis/c#
Small#Enterprise# 21%# Environment##
12%#
19%# Public#Research#Ins/tute#
Energy#
7%#
University#
7%# Nutri/on#
13%# 2%# Micro#Enterprise# 16%#
12%# Healthcare#
12%#
Medium#Enterprise#
N.C.#
(a)# (b)#
• Available information: Calls and funding measures, projects, proponents and
participants, funding, geographical information, etc.
• Data format: open data (xls, XLM, CSV)
21
• Source: : http://www.dati.puglia.it, http://opencoesione.gov.it2007-2013 Italian Public Funding Program:
from dataset to data models.
Projects à 10104 entries with 52
attributes describing project
information about program
references, activities, textual
description of project scope and
objectives, detail about partners
and so on.
Locations à 11390 entries with
8 attributes describing details
about geographical localization of
project partners.
Budgets à 5670 entries with 13
attributes describing details
about amount and state of
project funding.
769 Nodes à Enterprises, Universities,
research institutions.
4868 Links à Participation in the same
project. 22Result #1: community detection
We found 15 main Communities à
• provides a deep understanding of how the fund
allocation criteria are able to influence the
economic development of a Region;
• discovering the existence of groups within a
certain network of relationships;
• highlighting such groups can be very important
for the analysis of a productive system;
• The PON R&D network shows strongly
heterogeneous communities, with hugely
populated groups and very small ones. The community structure of the
(giant component of the) PON R&D
• when communities grow in size, they tend to
network. 15 communities are
include important nodes. For example, the highlighted, found with the Newman-
largest community includes the National Girvan algorithm.
Research Council (CNR, next slide)
23Result #2: it is a network with Hubs
Scale free network à
•Inhomogeneous degree
distribution, with many nodes
having more connections than the
average (hubs)
•Resistance to “random failures”,
indeed the removal of a random
node would not systematically
affect the main hubs
•Policymakers are interested in
generating a solid network of
relationships between productive
actors on the territory
Strong indication that the network of funded
project gravitates around large poles involving
research centers 24Result #3: who are the hubs?
Centrality of nodes à
identifies the most important nodes
within a network
•Dominant role of public research
•Universities and research centers play
the role of the “glue” i.e. they are
responsible of the connectedness of
the network
•Ex-post indicator. The fifteen largest values of each vertex centrality
for the (giant component of the) PON R&D
network. The highest positions are occupied by
public research institutions.
25Result #4: the network is anti-assortative
• Low tendency to form “groups of interest" or “lobbies” among important actors.
• Hubs are strongly connected to smaller and less connected enterprises/institutions.
• It is an interesting result, sincce most social networks show assortative behavior.
• Anti-assortative networks are more sensitive to the removal of high-degree nodes,
which is an indication for the policymaker of the importance that public research
has in the productive system.
Public
Research
Institute
Large
Enterprise
Small-Medium
Enterprise
26I sistemi informativi aziendali producono già molti dati.
I sistemi di business intelligence utilizzano al meglio i
dati?
Quale valore aggiunto possono dare sistemi sofisticati di
gestione e analisi dei dati?
“Fra il forte e il debole è la libertà che opprime e la
legge che libera”
J. H. Lacordaire
27Puoi anche leggere