Il termometro dei mercati finanziari (28 Gennaio 2022) a cura di Emilio Barucci e Daniele Marazzina - FinRiskAlert
←
→
Trascrizione del contenuto della pagina
Se il tuo browser non visualizza correttamente la pagina, ti preghiamo di leggere il contenuto della pagina quaggiù
29/01/2022 | Newsletter-04-2022

                                                                               Spread EU/GER: differenza media tra i tassi di interesse
Il termometro dei mercati                                                      dei principali paesi europei (Francia, Belgio, Spagna,
                                                                               Italia, Olanda) e quelli tedeschi a 10 anni;
finanziari (28 Gennaio 2022)                                                   Euro/dollaro: tasso di cambio euro/dollaro;
                                                                               Spread US/GER 10Y: spread tra i tassi di interesse degli
a cura di Emilio Barucci e                                                     Stati Uniti e quelli tedeschi con scadenza 10 anni;
                                                                               Prezzo Oro: quotazione dell'oro (in USD)

Daniele Marazzina                                                              Spread 10Y/2Y Euro Swap Curve: differenza del tasso
                                                                               della curva EURO ZONE IRS 3M a 10Y e 2Y;
29/01/2022 10:04:25                                                            Euribor 6M: tasso euribor a 6 mesi.

                                                                       I colori sono assegnati in un'ottica VaR: se il valore riportato è
                                                                       superiore (inferiore) al quantile al 15%, il colore utilizzato è
                                                                       l’arancione. Se il valore riportato è superiore (inferiore) al
  L’iniziativa di Finriskalert.it “Il termometro dei mercati
                                                                       quantile al 5% il colore utilizzato è il rosso. La banda (verso l’alto
finanziari” vuole presentare un indicatore settimanale sul grado
                                                                       o verso il basso) viene selezionata, a seconda dell’indicatore,
di turbolenza/tensione dei mercati finanziari, con particolare
                                                                       nella direzione dell’instabilità del mercato. I quantili vengono
attenzione all’Italia.
                                                                       ricostruiti prendendo la serie storica di un anno di osservazioni:
                                                                       ad esempio, un valore in una casella rossa significa che
                                                                       appartiene al 5% dei valori meno positivi riscontrati nell’ultimo
                                                                       anno. Per le prime tre voci della sezione "Politica Monetaria", le
                                                                       bande per definire il colore sono simmetriche (valori in positivo e
                                                                       in negativo). I dati riportati provengono dal database Thomson
                                                                       Reuters. Infine, la tendenza mostra la dinamica in atto e viene
                                                                       rappresentata dalle frecce: ↑,↓, ↔ indicano rispettivamente
                                                                       miglioramento, peggioramento, stabilità rispetto alla rilevazione
                                                                       precedente.

                                                                       Disclaimer: Le informazioni contenute in questa pagina sono
                                                                       esclusivamente a scopo informativo e per uso personale. Le
                                                                       informazioni possono essere modificate da finriskalert.it in
                                                                       qualsiasi momento e senza preavviso. Finriskalert.it non può
                                                                       fornire alcuna garanzia in merito all’affidabilità, completezza,
                                                                       esattezza ed attualità dei dati riportati e, pertanto, non assume
                                                                       alcuna responsabilità per qualsiasi danno legato all’uso, proprio
                                                                       o improprio delle informazioni contenute in questa pagina. I
                                                                       contenuti presenti in questa pagina non devono in alcun modo
Significato degli indicatori                                           essere intesi come consigli finanziari, economici, giuridici, fiscali
                                                                       o di altra natura e nessuna decisione d’investimento o qualsiasi
        Rendimento borsa italiana: rendimento settimanale              altra decisione deve essere presa unicamente sulla base di questi
        dell’indice della borsa italiana FTSEMIB;                      dati.
        Volatilità implicita borsa italiana: volatilità implicita
        calcolata considerando le opzioni at-the-money sul
        FTSEMIB a 3 mesi;
        Future borsa italiana: valore del future sul FTSEMIB;
        CDS principali banche 10Ysub: CDS medio delle
        obbligazioni subordinate a 10 anni delle principali banche     Machine Learning for
        italiane (Unicredit, Intesa San Paolo, MPS, Banco BPM);
        Tasso di interesse ITA 2Y: tasso di interesse costruito
        sulla curva dei BTP con scadenza a due anni;
                                                                       Insurance a cura di M.
        Spread ITA 10Y/2Y : differenza del tasso di interesse dei
        BTP a 10 anni e a 2 anni;
                                                                       Azzone, E. Barucci, D.
        Rendimento borsa europea: rendimento settimanale
        dell’indice delle borse europee Eurostoxx;                     Marazzina
        Volatilità implicita borsa europea: volatilità implicita       28/01/2022 11:52:32
        calcolata sulle opzioni at-the-money sull’indice Eurostoxx
        a scadenza 3 mesi;
        Rendimento borsa ITA/Europa: differenza tra il
        rendimento settimanale della borsa italiana e quello delle
        borse europee, calcolato sugli indici FTSEMIB e
        Eurostoxx;
        Spread ITA/GER: differenza tra i tassi di interesse italiani
        e tedeschi a 10 anni;                                          In the paper “A Machine Learning Model for Lapse Prediction in

© 2021 www.finriskalert.it - Tutti i diritti riservati.
                                                                                                                          Page 1/4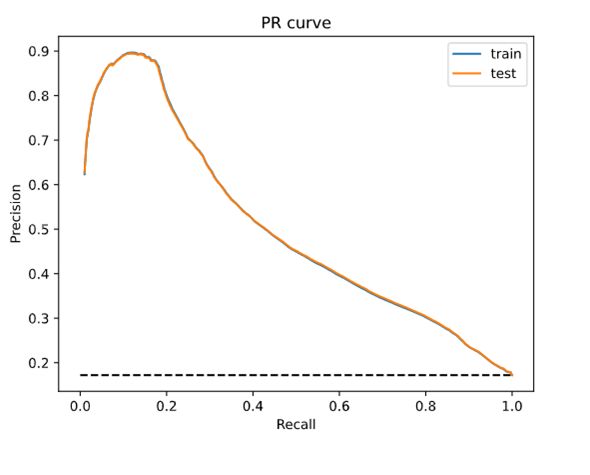
29/01/2022 | Newsletter-04-2022

Life Insurance Contracts” [1], written together with Giancarlo
Giuffra (Politecnico di Milano), we use a random forest to predict
early lapse in life insurance contracts. Estimating the probability
of lapse is estimating the probability that a policy-holder leaves a
contract before expiry. We apply explainability techniques to
understand which (economic and non-economic) variables drive
the policy-holders’ lapse decision.

We confirm that a random performs better than the classical
logistic model to predict the lapse decision, even if the
interactions between features are taken into account. The ML
methodology allowed us to discern the relevance of a wide set of
exogenous variables to explain the lapse decision. The main
result of our analysis is that the important drivers of the lapse
decision are the time passed from the incipit of the contract and
the time to expiry, as well as the insurance company, the
contract size, and premium.

The dataset considered in our analysis comes from one of the
Italian largest insurance companies: it covers the 2008-2016 time
interval with over one million life insurance contracts. The
                                                                       Figure 1: AUPR curve logistic regression on the train and test
contracts refer to three different companies belonging to the
                                                                       sets. Figure 1 in [1].
same insurance group. As the companies refer to different
distributors, either bank assurance relationships or financial
advisors. The lapse phenomenon is company-specific because the
                                                                       In figure 1, we plot the AUPR for the logistic regression on the
lapse decision may be driven by the commercial policies of
                                                                       train and test sets. Notice that the two curves overlap showing
distributors.
                                                                       again that there is no evidence of overfitting: the performance of
                                                                       the model on the training set is similar to that obtained on the
The dataset contains many interesting pieces of information
                                                                       test set. For recall levels greater than 50% (the percentage of
about each policy-holder, such as age, region, or gender, and
                                                                       positive observations classified as positive), we observe that the
about the specific contract, such as size or product type (unit-
                                                                       precision of the logistic classifier (the percentage of observations
linked or standard). Moreover, we consider macro-economic
                                                                       classified as positive that are indeed positive) is always lower
variables relevant for the lapse decision such as GDP, disposable
                                                                       than 45%. These results are quite unsatisfactory.
income, or risk-free interest rate.

We compare the ability of two classification models for the lapse
decision: a logistic regression (considering regularization and
interaction among features) and a RF model (see e.g., [3]). The
empirical literature on lapses of insurance contracts exploiting
classical techniques (in general regressive models) is quite large
but often inconclusive. It is difficult to find a unified framework
for the non-stationary lapse phenomenon in different markets
and times.

In this perspective, ML tools (such as the Random Forest
methodology employed in the paper) provide an interesting
approach. The appealing feature is that they are model-free, they
allow to consider a large set of variables (and their non-linear
interactions) and therefore let the data speak for themselves.

To understand whether this guess is correct we compare the
ability of two classification models for the lapse decision: a
logistic regression (considering regularization and interaction
among features) and a random forest model (RF) model. We use
a classical RF classifier based on a combination of simple             Figure 2: AUPR curve random forest on the train and test sets.
classification trees.                                                  Figure 2 in [1].

The random forest significantly outperforms the logistic
regression. We compare the two models in terms of the area             In figure 2, we plot the AUPR of the random forest on train and
under the precision-recall curve (AUPR). This curve is obtained        test sets. Notice that the performances on the two datasets are
by plotting the Precision (the percentage of observations              similar but, as expected, the performance on the training set is
classified as positive that are indeed positive) against the Recall    slightly better than the performance on the test set. In both
(the percentage of positive observations classified as positive).      cases, the model outperforms considerably the random classifier
                                                                       (that has a precision of 17%) and the logistic regression, see
The AUPR of the random classifier is equal to the percentage of        Figure 1. Considering the test set, for recall values equal to 50%,
positive observations, i.e., observations belonging to class 1 in      precision is nearly 75%, i.e., to correctly classify 50% of the
the dataset (in our case 17%) while for the perfect classifier the     observed lapses, nearly 75% of the observations classified as
AUPR yields 1.                                                         lapse are true positive (for logistic regression it was nearly 45%).

© 2021 www.finriskalert.it - Tutti i diritti riservati.
                                                                                                                         Page 2/4
29/01/2022 | Newsletter-04-2022
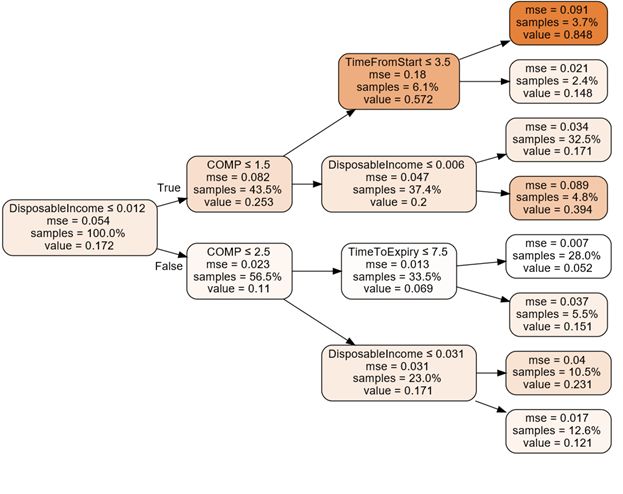
The random forest performance significantly beat the linear the lapse decision.
model. However, the main limit of ML tools is that they appear as
black boxes" that are difficult to be interpreted in terms of causal According to our analysis, the leaf with the highest lapse
relationships between input and output variables. Several probability (84.8%) is obtained with a disposable income growth
methodologies have been proposed in the literature to cope with rate lower (or equal) than 0.012, a policy stipulated with
the explainability/interpretability of the ML. In the paper, we Company A and with time from start smaller (or equal) than 3.5
have used a simple “global" approach. years. On the other hand, the leaf with the smallest lapse
probability (5.2%) is obtained with a disposable income growth
We build the regression tree that better fits the random forest, rate higher than 0.012, a policy stipulated with Company A or B,
i.e., standard features as input and the random forest predictions and with time to expiry smaller (or equal) than 7.5 years.
as output in the training set. We would like to stress that we are
approximating a RF made up of fifty trees, each one with These results are interesting because all the above variables
(maximum) depth 50, with a single regression tree with a much turned out to be statistically significant [2], where the same
smaller depth. dataset is analyzed considering classical linear models, with the
purpose to analyze the lapse rates with respect to major factors
of lapses.
[1] Azzone, M., Barucci, E., Moncayo, G. G., & Marazzina, D.
(2022). A machine learning model for lapse prediction in life
insurance contracts. Expert Systems with Applications, 191,
116261. https://doi.org/10.1016/j.eswa.2021.116261
[2] Barucci, E., Colozza, T., Marazzina, D., & Rroji, E. (2020). The
determinants of lapse rates in the Italian life insurance
market. European Actuarial Journal, 10(1), 149-178.
https://doi.org/10.1007/s13385-020-00227-0
[3] Liaw, A., & Wiener, M. (2002). Classification and regression
by random Forest. R news, 2(3), 18-22.
https://cogns.northwestern.edu/cbmg/LiawAndWiener2002.pdf
Figure 3: Regression tree fitted on the random forest output.
Figure 5 in [1].
La Vigilanza bancaria della
BCE avvia la prova
In figure 3, we plot the regression tree fitted on the random
forest output. di stress sul rischio climatico
Each node of the tree contains the following pieces of 2022
information:
28/01/2022 11:46:31
1. The variable used to split the tree.
2. The mse that measures the pureness of the tree (a mse of
0 means that the leaf correctly classifies each La prova di stress è un esercizio conoscitivo inteso a valutare il
observation). grado di preparazione delle
3. The percentage of observation contained in the node. banche nella gestione del rischio climatico...
4. The estimated lapse probability of the node.
https://www.bancaditalia.it/media/bce-
The variables that appear in this reduced tree are the insurance comunicati/documenti/2022/ssm_pr220127_it.pdf
company of the group (COMP) the Italian disposable income
(DisposableIncome) the time from the beginning of the contract
(TimeFromStart) and the time left before the expiry of the
contract (TimeToExpiry). EIOPA publishes third paper
We observe that this regression tree only uses four of the
variables of the RF model. We notice that observations with on methodological principles
disposable income growth rate smaller than 0.012 are more
likely to lapse. of insurance stress testing
We also notice the relevance of the Company (COMP) which acts
at the second level of the tree. For example, if the disposable
climate risks
income growth rate is low and the policy is stipulated with 28/01/2022 11:45:58
Company A (COMP=1), then the probability to lapse increases
considerably, reaching a 57% probability. We can conclude that,
according to the selected RF model, these are the main drivers of The European Insurance and Occupational Pensions Authority
© 2021 www.finriskalert.it - Tutti i diritti riservati.
Page 3/429/01/2022 | Newsletter-04-2022
(EIOPA) published today its third paper in a series of papers on
the methodological principles of insurance stress testing...
https://www.eiopa.europa.eu/media/news/eiopa-publishes-third-p
aper-methodological-principles-of-insurance-stress-testing-
climate_en
Ethereum hash rate scores
new ATH as PoS migration
underway
28/01/2022 11:45:14
The hash rate surpassed 1.11 PH/s for the first time ever,
breaking the previous high of 1.08 PH/s set on Jan. 13...
https://cointelegraph.com/news/ethereum-hash-rate-scores-new-
ath-as-pos-migration-underway
First DEX on Internet
Computer launches, others
coming soon
28/01/2022 11:44:45
Dfinity Foundation’s Internet Computer blockchain has
welcomed its first decentralized exchange named Sonic...
https://cointelegraph.com/news/first-dex-on-internet-computer-
launches-others-coming-soon
Direttore: Emilio Barucci.
© 2021 FinRiskAlert - Tutti i diritti riservati.
Le opinioni riportate negli articoli e nei documenti
del sito www.finriskalert.it sono espresse a titolo
personale dagli autori e non coinvolgono in alcun modo
l’ente di appartenenza.
Gli articoli e documenti pubblicati nel sito e nella
newsletter FinRiskalert hanno l’esclusiva finalità di
diffondere i risultati di studi e ricerche a carattere
scientifico. Essi non rappresentano in alcun modo
informazioni o consulenza per investimenti, attività
riservata, ai sensi delle leggi vigenti, a soggetti
autorizzati.
© 2021 www.finriskalert.it - Tutti i diritti riservati.
Page 4/4
Powered by TCPDF (www.tcpdf.org)Puoi anche leggere