CESI Group - Elettricità Futura

Pagina creata da Federica Carrara
 
CONTINUA A LEGGERE
CESI Group - Elettricità Futura
CESI Group

   CONFIDENTIAL-LIMITED USE   Milan 20/10/2021
CESI Group - Elettricità Futura
Key figures for current e-Vehicles and charging solutions

                                                   Different charging
                                                 stations for residential
                                                 and public installations
                                                  determine different
                                                   charging time for
                                                    different type of
                                                       e-vehicles

                                                                                                    BMW i3                           125 kW

                                                                                                    FCA 500                          87 kW

                                                                                                    Hyundai Kona Electric            100 kW

                                                                                                    Jaguar i-Pace                    294 kW

                                                                                                    Nissan Leaf                      150 kW

                                                                                                    Renault Zoe                      68 kW

                                                                                                    Smart EQ Fortwo                  60 kW
                                                  Battery capacities and e-vehicles efficiency
                                                 determine the driving range like for the petrol-   Tesla Model 3                    257 kW
                                                                 powered cars                       Tesla Model S                    451 kW
                               DC up to 250 KW

   Source: Enel X, Tesla, Quattroruote                    CONFIDENTIAL-LIMITED USE                                          Milan 20/10/2021
CESI Group - Elettricità Futura
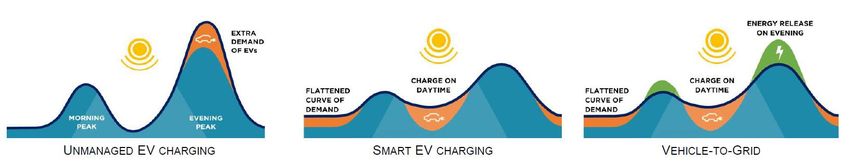
New technologies for e-Vehicles and charging solutions

             High Speed                                     Ultra High Speed                   Electric Highway

                                                                                         Electric highways for trucks are
                                                                                         already realities in different
                                                              In China 900 kW project    countries both in EU and US:
Technology     Common              New           Under        for charging stations Is   • Sweden
              Installation     Installation   Development     under development          • California
 CHAdeMO         50 kW        175-350 kW                      1500 VDC – 600 A           • Germany
                 50 kW                                        An e-vehicle 100 kWh       Not a real novelty, but a potential
  CCS                         175-350 kW
                                                              can be recharged in less   solution for long range and high
  GB/T           50 kW          250 kW           900kW
                                                              than 10 min                consuming e-vehicles
  Tesla          150kW           250kW           300kW

    Source: StarCharge, XCHarge, ABB, Heliox, Alpitronic      CONFIDENTIAL-LIMITED USE                          Milan 20/10/2021
CESI Group - Elettricità Futura
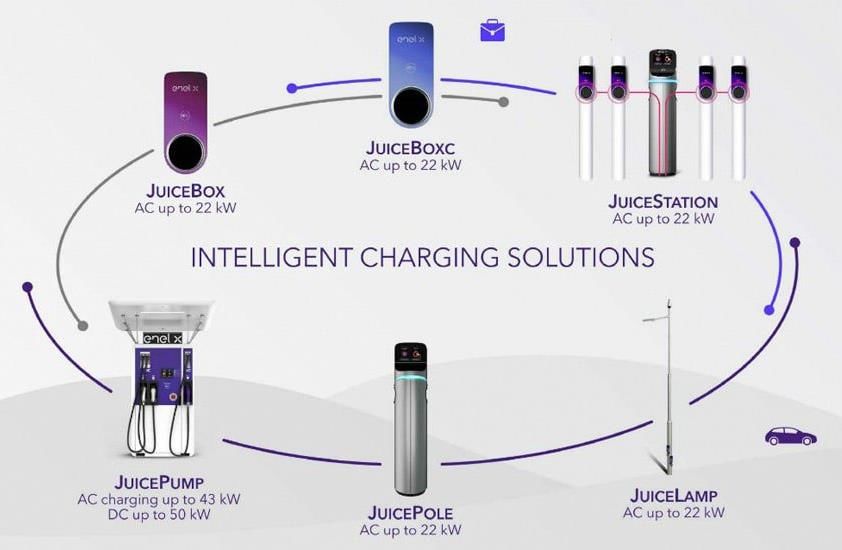
e-Mobility will drive transformation in transport and electricity sector
                                                                                              Figures in
Figures in Million                  2020                             2030                   Thousands CPs
                                                                                                                        2020                                      2030
    vehicles

           EV              0,1                                  6                                    Public       19                                     60-130
    NG + LPG                  3,7                              4,9
                                                                                                    Private       24                                                  2200-4000
   Traditional                                      38,6                     25,6

                       0               20         40       0          20            40                        0            500            1000       0            2000           4000

            ≤ Euro 4
                             46%
                                            54%
                                                           60x vs 2020                                                                               750 M€ PNRR for
                                                                                                                              Highways Urban
                                                           50% CAGR                                                                                  21k Fast Charge
            > Euro 4
                                                                                                                                   7.5 k 13.8 k

  NG = Natural Gas; LPG = Liquefied petroleum gas

    Road traffic and power demand during an average weekday                                                                                                  Share on total
                                                                                                              Energy demand EV Italy 2030*
                                                                                                                                                          energy 2030 (PNIEC)
                                                                             Power demand and

    Long Beach
                                                                           road mobility demand
                                                                           are both characterized
                                                                                                                  13-15 TWh                                       4-5%
    California                                                               by two peaks during
                                                                            morning and evening                                Additional Peak EV Italy 2030**
    United States
                                                                                                                                            4 GW
                                                                            hours and a period of
                                                                             low demand during
                                                                                  night time                  *avg year distance 14,000-16,000 km; 0,16 kWh/km
                                                                                                              **7,4 kW CP and 10% simultaneous factor in peak hours

             Source: UNRAE, Energy & Strategy, Motus-e, PwC, IEA                CONFIDENTIAL-LIMITED USE                                                      Milan 20/10/2021
CESI Group - Elettricità Futura
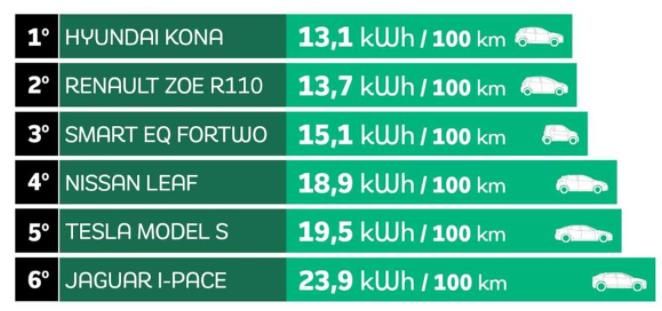
Accurate planning of Vehicle Grid Integration for the entire value chain

                              Technology                             Services                                      Business Models

                       Smart Charging
 Level of complexity

                         Time-of-use                          Ancillary          Demand                      CPs                                EV
                                                                                                                                               owner
                                                              services           response
                         Basic control
                                                                                                Energy                CPOs             EMSP               Automotive

                         V1G                                                                   supplier

                         Dynamic pricing                                                                  Municipal          Roaming
                                                                                                                               hub
                                                                                                                                                Fleet /
                                                                                                                                              Lease Co.
                                                              Micro-grid           Load
                         V2X (V2G, V2H, V2B)                 optimization        following

                                                                                                 Numerous actors are involved in the E-
                                                                                                 mobility ecosystem, with companies
                                                                                                 positioning to cover one or multiple
                                                                                                 roles within the value chain, implying
                                                                                                 different types of business models that
                                                                                                 could be leveraged
                                                                                                 → Increased amount and level of
  Only 5% of total EV battery capacity in                                                        complexity of regulation and data,
2030, if made available for V2G, will unlock                                                     energy and economic flows
        hundreds of GWh of flexibility

                        Source: IRENA, Last Mile Solutions          CONFIDENTIAL-LIMITED USE                                           Milan 20/10/2021
CESI Group - Elettricità Futura
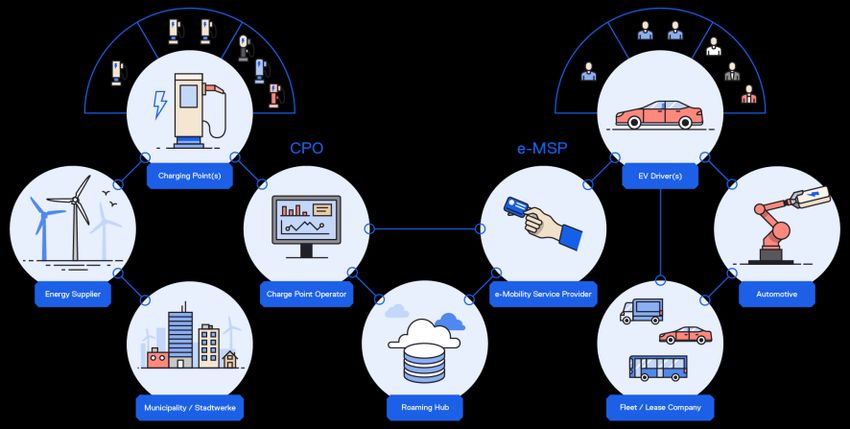
Even low share of EVs will help to deal with renewable intermittency

   Available capacity for V1G and V2G relative to global                    V2G potential and variable renewable capacity relative
   on-board EV battery capacity in the Sustainable                          to total capacity generation requirements in the SDS,
   Development Scenario, 2030                                               2030
                                                                                   Greater contribution of V2G   Variable RES accounts for higher
                                                                                                                 shares during off-peak periods

About 5% of total global EV battery capacity could be available for     V2G services could unlock up to 600 GW of flexible capacity
V2G, unlocking several hundreds of gigawatt-hours to meet peak          distributed across the main EV markets in 2030 and moderate
demand.                                                                 intermittency of variable renewables during peak demand.

          An effective VGI could make EVs an advantageous resource for the power system, while
                           providing value to the relevant stakeholders, thanks to:
                                                                         Favorable tariffs and additional
         Improved grid stability    Lower Total Cost of Ownership
                                                                             revenues for operators

         Source: IEA                                         CONFIDENTIAL-LIMITED USE                                         Milan 20/10/2021
CESI Group - Elettricità Futura
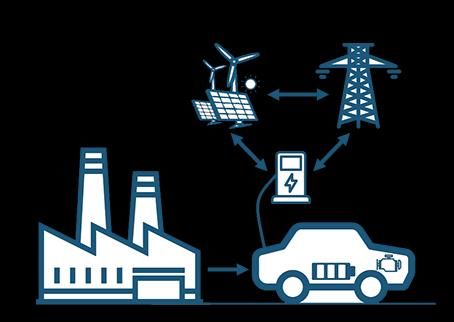
Milan (IT)· Arnhem (NL) · Berlin (DE)· Mannheim (DE) · Prague (CZ)· Chalfont (US) · Knoxville (US)· Dubai (AE)· Dammam (SA) · Santiago de Chile (CL) · Rio De Janeiro (BR)· Shanghai (CN)

                                                                                    CONFIDENTIAL-LIMITED USE                                                              20/10/2021   7
CESI Group - Elettricità Futura
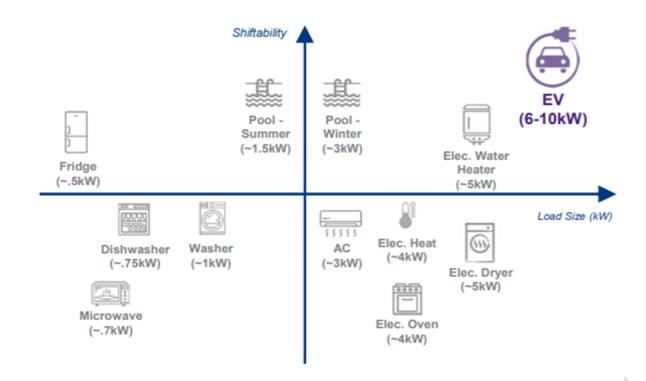
PNIEC nel contesto del percorso di decarbonizzazione
L’obiettivo fissato da PNIEC di raggiungere il 22% di FER nei consumi finali lordi di energia nei trasporti è sicuramente sfidante e il
suo conseguimento nel decennio 2020-2030 porrebbe l’Italia all’avanguardia in Europa, essendo l’obiettivo europeo del 14%

Tale obiettivo è peraltro giustificato nell’ambito del processo di decarbonizzazione dell’intera economia ed attività umane. In
Italia il settore trasporti è quello che maggiormente contribuisce alle emissioni di GHG, mentre il settore elettrico è il «forerunner»
nella decarbonizzazione con una riduzione del 47% della CO2 intensity(1) rispetto al 1990.

        Emissioni gas serra in Italia: 427 Mton CO2 eq (2)                                      Agriculture

                                                                                                Waste
                                 16%
                                             10%                                                Transport

                                                                                                Industry
                       18%                                                 17%                  Commercial/residential
                                                   23%
                                                                                                Other
                                                                           6%                   Power and Heat
                              22%               7%                                                                           Energy industries
                                           4%                                                   Other Energy
                                                                                               (Petroleum Refining,
                                                                                               manufacture of solid fuels)

                    Il settore elettrico rappresenta soltanto il 17% delle emissioni totali italiane

       (1) gCO2/kWh, Dati ISPRA 2017 su fonte ISPRA 2019
       (2) Dati 2018 su fonte ISPRA 2020                        CONFIDENTIAL-LIMITED USE                                          Roma 09/07/2020 8
CESI Group - Elettricità Futura
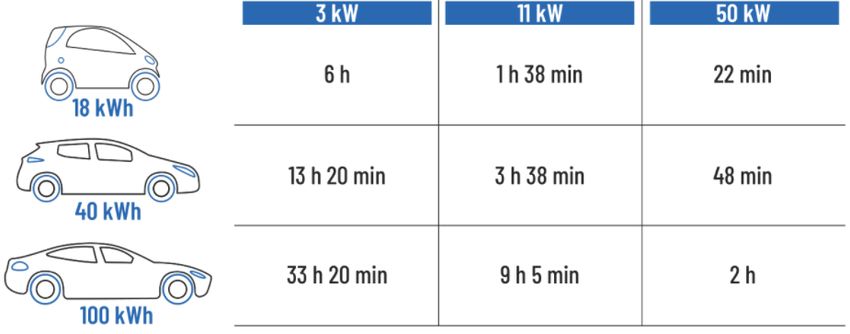
Ruolo del settore trasporti nel processo di decarbonizzazione

      Non solo il settore trasporti è quello che maggiormente contribuisce alle emissioni GHG, ma il trend non è
                       positivo a livello Europeo. In Italia si è verificato un aumento più contenuto

                                  Emissioni di gas serra per settore nei Paesi UE-28 e in Italia 1990-2016
                                                                            [Mt CO2 equivalenti]

                     -32%

                   1869
                                       -38%

                                     1359              +18%                                                  +3%
                          1280
                                                                           -21%                  -20%
                                                              931
                                            849         787               731
                                                                                  575           641
                                                                                                      511

                                                                                                             102 105

                  Fornitura di        Industria         Trasporti       Residenziale           Agricoltura   Trasporti
                   energia
                                                                            1990        2016

Fonte: The European House - Ambrosetti, European Environment Agency 2019, ISPRA

                                                                           CONFIDENTIAL-LIMITED USE                      Roma 09/07/20209
CESI Group - Elettricità Futura
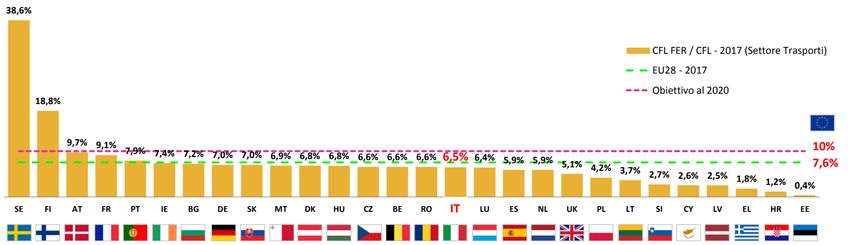
Quota rinnovabili nel settore trasporti in Italia e in Europa: presente e futuro

                                                   Quota FER nel settore trasporti

                                                                                                            *

                                                                             22%                         Obiettivo al 2030

                                                                                                         Obiettivo PNIEC al 2030
                                                                                                                                             14%

•   La quota di FER nei consumi finali di energia per i trasporti in Italia è abbastanza stabile da anni, intorno al 6%, leggermente
    inferiore alla media europea
•   In Italia il contributo di FER nel consumo di energia è essenzialmente legato al trasporto ferroviario, dovuta alla alta
    elettrificazione della rete ferroviaria, nonché all’uso di biocombustibili
•   Il raggiungimento degli obiettivi prefissati richiede particolare attenzione al trasporto su strada, settore nel quale si è
    praticamente all’anno zero, con l’obiettivo primario di:
       ➢ Conseguire l’obiettivo del PNIEC senza creare costi aggiuntivi per l’utente finale e in generale il contribuente
       Tutto ciò considerando che sottostante vi sta un beneficio ambientale legato alle emissioni evitate di GHG

      Fonte: GSE           *Consumi Finali Lordi               CONFIDENTIAL-LIMITED USE                                            Roma 09/07/2020 10
Il mix di generazione italiano rende particolarmente favorevole una
transizione verso l’elettrificazione dei consumi finali e dei trasporti

Fonte: Transport Environment

                                    CONFIDENTIAL-LIMITED USE              Roma 09/07/2020 11
Il veicolo elettrico ha caratteristiche tecniche ed economiche che si
coniugano in maniera ottimale con le esigenze della rete
             Taglia e modulabilità                                                               Economicità                                                               Stazionarietà

Le infrastrutture di ricarica dei veicoli elettrici             Rispetto a soluzioni di storage centralizzate e                                                 Il veicolo privato è parcheggiato e
     hanno un carico consistente e una                          tecnologie tradizionali lo storage del veicolo                                              potenzialmente disponibile e connesso alla
modulabilità agevole per operazioni rapide                      elettrico è un investimento a costo zero per il                                            rete per circa il 95% della giornata. Un valore
              di demand response                                 Sistema in quanto già acquisito dal cliente                                                 comparabile con la disponibilità di unità
                                                                    finale per scopi diversi dai servizi di rete                                                              tradizionali
                                                             Costo
                                                             € /kWh                                     Storage                          ESEMPLIFICATIVA
                                                                                                        Demand
                                                                                                                  Storage e Tecnologie
                                                                                                                  alternative

                                                                                                                                                            5%                    95%
                                                                                                                                pompaggi
                                                                                              1st use
                                                                                    2nd use
                                                                                                                                                                                 24h
                                                                      Batteria EV
                                                                                                                                                Potenza
                                                                                                                                                  MW

                                             Le batterie degli EV sono risorse distribuite che possono essere
                                                    aggregate per fornire servizi di rete generando valore

                                                       ✓ EV abilitati attraverso                                               ✓ Decreto 30/01/20 e DCO
                                                      progetto UVAM (Unità Virtuali                                              ARERA 201/2020/R/eel per
                                                             Abilitate Miste)                                                   promozione partecipazione
                                                                                                                                    EV a servizi di rete

                                                                                                CONFIDENTIAL-LIMITED USE                                                                    Roma 09/07/2020 12
Differenti modalità di Vehicle-Grid-Integration (VGI)
V1G vs V2G: quali differenze?

               No smart charging                         V1G                               V2G

        ✓ Ricarica dettata da esigenza   ✓ Ricarica dilazionata nel tempo e   ✓ Ricarica dilazionata nel tempo
          di capacità immediata            ottimizzata                          e possibilità di re immissione

        ✓ Rischio di picchi di potenza   ✓ Capacità di spostamento dei        ✓ Spostamento dei picchi di
                                           picchi di carico                     carico e inseguimento
        ✓ Non compatibile con                                                   domanda
          generazione rinnovabile        ✓ Assecondati i profili di
                                           generazione delle FER              ✓ Sfruttamento dei picchi FER

    Fonte: DTU, elaborazioni CESI               CONFIDENTIAL-LIMITED USE                            Roma 09/07/2020 13
Fattori abilitanti per un’opportuna VGI

                               A                                                           B

                                                                           Sfruttare il potenziale dei servizi
            Estendere i servizi erogabili da
                                                                            di demand response al fine di
             EV per la stabilità e sicurezza
                                                                                ridurre le congestioni (in
              della rete iniziando dai più
                                                                                 particolare sulla rete di
               promettenti per volumi e
                                                                              distribuzione) e contribuire
                    requisiti tecnici
                                                                              all’adeguatezza del sistema

                           C                                                               D

                Fornire agli operatori una
                     visione affidabile                                       Ove possibile, alleggerire i
              dell’evoluzione regolatoria, al                               requisiti tecnici o creare nuovi
             fine di permettere la creazione                               servizi remuneratori compatibili
              di business models sostenibili                                con le caratteristiche tecniche
                    anche oltre il 2020                                          degli aggregati di EV
            (superamento di progetti pilota)

                                                CONFIDENTIAL-LIMITED USE                                         Roma 09/07/2020 14
VGI Applications: even a low share of EVs to provide flexibility could help the
  power system to deal with renewable intermittency
   Available capacity for V1G and V2G relative to global                    V2G potential and variable renewable capacity relative
   on-board EV battery capacity in the Sustainable                          to total capacity generation requirements in the SDS,
   Development Scenario, 2030                                               2030
                                                                                   Greater contribution of V2G   Variable RES accounts for higher
                                                                                                                 shares during off-peak periods

About 5% of total global EV battery capacity could be available for     V2G services could unlock up to 600 GW of flexible capacity
V2G, unlocking several hundreds of gigawatt-hours to meet peak          distributed across the main EV markets in 2030 and moderate
demand.                                                                 intermittency of variable renewables during peak demand.

          An effective VGI could make EVs an advantageous resource for the power system, while
                           providing value to the relevant stakeholders, thanks to:
                                                                         Favorable tariffs and additional
         Improved grid stability    Lower Total Cost of Ownership
                                                                             revenues for operators

         Source: IEA                                         CONFIDENTIAL-LIMITED USE                                         Roma 20/10/202115
Puoi anche leggere