Uno sguardo freddo sul riscaldamento globale - Gianluca Alimonti
←
→
Trascrizione del contenuto della pagina
Se il tuo browser non visualizza correttamente la pagina, ti preghiamo di leggere il contenuto della pagina quaggiù
Uno sguardo freddo
                        sul riscaldamento globale

                                 Gianluca Alimonti
                           INFN & Universita’ degli Studi
                                     Milano

    •   Il sistema climatico
    •   Relazione storica fra T e CO2
    •   Previsioni ed osservazioni di T
    •   Previsioni ed osservazioni di eventi estremi
    •   Considerazioni sul sistema energetico

Il linguaggio dell’esperienza e’ piu’ autorevole di
tutti i ragionamenti; i fatti possono distruggere i
nostri raziocinii, non viceversa”. A.Volta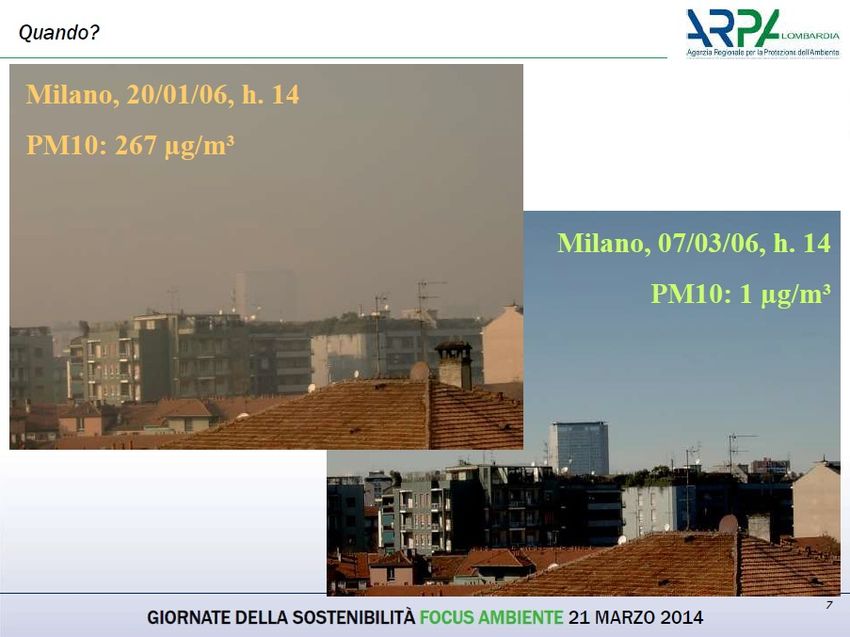
Bilancio energetico del sistema Terra
La temperatura dell’atmosfera terrestre dipende dall'equilibrio tra la radiazione solare
che la Terra assorbe e la radiazione “terrestre” che emette verso lo spazio esterno.

   T media -18          .

                                Fig 2.11, quinto rapporto IPCC, 2013. Intergovernmental Panel on Climate
                                Change (IPCC) is the leading international body for the assessment of
                                climate change. It was established by the United Nations Environment
   Milano, 24/03/2018           Programme (UNEP) G.Alimonti
                                                      and the World Meteorological Organization (WMO)3in
                                1988 to provide the world with a clear scientific view on the current state of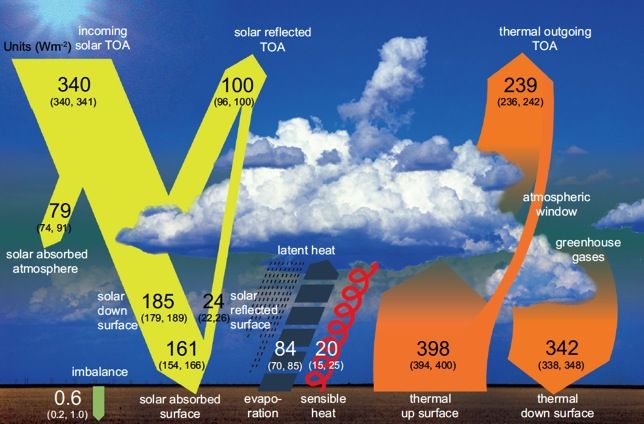
Atmosfera terrestre: peso delle diverse sostanze a effetto serra

Effetto serra: senza l’effetto serra la T media della Terra sarebbe di -18                            .
         Grazie all’effetto serra la Terra ha una T media di +15 .

   Milano,
Source     24/03/2018
        - LACIS A.A., Schmidt G.A., Rind D. RuedyG.Alimonti
                                                  R.A., 2010. Science, 15 OCTOBER 2010 VOL 330.   4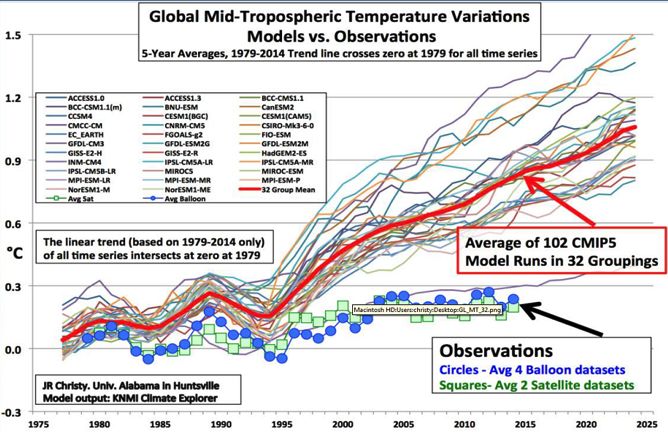
CO2 e temperature globali (ultimi 500 milioni di anni)

Milano, 24/03/2018            G.Alimonti                         5

Temperature globali (ultimi 450 mila anni)

                                                                                Radiostratigraphy and age
                                                                                structure of the Greenland Ice
                                                                                Sheet, Journal of geophysical
                                                                                research, Earth surface, Volume
                                                                                120, Issue 2, pages 212–241,
                                                                                McGregor et al. February 2015

                                                                                Antonioli F., e Silenzi S.,
                                                                                (2007). Variazioni relative del
Petit et al., 1999, Climate and Atmospheric History of the Past 420,000 years   livello del mare e vulnerabilità
from the Vostok Ice Core, Antarctica, Nature, 399, pp.429-436                   delle pianure costiere italiane.
                                                                                Quaderni della Società
   Milano, 24/03/2018                                G.Alimonti                 Geologica Italiana, 2        6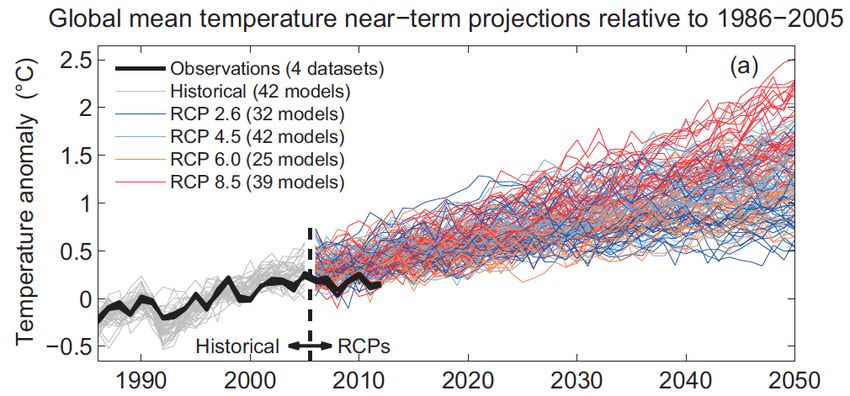
Orbital forcing is considered the pacemaker of transitions between
       glacial and interglacial (IPCC 2013 « high confidence »).

                CO2      CO2 (ppm)
                         T°C
                T

                             t

At 240000 BP, temperature increase is before CO2 increase by a 800y time shift. Time/
temperature relationship calibrated by Argon isotopes (Caillon et al 2001, 2003)
http://euanmearns.com/the-vostok-ice-core-and-the-14000-year-co2-time-lag/

Milano, 24/03/2018                        G.Alimonti                                    7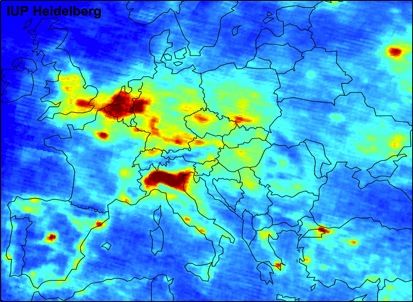
Ricostruzione di T e CO2 dopo l’ultima glaciazione
                       (Alley 2000, from GISP2 ice core data).

Milano, 24/03/2018                  G.Alimonti                   8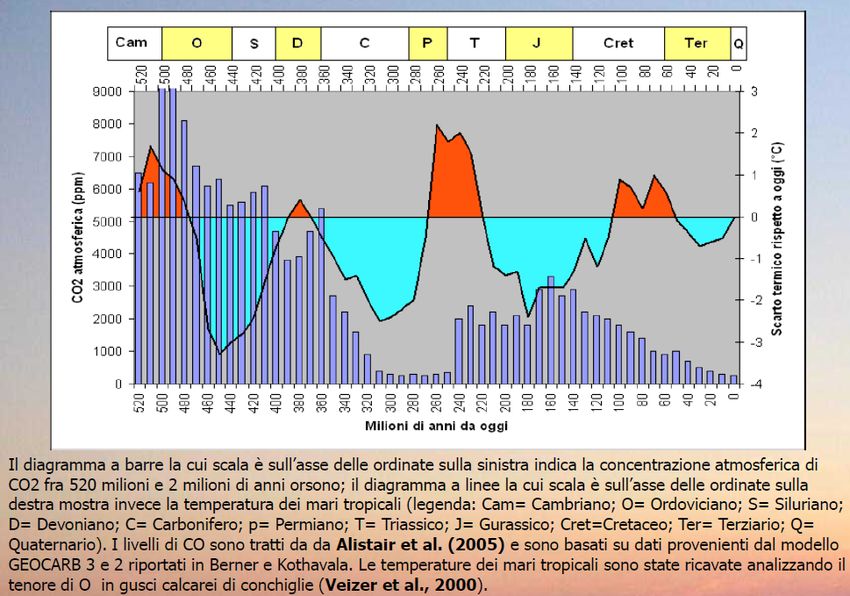
0,6 °C

Warming of the climate system is unequivocal, and since the 1950s, many of the
observed changes are unprecedented over decades to millennia. The atmosphere
and ocean have warmed, the amounts of snow and ice have diminished, sea level
has risen, and the concentrations of greenhouse gases have increased
                                                         IPCC AR5 SPM, 2013

 Milano, 24/03/2018                G.Alimonti                                  9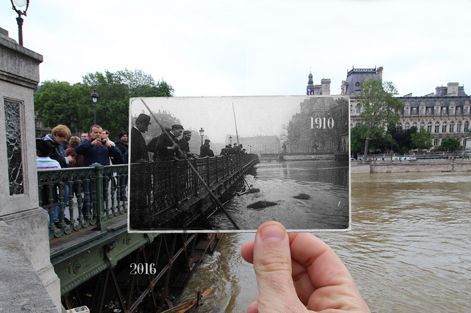
It is extremely likely that human influence has been the dominant cause of the
  observed warming since the mid-20th century.        IPCC AR5 SPM, 2013

Concentrazioni CO2 pre-1950
simili alle preindustriali

                         Emissioni di CO2 dalla combustione dei combustibili fossili

   Milano, 24/03/2018                    G.Alimonti                                    10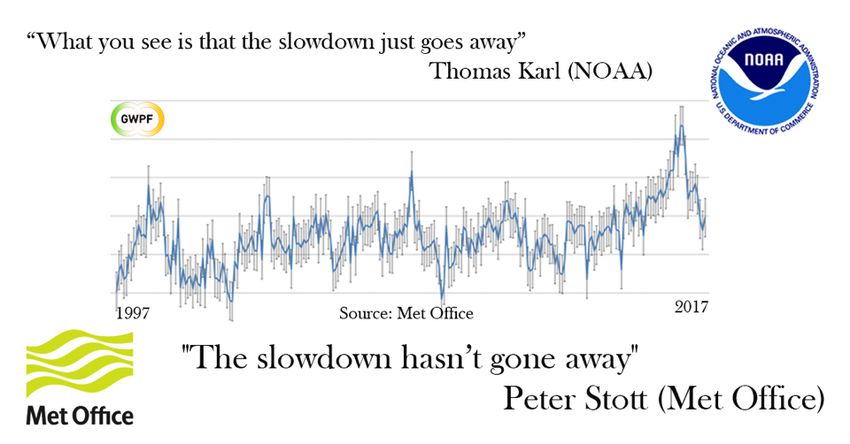
Proiezioni dei modelli (GCM)

Most of the CMIP5 and Earth System Model simulations were performed with
prescribed CO2 concentrations reaching 421 ppm (RCP2.6), 538 ppm (RCP4.5),
670 ppm (RCP6.0), and 936 ppm (RCP 8.5) by the year 2100.
                                                Source: IPCC AR5 SPM, 2013
  Milano, 24/03/2018               G.Alimonti                                11
ΔF(W/m2)=5,35 ln C/Co
ΔT (K) = 0,3 ΔFCO2 (linearizzazione della S-B) Livello
attuale
Livello
preindustrializzazione
Dal periodo preindustriale ad ora la concentrazione di CO2 è passata da circa 280 a 400
ppm, l’IPCC ha dato una formula per valutare l’aumento di fattore forzante: ΔF(W/m2)=5,35 ln
C/Co, con questa si ricava ΔF=1,9 W/m2, a cui corrisponde circa un Δ T ~= 0,6 .
Analogamente prevedendo un raddoppio della concentrazione di CO2 da 400 a 800ppm, si
può ricavare
Milano, che ΔF ~=3,7 W/m2 e concomitantemente
24/03/2018 G.Alimonti ΔT~=1,1 . 12Importanza dei feedback
Vapore
Lapse rate
Albedo
Nuvole
Metano dal permafrost
Emissione di CO2 da oceani
Blackbody
The water vapour/lapse rate, albedo and cloud feedbacks are the principal
determinants of equilibrium climate sensitivity. All of these feedbacks are
assessed to be positive, but with different levels of likelihood assigned ranging
from likely to extremely likely. Therefore, there is high confidence that the net
feedback is positive and the black body response of the climate to a forcing will
therefore be amplified. Cloud feedbacks continue to be the largest uncertainty.
CLIMATE CHANGE 2013
The Physical Science Basis, IPCC AR5
Milano, 24/03/2018 G.Alimonti 13CO2 o feedback nei modelli? Milano, 24/03/2018 G.Alimonti 14
I modelli sovrastimano la crescita di T?

                                     CLIMATE CHANGE 2013
                                     The Physical Science Basis, IPCC AR5

Milano, 24/03/2018              G.Alimonti                                  15
NATURE CLIMATE CHANGE | VOL 3 | SEPTEMBER 2013 Overestimated global warming Milano, 24/03/2018 G.Alimonti 16 over the past 20 years. John C. Fyfe, Nathan P. Gillett and Francis W. Zwiers
However, the implied rates of warming over the period from 1986–2005 to 2016–2035
are lower as a result of the hiatus: 0.10 to 0.23 per decade, suggesting the AR4
assessment was near the upper end of current expectations for this specific time
interval. Source: IPCC, Fig 11.25b AR5

The observed global temperatures for the past decade are at the bottom bound of the 5–95%
envelope of the CMIP5 climate model simulations. Overall, the trend in the climate model
simulations is substantially larger than the observed trend over the past 15 years. Regarding
projections for the period 2015–2035, the 5–95% range for the trend of the CMIP5 climate model
simulations  is 0.11–0.41◦C per decade. The IPCC
    Milano, 24/03/2018                               then cites ‘expert judgment’ as the rationale
                                               G.Alimonti                                       17 for
lowering the projections (indicated by the red hatching in Figure 11.25b
Assessing atmospheric temperature data sets for climate studies
Cederlof et al., Tellus A 2016, 68, 31503, http://dx.doi.org/10.3402/tellusa.v68.31503
Observed near-surface temperature trends during the period 1979-2014 show large differences
between land and ocean, with positive values over land (0.25-0.27 /decade) that are significantly
larger than over the ocean (0.06-0.12 /decade). Temperature trends in the mid-troposphere of
0.08-0.11 /decade, on the other hand, are similar for both land and ocean and agree closely with
the ocean surface temperature trend…It is therefore suggested to use either the more robust
Milano, 24/03/2018 G.Alimonti 18
tropospheric temperature or ocean surface temperature in studies of climate sensitivity.Causes of differences in model and satellite tropospheric warming rates D.Santer et al., Nature Geoscience 10, doi:10.1038/ngeo2973 19/06/2017 In the early twenty-first century, satellite-derived tropospheric warming trends were generally smaller than trends estimated from a large multi-model ensemble. …Over most of the early twenty-first century, however, model tropospheric warming is substantially larger than observed; …We conclude that model overestimation of tropospheric warming in the early twenty-first century is partly due to systematic deficiencies in some of the post-2000 external forcings used in the model simulations. Emission budgets and pathways consistent with limiting warming to 1.5 C Miller et al. PUBLISHED ONLINE: 18 SEPTEMBER 2017 | DOI: 10.1038/NGEO3031 the CMIP5 ensemble-mean human induced warming is over 0.3 warmer than the central estimate for human-induced warming to 2015. "We haven't seen that rapid acceleration in warming after 2000 that we see in the models," said Myles Allen, professor of geosystem science at Oxford and one of the authors of the study. "We haven't seen that in the observations." Milano, 24/03/2018 G.Alimonti 19
Barack Obama: «Anche il clima è un business, Trump capirà»
          Corriere della Sera, 4 Maggio 2017

Milano, 24/03/2018                 G.Alimonti                          20
Confronti su T: conclusioni
Una percentuale significativa, attorno al 50%, del riscaldamento del XX secolo
sembra derivare principalmente da processi naturali.
0,6 °C
Se la temperatura continuasse a salire come si e’ osservato dalla seconda
meta’ del XX secolo ad oggi, molto probabilmente entro la fine di questo secolo
rispetteremmo l’accordo di Parigi anche in uno scenario BAU.
Milano, 24/03/2018 G.Alimonti 21Previsioni ed osservazioni di eventi estremi Sebbene questi siano indice di drammatiche devastazioni e numerosi decessi, il punto e' quanto/se questi stiano aumentando in intensita' o frequenza e quanto siano attribuibili al riscaldamento globale. Importante sottolineare la differenza tra evidenza statistica di eccesso di eventi estremi e calcolo probabilistico di attribuzione antropica di evento estremo: i due aspetti hanno consistenze ben differenti. Come vedremo, le evidenze statistiche sono alquanto deboli se non nulle, come anche sostenuto dal documento dell'IPCC " Managing the risks of extreme events and disasters to advance climate change adaptation. Summary for policymakers". Milano, 24/03/2018 G.Alimonti 22
Tornado
 There is low confidence in observed trends in small spatial-scale phenomena such as tornadoes
 and hail because of data inhomogeneities and inadequacies in monitoring systems.
                               Source: Managing the risks of extreme events and disasters to advance
                               climate change adaptation. Summary for policymakers, IPCC 2012.

“The United States had one of its most active tornado seasons on record in 2011.” Source: WMO
“The global climate in 2011-2015”, con lo scopo di "strengthen the scientific foundation for
     Milano, 24/03/2018
implementing                                 G.Alimonti
               the Paris Agreement and adjusting  national policies.”                        23
There is low confidence in any observed long-term (i.e., 40 years or more) increases in
tropical cyclone activity (i.e., intensity, frequency, duration), after accounting for past changes
in observing capabilities. The uncertainties in the historical tropical cyclone records, the
incomplete understanding of the physical mechanisms linking tropical cyclone metrics to
climate change, and the degree of tropical cyclone variability provide only low confidence for
the attribution of any detectable changes in tropical cyclone activity to anthropogenic
influences. Attribution of single extreme events to anthropogenic climate change is
challenging. Source: Managing the risks of extreme events and disasters to advance
climate change adaptation. Summary for policymakers, IPCC 2012.
Milano, 24/03/2018 G.Alimonti 24WMO:" Overall global tropical cyclone activity was above normal in 2013 and 2015, with 94 and 91 cyclones reported, respectively (compared with the 1981–2010 average of 85).” Milano, 24/03/2018 G.Alimonti 25
National Oceanic and
                       Atmospheric Administration

Global Warming and Hurricanes
An Overview of Current Research Results
Geophysical Fluid Dynamics Laboratory/NOAA
https://www.gfdl.noaa.gov/global-warming-and-hurricanes/

Synthesis and Summary for Atlantic Hurricanes and Global Warming
In summary, neither our model projections for the 21st century nor our analyses of
trends in Atlantic hurricane and tropical storm counts over the past 120+ yr support
the notion that greenhouse gas-induced warming leads to large increases in either
tropical storm or overall hurricane numbers in the Atlantic. One modeling study
projects a large (~100%) increase in Atlantic category 4-5 hurricanes over the 21st
century, but we estimate that this increase may not be detectable until the latter half
of the century.

    Therefore…it is premature to conclude that human activity–and particularly
greenhouse warming–has already caused a detectable change in Atlantic hurricane
                                    activity.
  Milano, 24/03/2018                      G.Alimonti                               26
Inondazioni
There is limited to medium evidence available to assess climate-driven observed changes in the
magnitude and frequency of floods at regional scales because the available instrumental records
of floods at gauge stations are limited in space and time, and because of confounding effects of
changes in land use and engineering. Furthermore, there is low agreement in this evidence, and
thus overall low confidence at the global scale regarding even the sign of these changes.
Source: Managing the risks of extreme events and disasters to advance
climate change adaptation. Summary for policymakers, IPCC 2012.
Livello 2016
http://www.mymodernmet.com/profiles/blogs/julien-
knez-paris-flooding-then-now
Milano, 24/03/2018 G.Alimonti 27High-magnitude flooding across Britain since AD 1750 Neil Macdonald and Heather Sangster Hydrol. Earth Syst. Sci., 21, 1631–1650 The findings identify that whilst recent floods are notable, several comparable periods of increased flooding are identifiable historically, with periods of greater frequency (flood-rich periods)… the current flood-rich period is not unprecedented. Maximum flow rate of The Thames at Kingston. The red line marks the peak flow of December 2013 that was matched or exceeded on 14 occasions since 1880. Chart from The Met Office. Milano, 24/03/2018 G.Alimonti 28
Desertificazione?

  We show a persistent and widespread increase of growing season integrated long-
  term satellite leaf area index (LAI, greening) over 25% to 50% of the global
  vegetated area, whereas less than 4% of the globe shows decreasing LAI
  (browning). Factorial simulations with multiple global ecosystem models suggest
  that CO2 fertilization effects explain 70% of the observed greening trend…

                                                 Greening of the Earth and its drivers.
                                                 Zaichun Zhu et al. Nature Climate
                                                 Change, 25 april 2016

"The greening over the past 33 years reported in this study is equivalent to adding a
green continent about two-times the size of mainland USA” lead author Dr. Zaichun Zhu
 https://phys.org/news/2016-04-co2-fertilization-greening-earth.html#jCp
     Milano, 24/03/2018                G.Alimonti                                  29
L’andamento delle produzioni agricole mondiali unitarie (tonnellate/ettaro) delle quattro colture che nutrono il mondo (riso, mais, frumento e soia) visto attraverso le statistiche FAO ci segnala che dal 1961 a oggi è in atto un incremento annuo assai rilevante (+6% l’anno per il mais, +5% per il riso, +4% per il frumento e +3% per la soia) che non si concilia in alcun modo con un un cambiamento climatico a carattere distruttivo. Elaborazione dati Prof. L. Mariani Milano, 24/03/2018 G.Alimonti 30
WMRS crops production (Million t)   5000

                                        4500

                                        4000

                                        3500

                                        3000
                                                                                               Base
                                        2500

                                        2000                                                   Latitudinal expansion

                                        1500                                                   Without water limitation
                                        1000

                                        500

                                           0
                                               180/-6   280/-1    400/0      560/+2   800/+4

                                               -51%     -16%     Scenario   +17%      +34%

Produzione globale per frumento + mais + riso + soia (WMRS) ottenuti con i 5
scenari di concentrazione atmosferica di CO2, nell'ipotesi con o senza limitazione
idrica e con o senza espansione verso nord delle colture.
L.Mariani “Carbon plants nutrition and global food security”, Eur. Phys. J. Plus (2017)
  Milano, 24/03/2018                                                  G.Alimonti                                          31
Cambiamenti climatici e migrazioni Brexit was caused in part by climate change, former US Vice-President Al Gore has said, warning that extreme weather is creating political instability “the world will find extremely difficult to deal with”. Mr Gore, speaking at an event in which he previewed a sequel to his landmark 2006 documentary, An Inconvenient Truth, said the “principal” cause of the Syrian Civil War had been the worst drought in 900 years, which forced 1.5 million people to move from the countryside to the cities. http://www.independent.co.uk/environment/brexit-climate-change-al-gore-says- global-warming-syria-war-helped-leave-vote-a7645866.html Milano, 24/03/2018 G.Alimonti 32
Migranti climatici dalla Siria?...

Banca dati internazionale GHCN (Global Historical Climatology Network): i dati sono riferiti
a 7 stazioni siriane (Aleppo, Damasco, Deir Ezzor, Hama, Kamishli, Lattakia e Palmira)
Elaborazione dati Prof. L. Mariani

Milano, 24/03/2018                       G.Alimonti                                      33
Produzione di frumento in Siria

     Dati presenti nel dataset mondiale della FAO Faostat3: il diagramma ci mostra
     per la Siria l’andamento dal 1961 ad oggi delle rese unitarie ettariali di frumento.
     Elaborazione dati Prof. L. Mariani
     Per ulteriori approfondimenti: “Climate change and the Syrian civil war revisited”
     J.Selby et al., Political Geography 60 (2017) 232e244
Milano, 24/03/2018                        G.Alimonti                                        34
Convective events, i.e. flash floods, hail storms, tempest storms, tornados, and lightning, deserve closer attention since these are possibly affected by global warming (Trapp et al. 2007, 2009; Kuntz et al. 2009). Figure 5a shows that there is no significant trend in global insured losses for these peril types. Similarly, there is no significant trend in insured losses for storm events, tropical cyclones or precipitation-related events. Source: A trend analysis of normalized insured damage from natural disasters The Munich Re Program: Evaluating the Economics of Climate Risks and Opportunities in the Insurance Sector Milano, 24/03/2018 G.Alimonti 35
On average, the globe suffers some 325 catastrophic natural disasters a year, but
last year (through November 2017) they were down to around 250, according to the
Centre for Research on the Epidemiology of Disasters at the University of Leuven in
Belgium. A third fewer people were killed by climate-related hazards, according to the
Centre’s   International Disaster Database.
   Milano, 24/03/2018                   G.Alimonti                               36
Source: The International Disaster Database, http://emdat.be/emdat_db/

Milano, 24/03/2018                     G.Alimonti                                    37
Incidence of the phrase “extreme weather” on the pages of The New York Times,
one of the leading US newspapers from 1965 to 2014. The use of the phrase
skyrocketed over the recent decade, completely out of proportion with observed
trends in weather events.           Source: Catastrophes of the 21st Century
                                   R.Pielke Jr. University of Colorado
 Milano, 24/03/2018                 G.Alimonti                              38
Eventi estremi: conclusioni Credo si possa concludere che non esistono (o per lo meno i report della WMO e dell’IPCC non riportano) statistiche che mostrino aumenti di intensita' o frequenza degli eventi estremi: gli studi di attribuzione antropica di eventi che non mostrano alcun trend hanno una limitata consistenza. Cio' non vuol dire che con gli aumenti di T previsti dall'IPCC per fine secolo non ci potra' essere recrudescenza di eventi estremi, ma questo e’ un altro discorso che, in assenza di evidenza scientifica, rientra meglio tra le speculazioni probabilistiche. Milano, 24/03/2018 G.Alimonti 39
Quindi:
 La Temperatura globale sale molto meno del previsto e non si osserva
         aumento di frequenza o intensita’ di eventi estremi.
                          Ma allora….
    Hanno senso gli enormi investimenti che si stanno facendo nelle
  tecnologie energetiche “low carbon”? (circa 1000 miliardi USD/year)

                                                    Source: Perspectives for the
                                                    energy transition
                                                    OECD/IEA and IRENA 2017

Milano, 24/03/2018             G.Alimonti                                      40
Le nuove tecnologie “hanno bisogno” dei CC?
Motivazioni della politica energetica EU:
(da “Una politica energetica per l'Europa”,
Bruxelles, 15 gennaio 2007)
• sostenibilita’
• sicurezza degli approvvigionamenti
• competitivita’ ?
Carbon Capture and Sequestration:
con le tecnologie attuali, il costo
dell’energia cresce di oltre il 50%
“Affordability and decarbonisation must not
be prioritised ahead of security of the UK's
energy supply” House of Lords committee,
24 Feb. 2017
Milano, 24/03/2018 G.Alimonti 41Le nuove tecnologie “hanno bisogno” dei CC?
Courtesy of dr. Lazzarini, ARPA Lombardia
Almost 7 million deaths were attributable to
the joint effects of household (HAP) and
ambient air pollution (AAP) in 2012.
Fonte: WHO 2016
Milano, 24/03/2018 G.Alimonti 42ENERGIA TERMICA - IL PARADOSSO LEGNA VS FOSSILI:
GLOBALE VS LOCALE
CLIMA DOMANI VS SALUTE OGGI
CERCARE IL PUNTO DI EQUILIBRIO, OTTIMIZZARE LE TECNOLOGIE
CO2 (kg/GJ) FATTORI DI EMISSIONE PM10 (g/GJ)
74 76 860
80 900
70
65 800
56 700
60
600 480
50
500 380 380
40
400
30
300
20 200 76
10 0 0 0 0 0 100 0,2 5 0,2 18
0 0
Prof. Giuseppe Sgorbati
ARPA Lombardia
Fonti: INEMAR - ARPA Lombardia(2015), INEMAR, Inventario Emissioni in Atmosfera: emissioni in Regione Lombardia nell'anno 2012 – dati finali. ARPA Lombardia Settore Monitoraggi Ambientali,
Coefficienti utilizzati per l’inventario delle emissioni di CO2 nell’inventario nazionale UNFCCC (media dei valori degli anni 2011-2013.Impatti sanitari inquinamento
Premature annual deaths from household
air pollution and selected diseases.
Sorce: WHO
IEA (Internationa Energy Agency): “1.3 billion people in the world live
without electricity and 2.7 billion live wothout clean cooking facilities”
L’accesso all’elettricità è ritenuto una condizione indispensabile per lo sviluppo umano.
Gli investimenti aggiuntivi per estendere l’accesso a tutti gli abitanti del pianeta
ammontano a circa 35 miliardi di dollari all’anno e sono quindi marginali nel piano di
sviluppo complessivo.
Milano, 24/03/2018 G.Alimonti 44FV Italia
Fonte: SER 2014
Il costo complessivo, stimato dal Governo,
per le opere giudicate indispensabili alla Source: europe-solar.de
difesa dal rischio idrogeologico, in tutto il
Paese, ammonta a meno di 30 miliardi di
euro, quando gli incentivi per le FER in Italia
costano 200 miliardi con effetti minimi sulla
riduzione di CO2 (140 miliardi per il solo FV).
Milano, 24/03/2018Proposte per la riduzione delle emissioni di CO2?... "The climate mitigation gap: education and government recommendations miss the most effective individual actions” Wynes et al Environmental Research Letters, 12/7/2017 We recommend four widely applicable high-impact (i.e. low emissions) actions with the potential to contribute to systemic change and substantially reduce annual personal emissions: having one fewer child (an average for developed countries of 58.6 tonnes CO2-equivalent (tCO2e) emission reductions per year), living car-free (2.4 tCO2e saved per year), avoiding airplane travel (1.6 tCO2e saved per roundtrip transatlantic flight) and eating a plant-based diet (0.8 tCO2e saved per year). Avere meno figli, evitare auto e aereo, mangiare vegetariano. Sono queste, nell'ordine, le azioni individuali più efficaci per ridurre le emissioni di gas serra e, dunque, contribuire a rallentare il disastro climatico in atto. http://www.qualenergia.it/articoli/20170712-global-warming-le-4-azioni-individuali-piu- efficaci-rallentarlo- Milano, 24/03/2018 G.Alimonti 46
Conclusioni

 Una percentuale significativa, attorno al 50%, del riscaldamento del XX secolo
    sembra derivare principalmente da processi naturali. Se la temperatura
continuasse a salire come si e’ osservato dalla seconda meta’ del XX secolo ad
oggi, molto probabilmente entro la fine di questo secolo rispetteremmo l’accordo
                      di Parigi anche in uno scenario BAU.

Le statistiche non mostrano aumenti di intensita' o frequenza degli eventi estremi.

Altre motivazioni sostengono lo sviluppo e la diffusione di tecnologie low carbon,
in particolar modo per l’Europa (povera di risorse energetiche):

• sostenibilita’
• sicurezza degli approvvigionamenti
• competitivita’

Milano, 24/03/2018                   G.Alimonti                                47
La salute e l’ambiente risultano essere messi a rischio piu’ dalle
emissioni inquinanti che non da quelle di CO2
Necessari investimenti mirati su R&S e diffusione di tecnologie adatte a
raggiungere tali obbiettivi, con le corrette tempistiche ed azioni equilibrate.
Milano, 24/03/2018 G.Alimonti 48Grazie per l’attenzione
Gianluca.Alimonti@mi.infn.it
Milano, 24/03/2018 G.Alimonti 49Puoi anche leggere