LA CORRELAZIONE E INQUINAMENTO TRA COVID-19 - Re.Public ...
←
→
Trascrizione del contenuto della pagina
Se il tuo browser non visualizza correttamente la pagina, ti preghiamo di leggere il contenuto della pagina quaggiù
ambiente&territorio Paola Villani(1)
LA CORRELAZIONE
TRA COVID-19
E INQUINAMENTO
MOLTI SI SONO IMMEDIATAMENTE PRECIPITATI A DIVULGARE NOTIZIE CIRCA LA SICURA
CORRELAZIONE TRA INQUINAMENTO DA EMISSIONI VEICOLARI E CORONAVIRUS:
UN’ANALISI DETTAGLIATA SU SCALA MONDIALE MOSTRA UNA REALTÀ DIFFERENTE
D
all’inizio di quella che è stata definita una pandemia i dati
puntuali sulla pericolosità del Coronavirus hanno spinto i CORRELATION BETWEEN
Governi a imporre limiti alle normali attività.
L’analisi che si presenta è iniziata ai primi di Gennaio osservando
TRAFFIC VEHICLE
i dati cinesi: non vi era una correlazione tra popolazione inse- POLLUTION AND COVID-19
diata e affezione da Coronavirus ma i numeri, a Gennaio 2020,
erano riferiti alla sola Cina. E se alcuni dubitavano della veridicità MANY PEOPLE HAVE DISCLOSED NEWS ABOUT
degli stessi, come prassi in ogni ricerca era opportuno cartogra- THE SAFE CERTAIN CORRELATION BETWEEN
farli soppesando tutte le informazioni. TRAFFIC-VEHICLE POLLUTION AND COVID-19:
Da subito è stato piuttosto evidente che a fronte di un contagio A DETAILED ANALYSIS ON A GLOBAL SCALE
elevatissimo la mortalità era riferibile soltanto alla popolazione SHOWS A DIFFERENT REALITY
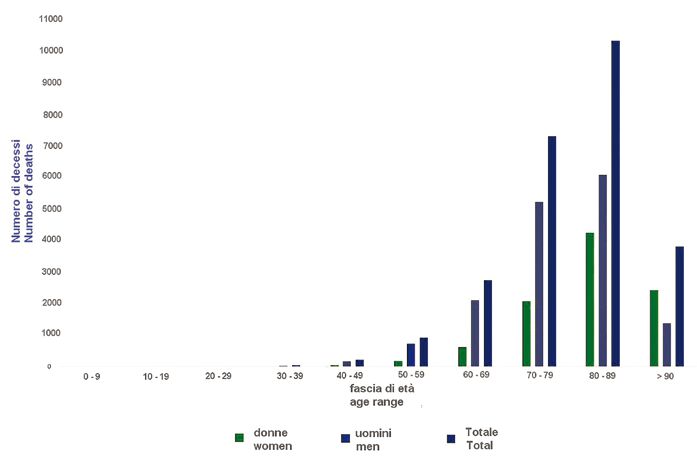
anziana e presentava un singolare sbilanciamento sul genere
maschile (Figura 1).
S
Singolare specie sapendo che in tutti i grafici sulle classi di età ince the beginning of what has been called a coronavi-
(Figura 2) le donne sono (qui in Italia) più dei maschi: i medici si rus pandemic the infection-fatality-ratio and deaths data
sono interrogati sul perché il gentil sesso rispondesse meglio al pushed the Governments to impose restrictions on normal
Coronavirus e noi tutti ci siamo interrogati sul cursus studiorum activities. The following analysis started in early January. At that
che gli addetti alla Protezione Civile hanno. time, one could only analyze Chinese data: there was no cor-
Se una malattia non di genere colpisce una parte della popola- relation between population and coronavirus disease but the
zione, il genere più rappresentato dovrebbe necessariamente numbers, in January 2020, referred only to China.
essere il più colpito. Per il Coronavirus non è così. Ma già questo And if some doubted about the veracity of either source, as a
è un indizio. practice in any scientific research, it was appropriate to map all
I medici si preoccupano dei contagi, dei posti letto per le tera- the data after weighing up all the relevant information.
pie intensive mentre chi si occupa da sempre di decessi indaga In the face of a very large contagion, mortality rates affected on-
immediatamente sulle cause e i luoghi. Deformazione profes- ly the elders and the male population (Figure 1). Extraordinary
sionale tipica di chi analizza da decenni gli incidenti stradali… case, since statistics proves that women are much more numer-
ed è iniziata così la ricerca sui punti neri dell’infezione da Co- ous than men (Figure 2): the doctors questioned themselves on
ronavirus. Wuhan. why women were responding better to the treatments and we all
Esiste una nota immagine della città cinese epicentro della pan- questioned ourselves on the cursus studiorum picked by the civil
demia, un’immagine che risale al 1930 (Figura 3). protection workers.
2 STRADE & AUTOSTRADE 3-2020 www.stradeeautostrade.it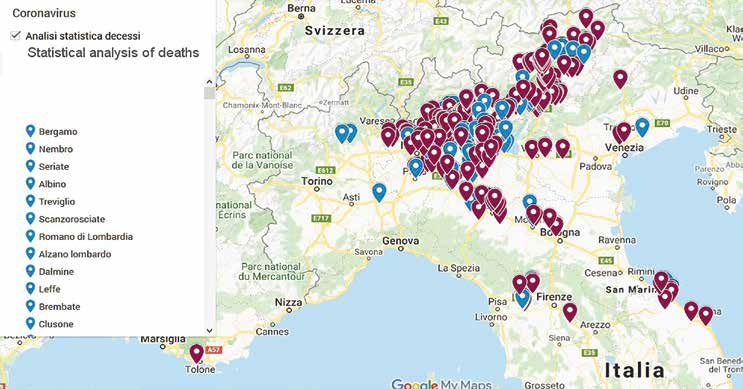
INQUINAMENTO ATMOSFERICO
If a non-gendered disease affects a part of
the population, the most represented gender
should necessarily be the most affected. For
coronavirus it does not occur. But this is
already a clue.
Doctors worry about the infections, about the
number of beds in intensive care, but instead
of focusing on the numbers of people affect-
ed, it’s much more useful and interesting to
research causes and locations…
It’s an occupational hazard typical of those
who analyze road accidents: and it so began
the research on the black spot areas of coro-
navirus infection.
As one searches for black spots in road acci-
dent analysis, in this case it was necessary to
observe the regions with the largest number
of infected and deceased. Wuhan (Figure 3).
1. Il grafico delle classi di età e decessi per COVID-19 Who is looking for the map of COVID-19
1. Age classes and deaths for COVID-19 in Italy on May 2, 2020
Chi ricerca la mappa dei punti neri sul tema Co-
vid-19 considera l’elevata industrializzazione mentre
legge di fantomatici contagi da pipistrelli. Se una
malattia così contagiosa determina morti in una
città delle dimensioni di Wuhan (11 milioni di abi-
tanti) però i decessi sono soltanto lo 0,04% della
popolazione il virus è contagioso sì, ma a tutta evi-
denza risulta mortale soltanto per alcune categorie
di persone.
L’altro focolaio cinese di Coronavirus viene dichia-
rato essere ad Harbin 1 ove, al di là dei dati di con-
tagio e mortalità, si divulgano precisamente i dati 3. Wuhan nell’anno 1930: Hankou era l’area più popolosa delle tre città che
relativi alle scorte alimentari. Le statistiche ufficia- oggi - unitesi - sono denominate Wuhan, città industriale già 90 anni fa
li comunque indicheranno casi sempre inferiori a 3. Wuhan year 1930: Hankou was the most densely-populated area of the three
quelli registrati nella provincia di Hubei (Wuhan). city that are now collectively called Wuhan
black spots considers the high industrialization of Wuhan
while reading about phantom bat viruses.
If such a contagious disease causes death in an area as
large as Wuhan’s (11 million population) but the mortality
rate is just 0,04%, this virus is infectious, but it’s lethal
only for some categories of people. The other Chinese
coronavirus outbreak is in Harbin (1) where, beyond the
contagion and mortality data, information relating to
food stocks are disclosed.
Official statistics anyway will always indicate fewer cases
than those recorded in the Hubei province (Wuhan). The
coronavirus infections arrives in Italy and mapping the
data the first correspondences arise.
1
Harbin è tristemente nota per essere stata sede del complesso
denominato 731 Unit ove per molto tempo i giapponesi hanno
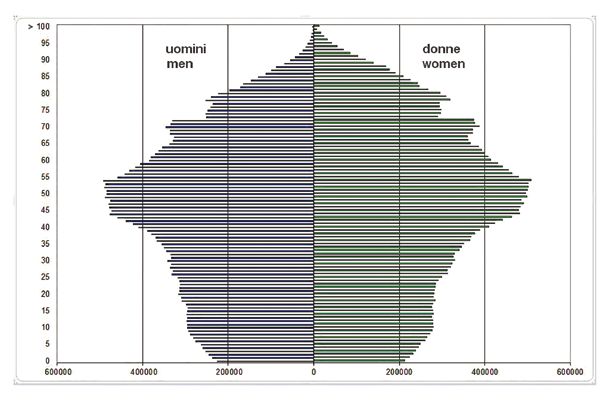
2. Il grafico della popolazione italiana ripartita per classi di età a Gennaio condotto efferati esperimenti batteriologici sulla popolazione cinese.
2019: in blu i maschi, in colore verde le femmine Harbin is sadly known for having been the site of the complex called
2. Italian population by age classes in January 2019: males in blue and 731 Unit where for a long time the Japanese conducted brutal
females in green color bacteriological experiments on the Chinese population.
www.stradeeautostrade.it 3-2020 STRADE & AUTOSTRADE 3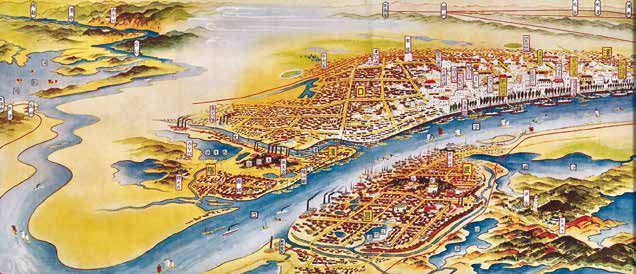
ambiente
&territorio
L’epidemia arriva in Italia e cartogra-
fando i dati emergono le prime corri-
spondenze. Mentre tutti si affannano a
trovare una relazione precisa tra inqui-
namento veicolare e Covid-19 chi ana-
lizza i dati puntualmente considera che
non è possibile una corrispondenza tra
questi due fattori sapendo che i de-
cessi si verificano quasi esclusivamente
tra la popolazione anziana (Figura 4).
Se si trattasse di correlazione Co-
ronavirus ed emissioni da traffico la
popolazione residente in città (sia
maschile che femminile) sarebbe stata
sterminata. I Milanesi già apprezzano
quando possono respirare nei giardini
pubblici… e il gentil sesso si sposta
spesso a piedi inalando giocoforza
assai più inquinanti. No, la correla-
zione Coronavirus e decessi è altrove.
Nell’aria (forse).
Se fossero state le emissioni dei vei-
coli a motore i ciclisti urbani sareb-
bero morti già a Gennaio, Febbraio
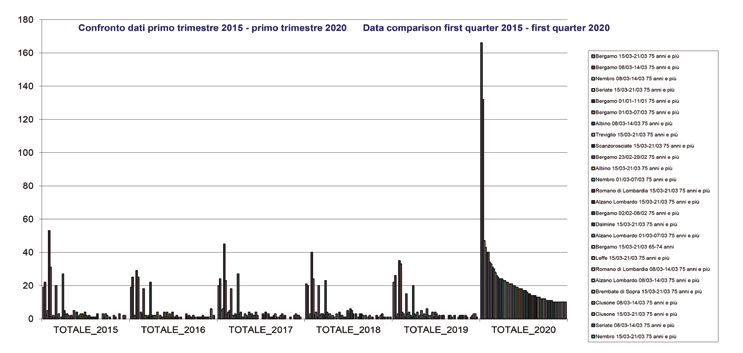
5A e 5B. I decessi di persone aventi più di 65 anni nella provincia di Bergamo: il confronto
2020. Insieme a tassisti e vigili urbani.
tra quelli registrati negli ultimi cinque anni e quelli verificatisi in questo primo trimestre 2020
Gli studi sottolineano alcuni aspetti caratterizzato da COVID-19
specifici e l’indagine prende avvio. 5A e 5B. Mortality data of people over 65 years old in the province of Bergamo: the comparison
Tutti si interrogano su fattori di den- between the deaths recorded in the last five years and those resulting in this first quarter 2020
sità, presenza di traffico ma nessuno characterized by COVID-19
che scenda nei dettagli.
Occorre cartografare ogni singolo dato per venire a capo di While everyone is scrambling to find a relationship between
quello che determina scelte opinabili da parte delle istituzio- traffic vehicle pollution and COVID-19 those who analyzes the
ni: sono state bloccate tutte le attività per un’epidemia che è data in a scientific way considers that a correspondence is not
possible between these two factors knowing that deaths
occur almost exclusively ( in Italy) only elders
DECEDUTI CON (Figure 4).
CORONAVIRUS / POPOLAZIONE TOTALE / If there was a correlation between
FASCIA
DECEASED WITH TOTAL POPULATION COVID-19 and traffic vehicle pollution, those
DI ETÀ /
CORONAVIRUS who live in the city (males and females) area
AGE
would have been killed off. Citizens of Milan
RANGE MASCHI / FEMMINE / MASCHI / FEMMINE /
already appre-ciate when they can breathe in
MALES FEMALES MALES FEMALES
public gardens… and women often move on
0-9 1 1 2.617.094 2.473.388 foot inhaling much more polluting forces. No,
10-19 0 0 2.980.600 2.788.274 the coronavirus cor-relation and deaths is
elsewhere, into the air (maybe).
20-29 5 2 3.212.204 2.989.066
If motor vehicle emissions were the cause, urban
30-39 30 18 3.559.151 3.515.067 cyclists would have died already in January or
40-49 154 49 4.593.789 4.648.865 February 2020. Together with taxi drivers and
50-59 681 180 4.578.610 4.773.621 municipal police.
The studies highlight some specific aspects and
60-69 1.997 579 3.511.037 3.826.173
the investigation begins. Everyone wonders
70-79 4.958 1924 2.727.000 3.235.533 about population density factors, high volumes
80-89 5.650 3746 1.395.953 2.159.593 of traffic, but no one who goes into detail. It
> 90 1.212 2001 209.328 565.200
is necessary the totality of data to understand
why institutions decided for a questionable lock-
4. I decessi per COVID-19 in Italia per classi d’età e genere (dati al 24 Aprile 2020) down: all activities have been blocked due to an
4. COVID-19 deaths in Italy by age group and gender (April 24, 2020) epidemic that is contagious for all but fatal only
4 STRADE & AUTOSTRADE 3-2020 www.stradeeautostrade.it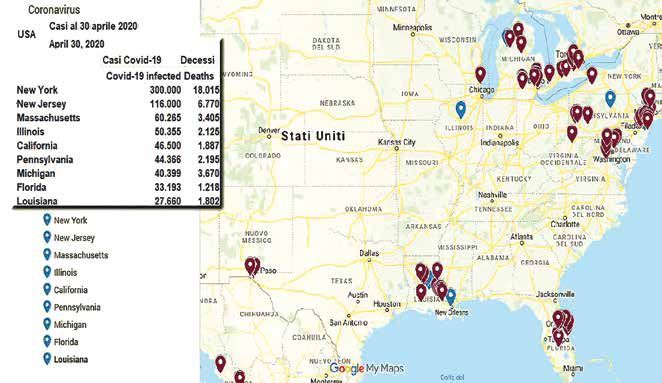
INQUINAMENTO ATMOSFERICO
for the elderly population, a choice that led to
the collapse of the economy.
The analysis highlights statistical anomalies in
certain areas of the territory (Figures 5A e 5B).
Regarding the italian situation, the analysis
shows statistic anomalies is specific areas:
the number of deaths is more consistent in
some counties than in the metropolitan area.
Data referring to deaths in the first quarter
of all years between 2015 and 2020 show the
tragedy caused by the coronavirus in Berga-
mo area. The analysis of deaths by individual
age group shows very different data for Milan
(Figure 6).
Does it makes it possible to exclude to gener-
ic air quality from the causes of COVID-19?
Partially, yes.
The analysis therefore continued considering
6. I decessi di persone per classi di età nella città di Milano: i confronti non evidenziano
the mortality data for all the Municipalities
un aumento della mortalità in questo primo trimestre 2020 caratterizzato da COVID-19
of the Province of Bergamo, comparing the
6. Mortality data of people by age in the city of Milan: the comparison do not show an
increase in mortality in this first quarter of 2020 characterized by COVID-19 deaths recorded in the past five years and
those recorded in this first three months of
the COVID-19 spread. And the response was
sì contagiosa ma determina decessi nella sola popolazione immediate. Some municipalities have statistical anomalies and
anziana, scelta che ha portato al tracollo dell’economia. L’a- therefore the data have been precisely mapped. The number of
nalisi evidenzia anomalie statistiche in determinati punti del deaths in Bergamo’s county shows that the traffic vehicle pollution
territorio. Giustamente a Bergamo hanno dichiarato di essere is not correlated to the disease. If it was, the mortality would have
in piena emergenza: i dati (Figure 5A e 5B) riferiti ai decessi nel been distributed among age classes.
primo trimestre di tutti gli anni tra il 2015 e il 2020 mostrano la The concentrations in air of PM10, ozone and nitrogen dioxide
tragedia determinata dal Coronavirus in questa zona. are not linked in a simple way to the emission sources, but are
L’analisi dei decessi per singola classe di età mostra dati molto mediated by a series of chemical and physical processes. Among
diversi per Milano (Figura 6). other things, their formation occurs simultaneously with the pro-
Questo consente già di escludere la generica qualità dell’a- cesses of transport and dispersion into the atmosphere, so the
ria? In parte sì. L’analisi quindi è proseguita considerando i affected area is much more extensive than for example carbon
dati di mortalità per tutti i Comuni della Provincia di Berga- monoxide pollution (see “Strade & Autostrade” n. 115 January/
mo, confrontando i decessi registrati negli ultimi cinque anni e February 2016, page 162).
quelli determinatisi in questo primo trimestre caratterizzato da However, public rulers did not consider whether there was a se-
contagio. E il riscontro è sta- cure correlation between contagion and
to immediato. Alcuni Comuni air quality: they almost took it for granted
presentano anomalie statisti- and blocked everything.
che e quindi i dati sono stati But vehicular traffic isn’t the main source
puntualmente cartografati. Le of emissions for every pollutants, but only
emissioni da traffico non han- some of them.
no avuto un ruolo in questa In the case of sulfur oxides (SOx), precur-
strage. E se l’avessero avuto sors of secondary PM10, the most relevant
i dati avrebbero mostrato una emission sectors are those of industry and
mortalità ripartita su tutte le energy (and this explains the very high val-
classi di età. Le concentrazioni ues of PM10 in some provinces of Lom-
in aria di PM10, ozono e bios- bardy (Figure 7).
sido di azoto non sono legate On the one hand, it is therefore obvious
in maniera semplice alle fonti how the public decision-maker had to
di emissione, ma sono me- establish in advance: which could be the
diate da una serie di processi pollutants whose emissions needed to be
chimici e fisici. Tra l’altro, la drastically reduced in a period of the res-
loro formazione avviene con- piratory disease (SARS-CoV-2) and where
temporaneamente ai processi 7. L’emissione di sostanze acidificanti SOx, NOx, NH3 (analyzing the data of the deceased rath-
di trasporto e dispersione in 7. The emission of acidifying substances SOx, NOx, NH3 er than the outright infected) this move
www.stradeeautostrade.it 3-2020 STRADE & AUTOSTRADE 5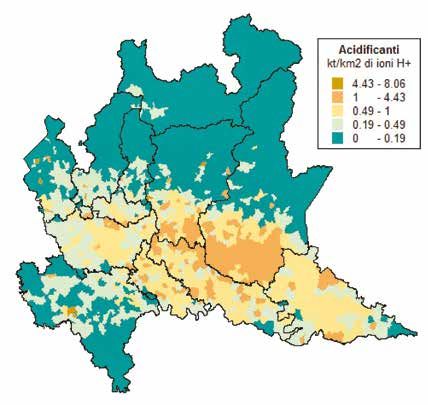
ambiente
       &territorio

atmosfera, per cui l’area interessata è molto più estesa rispet-
to per esempio all’inquinamento da monossido di carbonio (si
veda “Strade & Autostrade” n° 115 Gennaio/Febbraio 2016 a
pag. 162).
Il decisore pubblico però non ha considerato se ci fosse una
relazione sicura tra contagio e qualità dell’aria: l’ha quasi dato
per scontato e ha bloccato tutto. Ma il traffico veicolare che
per alcuni inquinanti è la principale fonte di emissione non lo
è per tutte. Nel caso degli ossidi di zolfo (SOx), precursori del
PM10 secondario, i settori di emissione più rilevanti sono quelli
dell’industria e dell’energia (e questo spiega gli elevatissimi
valori di PM10 in alcune province (Figura 7).
Da una lato è quindi ovvio come il decisore pubblico dovesse          8. Fortunatamente l’industria siderurgica ha modificato, già dal 1990-
preventivamente stabilire: quali potessero essere gli inquinanti      1995, i processi produttivi e in Italia le emissioni di ossidi di zolfo si
                                                                      sono drasticamente ridotte
le cui emissioni dovevano essere drasticamente ridotte in una
fase di contagio da Coronavirus e dove (analizzando i dati dei        8. Fortunately, between 1990 and 1995 the steel industry has been
                                                                      required to change its production processes and the Sulphur dioxide
deceduti più che dei contagiati tout court), dall’altro lato è        emissions (in Italy) have drastically reduced
del tutto evidente che il come e il quanto (bloccare tutto pri-
ma dichiarando la chiusura temporanea ed ora prorogando la
stessa) senza aver chiaro né la causa che porta un contagiato         needed to be made, on the other side it is quite clear that de-
da Coronavirus al decesso o alla terapia intensiva né la tipiz-       claring a lockdown first deciding for a temporary closure and now
zazione dei casi non è stata una mossa azzeccata, specie se si        extending it hasn’t been a smart move - especially if we consider
considerano le ricadute economiche. Poi si dirà che è stato per       its effect on economy - since it’s not clear yet which are the rea-
il bene pubblico ma forse questa analisi andava fatta prima.          sons why a particular case of COVID-19 needs hospitalization in
Prima del lockdown.                                                   intensive care, or dies, or can fall under a type. Then it will be said
L’analisi dei dati statistici permetteva di escludere alcune ipo-     that it was for public well-being but perhaps this analysis should
tesi formulate da vari studiosi: la correlazione inquinamento         have been made before. Before the lockdown.
veicolare e decessi in primis. Secondariamente la rappresen-          The analysis of statistical data made it possible to exclude some
tazione cartografica puntuale e relativa a tutti i dati reperibili    hypotheses made by various scientists: firstly the correlation be-
(numero di decessi per singolo Comune) ed età dei soggetti            tween vehicle traffic pollution and deaths.
deceduti indirizzava verso la seguente ipotesi: tutte le aree con     Secondly accurate cartographic representation regarding all avail-
elevata mortalità da Covid-19 si caratterizzano per essere luo-       able data (number of deaths per single municipality) and age of
ghi di produzione siderurgica ma nella Provincia di Bergamo i         the deceased subjects addressed the following hypothesis: all
morti sono quasi esclusivamente anziani. Quindi il contagio da        areas with high mortality since COVID-19 are characterized by be-
Coronavirus diventa mortale se negli anni precedenti si sono          ing places of localities of steel industry production but the deaths
inalate significative quantità di ossidi di zolfo. Per questo nei     in Bergamo’s county are almost exclusively elders.
giovani e negli adulti che non siano affetti da altre patologie il    Consequently, the coronavirus contagion is lethal only if one has
Coronavirus non porta al decesso.                                     inhaled Sulphur dioxide in previous decades. For this reason,
Fortunatamente l’industria siderurgica ha modificato già dal          coronavirus does not lead young people and adults who are not
1990-1995 i processi produttivi e le emissioni di ossidi di zolfo,    affected by other diseases to death.
in Italia) si sono drasticamente ridotte (Figura 8).                  Fortunately, between 1990 and 1995 the steel industry has been
Però questo non è avvenuto in altri Paesi del mondo e questo          required to change its production processes and the Sulphur di-
spiega perché la mortalità in altri Stati sia riferibile a tutte le   oxide emissions (in Italy) have drastically reduced (Figure 8), but
classi di età. Questa ipotesi di stretta correlazione tra Covid-19    this has not happened in other countries of the world and this
e necessari ricoveri in terapia intensiva è stata comprovata dai      explains why mortality in other states refers to all age groups.
dati irlandesi che mostrano una precisa corrispondenza tra            This hypothesis of close correlation between COVID-19 and nec-
contee con numerosi casi e presenza di impianti siderurgici.          essary hospitalizations in critical care has been verified by Irish da-
Ma anche il trasporto marittimo rappresenta una fonte di emis-        ta, which show a precise correspondence between counties with
sioni: gli ossidi di zolfo (SOx) sono noti per essere dannosi         numerous cases and the presence of steel industry. But maritime
per la salute umana, causano sintomi respiratori e malattie           transport also represents a source of emissions: Sulphur dioxides
polmonari e la correlazione dei dati epidemiologici da Co-            (SOx) are known to be harmful to human health, cause respira-
vid-19 e distribuzione geografica induce a ritenere che inalare       tory symptoms and lung diseases and the correlation between
SOx in presenza di Coronavirus determini la necessità di cure         COVID-19 epidemiological data and geographical distribution
ospedaliere urgenti. Altri recenti studi hanno cercato di porre       proves that inhaling SOx in the presence of coronavirus causes
in correlazione le emissioni da allevamenti bovini e casi di Co-      the necessity of an urgent hospital treatment.
vid-19 ma comparando i dati non vi sono corrispondenze sul            Other recent studies have tried to correlate industrial breeding
fatto che l’esposizione a lungo termine alle generiche emissioni      emissions and COVID-19 cases, but comparing the data there

  6    STRADE & AUTOSTRADE 3-2020                                                                                 www.stradeeautostrade.it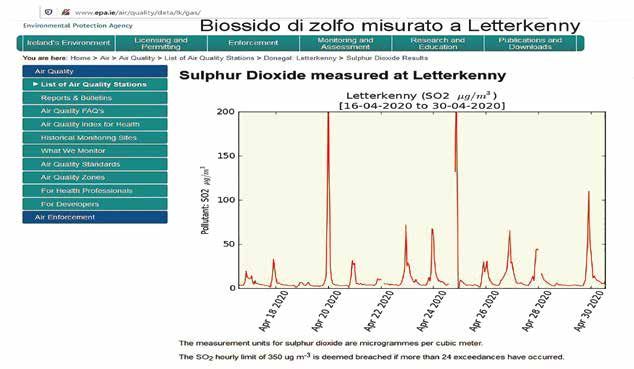
INQUINAMENTO ATMOSFERICO

                                                                                                      is no correspondence on the fact that long-term
                                                                                                      exposure to generic polluting emissions of par-
                                                                                                      ticulate matter 2.5 causes an increase in the coro-
                                                                                                      navirus mortality rate: Irish data confirm it. But
                                                                                                      above all it is confirmed by the fact that there are
                                                                                                      no industrial breeding (neither bovine nor swine)
                                                                                                      in Wuhan proximity.
                                                                                                      The analysis of the COVID-19 infected and
                                                                                                      deceased in the USA (Figure 9) confirms the
                                                                                                      above-mentioned hypotheses: once infected, the
                                                                                                      hospitalization is necessary for people
                                                                                                      That have worked in the metallurgical sector or
                                                                                                      are residents in locations where there are steel
                                                                                                      industries or power station;
                                                                                                      That have inhaled Sulphur dioxide, because they
                                                                                                      live near harbours (especially areas characterized
9. L’analisi dei contagiati e deceduti per Covid-19 negli USA: le                                     by reduced ventilation such as Donegal (2) in Ire-
località con impianti siderurgici o centrali coincidono con quelle ove                                land or in the Hudson riverbanks area).
si registrano i casi di decessi per Covid-19
                                                                                     Sulfur dioxide is naturally emitted by volcanoes and this explains
9. The analysis of the infected and deceased for Covid-19 in the USA:                both the Covid-19 deaths in Mexico (Popocatépetl in October
locations with steel plants or power plants coincide with those where
COVID-19 deaths are recorded                                                         2019 and January 2020 erupted multiple times) and explains well
                                                                                     the numerous deaths in some places south of Etna in Sicily.  n

inquinanti di PM2.5 determini un aumento del tasso di mortalità            (1)
                                                                               Department of Civil and Environmental Engineering at
per affezione da Coronavirus: proprio i dati relativi all’Irlanda lo       Politecnico di Milano
confermano. Ma soprattutto se ne trova conferma
per il fatto che non vi sono allevamenti intensivi (di
bovini o maiali) in prossimità di Wuhan.
L’analisi dei contagiati e deceduti per Covid-19 negli
USA (Figura 9) conferma le ipotesi sino a qui espres-
se: sia chi ha lavorato nel settore metallurgico oppu-
re risiede in località ove vi siano impianti siderurgici,
sia chi per motivi diversi ha inalato ossidi di zolfo
magari per il semplice fatto di risiedere in prossimi-
tà di porti, specie se in aree a ridotta ventilazione
come quello di Donegal 2 in Irlanda oppure lungo
le coste lungo l’Hudson, qualora contragga il virus
si ammala e necessita di ricovero urgente.
L’anidride solforosa è naturalmente emessa dai
vulcani e questo spiega i decessi per Covid-19 in
alcune località del Messico e analogamente spie-
ga bene i numerosi decessi in alcune località a Sud
dell’Etna.                                                   10. Anidride solforosa misurata a Letterkenny: unità di misura SO2 microgrammi per metro cubo
                                                             10. Sulphur Dioxide measured at Letterkenny : The measurement units SO are μg per cubic meter
                                                                                                                                              2

 Dipartimento di Ingegneria Civile e Ambientale
(1)

del Politecnico di Milano

                                                                                       Bibliografia / Bibliography
2
  Si osservino i dati relativi a Donegal - Letterkenny in Irlanda: http://www.epa.     [1]. World Health Organization - “Air Quality Guidelines for Europe”,
ie/air/quality/data/lk/gas/ sulphur dioxide Donegal Letterkenny, http://www.                WHO Regional Publications, European Series, No. 91, Copenha-
donegalcoco.ie/services/environment/pollutioncontrol/air%20pollution/, https://
                                                                                            gen, 2000.
www.epa.ie/pubs/reports/air/quality/epaairqualityreport2018.html e https://www.
                                                                                       [2]. M.D. Lebowitz, G.A. Fairchildb - “The effects of sulfur dioxide and
epa.ie/pubs/reports/air/quality/.
                                                                                            A2 influenza virus on pneumonia and weight reduction in mice: an
Note the data for Donegal - Letterkenny in Ireland: http://www.epa.ie/air/quality/
                                                                                            analysis of stimulus-response relationships”, in Chemico-Biological
data/lk/gas/ sulphur dioxide Donegal Letterkenny, http://www.donegalcoco.ie/
services/environment/pollutioncontrol/air%20pollution/, https://www.epa.ie/pubs/
                                                                                            Interactions, volume 7, Issue 5, November 1973, pages 317-326,
reports/air/quality/epaairqualityreport2018.html and https://www.epa.ie/pubs/               https://doi.org/10.1016/0009-2797(73)90006-9.
reports/air/quality/.

www.stradeeautostrade.it                                                                                           3-2020 STRADE & AUTOSTRADE               7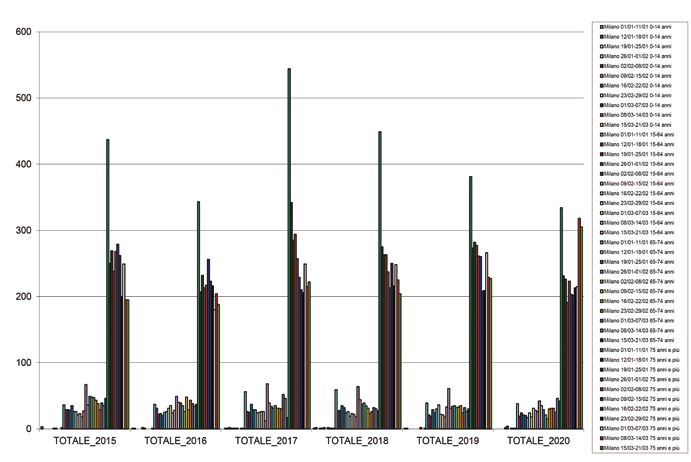
Puoi anche leggere