L'Inflazione morde il credito europeo - Ismael Lecanu Head of Credit Investment Grade AXA IM - AXA IM Italia
←
→
Trascrizione del contenuto della pagina
Se il tuo browser non visualizza correttamente la pagina, ti preghiamo di leggere il contenuto della pagina quaggiù
Ad uso esclusivo di investitori professionali.

L’Inflazione morde il
credito europeo
Ismael Lecanu
Head of Credit Investment Grade AXA IM
1° luglio 2021
AXA WF Euro Credit Total Return
Outperformance against Morningstar category EAA Fund EUR flexible Bond

                                                                                                                                                                              AWF Euro Credit
                                                                                                                                                                                                   Average Morningstar
                                                                                                                                                                  Net Perf.   Total Return I Cap
                                                                                                                                                                                                        Category
                                                                                                                                                                                     EUR

                                                                                                                                                                    YTD              1,36%              0,38%
                                                                                                                                                +29,81%
                                                                                                                                                                   2020              7,72%              1,68%

                                                                                                                                                                   2019              11,26%             5,15%

                                                                                                                                                                   2018              -3,72%             -3,09%

                                                                                                                                                                   2017              4,70%              2,24%

                                                                                                                                                                   2016              9,13%              3,44%

                                                                                                                                                                    SL               30,17%             6,59%

                                                                                                                                                                  Max Gain       38,53%               12,87%
                                                                                                                                                 +6,60%

                                                                                                                                                                    Max
                                                                                                                                                                 Drawdown        -11,11%              -9,12%

                                                                                                                                                                    Max
                                                                                                                                                                 Drawdown        72 days             245 days
                                                                                                                                                                  Recovery

    Source: AXA IM, Net performance I EUR as at 31/05/2021, Morningstar. The fund was launched in February 2015. References to rankings and awards are not an indicator of future
    rankings or awards. The information contained in this document may be updated from time to time. The information contained in this document may differ from previous or future
    versions of this document. Past performance is not a reliable indicator of future performance.
1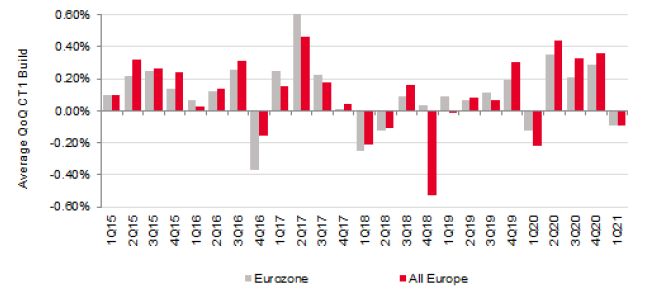
2
Reduction of risk
                  starting end of 2019

     Political
    uncertainty

3
AXA WF Euro Credit Total Return
A profile that is decorrelated over time, both in terms of the credit market and interest rates
Correlation with the Euro Credit Investment Grade market ...and with the Bund
Source : AXA IM, Bloomberg as at 31/05/2021
4What has been done?
Major CBs have reacted swiftly
• Most central banks in developed economies quickly exhausted their scope for conventional policy response. Balance sheet expansion has
been undertaken in huge scale, both to underpin smooth market functioning and ease financial conditions
• ECB flexibility and proactiveness since the beginning of the Covid-19 crisis has been a positive surprise. Via generous liquidity measures,
easier collateral requirements, increase in asset purchases programmes and creation of the PEPP, the ECB has helped to maintain smooth
credit flow to the private sector, stabilise markets and reduce fragmentation risks.
Central banks balance sheets expanding PEPP capping the spread and closing the vol
Central bank balance sheets
$bn 10y sovereign ECB actions and euro area spreads
12000 Forecast bond spreads %
Federal Reserve 4.5
"ECB not PEPP
ECB
10000 4 here to
BoJ close the PEPP Karlsruhe
3.5 legal act
8000 BoE spreads"
Merkel-
3
Macron plan
6000 2.5 PEPP
Draghi
upsize
2 government
4000
1.5
2000 1
0.5
0
Feb-20 Apr-20 Jun-20 Aug-20 Oct-20 Dec-20 Feb-21 Apr-21
Q1 2007 Q1 2010 Q1 2013 Q1 2016 Q1 2019 Q1 2022
Italy Spain Portugal Greece
Source: Datastream, FRB, ECB, BoJ, BoE, AXA IM Research, April 2021
5Banking sector
Compared to the previous crisis, the banking sector was not the problem but one of the solutions
.
• Capital build over Q2-Q4 2020 was over 100bp on average.
• Dividend ban, states support and moratoria on problematic loans have had a positive impact on capital and the asset quality
• NPLs have deteriorated, but was moderated, supported by states support and loans growth.
European Banks CET1 build up QoQ NPLs FY20 vs post GFC peak
Source: SG, June 2021
6Corporates
Euro IG monthly upgrades & downgrades (% of bonds)
Q1’2021 results: ratings risk is largely behind
• YTD net downgrades are at € 83bn (including large
issuers like Bayer, IBM, Oil companies) down from
nearly~€ 500bn in 2020.
• Average IG net debt to Ebitda ratio was down by 0.5x
to 3.3x. The drop is even more impressive in HY as
the ration nudged down from 7.1x to 5.5x
• In the first quarter, revenues and Ebitda grew by
+6.5% and +18.1% yoy
Improving leverage Most sectors reported positive sales and Ebitda growth
Source: JP Morgan, BofA Research, Bloomberg, June 2021
7Euro Credit Universe
March 2020 has been quite harsh by historical standards, is there still value?
Financial Crisis 2008/2009
320 1350
ICE BofA Euro Corporate Index (ER00, lhs)
ICE BofA Euro High Yield Index (HE00, rhs)
270 1150
First peripheral crisis 2011
220 950
Asset Swap Spread (bps)
Asset Swap Spread (bps)
Second peripheral crisis 2012 Covid crisis 2020
170 750
Commodities crisis 2015
120 550
70 350
58
270
20 150
Source : AXA IM, Bloomberg as of 23/06/2021
8Euro Credit Universe
Zooming in a world of Quantitative Easing, same conclusions?
Euro Investment Grade Market Euro High Yield Market
• The 22th January of 2015, ECB announced it will buy bonds issued by euro area central governments, agencies and European
institutions in the secondary market (€60 billion per month)
• Purchases were intended to be carried out until September (at least) 2016…we know what’s followed with the inclusion of the
Corporates bonds in March of the same year
• We are definitively in a QE world, with an implicit insurance from Central banks leading to mechanically lower risk premia.
Source: AXA IM, Bloomberg, BofAML Indices at 23 June 2021. For illustrative purpose only.
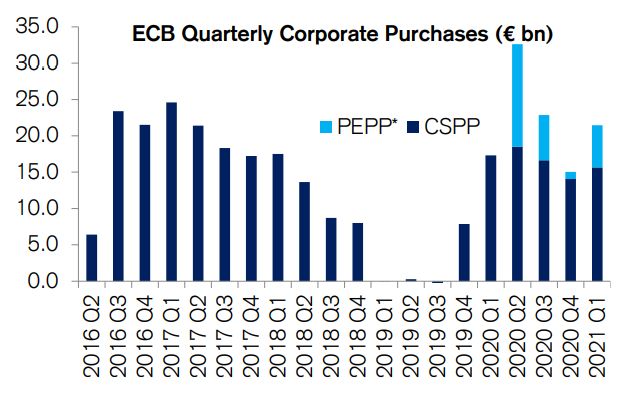
9Technicals
The support should continue in 2021 Euro IG cash-to-Ebitda in % (using 2019 Ebitda)
• The primary market was very dynamic in Q1 2021
leading to a positive net supply(ex-ECB)
• On the ECB front, the pace of purchase will remain
elevated for the rest of the year.
• Corporates are sitting on massive precautionary liquidity
cushions and do not have material financing needs.
Euro Investment-Grade issuance ECB Corporate Bond Purchases
Source: BofA Merrill Lynch, Credit Suisse, April 2021
10Inflation concerns Margin and inflationary cost pressures still top of mind for IG companies 11
What might be the impact of the “reflation trade” on the Credit Market
 So far, the market was extremely resilient , but higher real yield could eventually lead to wider spreads

• Whilst the relation between nominal yield and credit, specifically in euro looks “not simple”, higher real yields tend to lead wider spreads
• Poor $ returns has led outflows in the past for US IG, however in Euro IG the return don’t lead flows, the ALM bid remain strong, and the
  ECB is a key support.
• The taper tantrum episode suggest yield driven widening is temporary

          2013 taper tantrum was speed bump for € Credit                                      US 10yr real yield vs inflation BE %

 Source: Citigroup March 2021

 12
Technicals
How could the fund flows react to a rising rates context?
EUR Cumulative flows as % of AUM • Fund flows on the Euro IG market were very
resilient in Q1 2021 despite the rise in
Very stable so far… government bonds yields.
• Aside from the ECB, Pension Funds &
Insurances companies have been the biggest
incremental buyers of e credit in recent years.
• IG flows only respond to higher rates when
spreads widen, as was the case during the
2013 taper tantrum episode.
ALM money has dominated Investment Funds IG Cumulative flows as % of AUM
Source: Goldman Sachs, Citigroup, April 2021
13Disclaimer Il presente documento è riservato unicamente ad investitori professionali, e non può essere in alcun modo diffuso al pubblico o consegnato ad investitori che non posseggano tale qualifica. Il presente documento ha finalità informativa e i relativi contenuti non vanno intesi come ricerca in materia di investimenti o analisi su strumenti finanziari ai sensi della Direttiva MiFID II (2014/65/UE), raccomandazione, offerta o sollecitazione all’acquisto o alla vendita di strumenti finanziari o alla partecipazione a strategie commerciali da parte di AXA Investment Managers o di società ad essa affiliate. A causa del suo carattere semplificato, il presente materiale contiene informazioni parziali e le stime, le previsioni e i pareri qui espressi possono essere interpretati soggettivamente. Le informazioni fornite all’interno del presente documento non tengono conto degli obiettivi d’investimento individuali, della situazione finanziaria o di particolari bisogni del singolo utente. Qualsiasi opinione espressa nel presente Documento non è una dichiarazione di fatto e non costituisce una consulenza di investimento. Le previsioni, le proiezioni o gli obiettivi illustrati sono indicativi e non sono garantiti in alcun modo. La performance passata non è indicativa dei risultati futuri. Il valore degli investimenti e il reddito da essi derivante possono variare, sia in aumento che in diminuzione, e gli investitori potrebbero non recuperare l’importo originariamente investito. Il valore dell’investimento può variare anche per effetto delle oscillazioni dei tassi di cambio. Dati, numeri, dichiarazioni, analisi, proiezioni e altre informazioni qui contenute sono basate sullo stato delle nostre conoscenze al momento della compilazione. Nonostante sia stata usata la massima attenzione nella compilazione del presente documento, non si rilascia alcuna dichiarazione o garanzia esplicita o implicita riguardo all’accuratezza, all’attendibilità presente e futura o alla completezza delle informazioni qui contenute. A causa di questi fattori e della commissione iniziale normalmente applicata, l’investimento non ha un orizzonte temporale breve e potrebbe non risultare adeguato per ogni utente. AXA Investment Managers si riserva il diritto di aggiornare o rivedere il documento senza preavviso e declina ogni responsabilità riguardo ad eventuali decisioni prese sulla base del documento medesimo. L’investimento in qualsiasi fondo gestito o promosso da AXA Investment Managers o dalle società ad essa affiliate è accettato soltanto se proveniente da investitori che siano in possesso dei requisiti richiesti ai sensi del prospetto informativo in vigore e della relativa documentazione di offerta. Qualsiasi riproduzione, totale o parziale, delle informazioni contenute nel presente documento è vietata. Riferimenti a terze parti sono da considerarsi esclusivamente forniti a scopo illustrativo. Prima dell’adesione, si raccomanda agli investitori di leggere il Prospetto e il Documento contenente le informazioni chiave per gli investitori (KIID) o la documentazione del piano, disponibili sul sito www.axa-im.it, dove potranno trovare tutti i dettagli sui prodotti, ivi inclusi i rischi e i costi dell’investimento. A cura di di AXA Investment Managers SA, società di diritto francese con sede legale presso Tour Majunga, 6 place de la Pyramide, 92800 Puteaux, iscritta al Registro delle imprese di Nanterre con numero 393 051 826. In altre giurisdizioni, il documento è pubblicato dalle società affiliate di AXA Investment Managers SA nei rispettivi paesi. I fondi menzionati fanno capo ad AXA WORLD FUNDS, SICAV di diritto lussemburghese UCITS IV approvata dalla CSSF, iscritta al "Registre de Commerce et des Sociétés" con numero B. 63.116, avente sede legale al 49, avenue J.F Kennedy L-1885 Lussemburgo. La Società è gestita da AXA Funds Management, société anonyme di diritto lussemburghese iscritta al Registro delle imprese lussemburghese con numero B 32 223RC e ha sede legale al 49, Avenue J.F. Kennedy L-1885 Lussemburgo. © AXA Investment Managers 2021. Tutti i diritti riservati. 14
Puoi anche leggere