Gioconda - LAYMAN'S REPORT GIOCONDA. I GIOvani CONtano nelle Decisioni su Ambiente e salute
←
→
Trascrizione del contenuto della pagina
Se il tuo browser non visualizza correttamente la pagina, ti preghiamo di leggere il contenuto della pagina quaggiù
GIOCONDA. I GIOvani CONtano nelle Decisioni su Ambiente e salute

                   LAYMAN’S REPORT

                                  Gioconda
                                  i GIOVANI CONTANO NELLE DECISIONI
                                               su AMBIENTE e SALUTE
Gioconda is
                    THE IDEAS OF THE YOUNG CITIZENS
                     ON ENVIRONMENT AND HEALTH

                                             +
                         THE SCIENTIFIC MONITORING
                          OF AIR AND NOISE QUALITY

                                             =
                     A DECISION SUPPORT SYSTEM
                  BASED ON MEASURED DATA AND ON
                 THE YOUNG CITIZENS’ LIFE EXPERIENCE

GIOCONDA stands for “young citizens count in the decisions on environment and health”.
It is a LIFE+ Environment Policy and Governance (LIFE13 ENV/IT/000225) project, aimed at promoting the
institutionalized participation of young people in local decision-making in the field of environment and
health, focusing on air and noise pollution. Duration: June 2014 - November 2016

i GIOvani CONtano nelle Decisioni su Ambiente e Salute è un progetto LIFE+ Environment Policy and
Governance (LIFE13 ENV/IT/000225) focalizzato sui temi di ambiente e salute e sulla partecipazione dei
giovani cittadini. Durata: giugno 2014 - novembre 2016
Genova      Ferrara
                                             Ravenna
                                                               i GIO
                                                                     Gioconda
                                                                 GIOVANI
                                                                     VANI CO
                                                                          CONTANO
                                                                             NTANO NELLE DECISIONI
                   Calcinaia      San Miniato                                 su AMBIENTE e SALUTE
                               Montopoli

                                                                        Bitonto
                                                   Napoli

                                                                           Taranto

      Index                                               Indice
●   Introduction                         2       ●     Introduzione                     2

●   Methodology                          7       ●     Metodologia                      7

●   Results                          10          ●     Risultati                       10

●   The GIOCONDA platform                        ●     La piattaforma di GIOCONDA
    to continue the dialogue         26                per continuare il dialogo       26

●   Networking & Knowledge                       ●     La rete & il trasferimento
    Transfer and Exchange            28                e scambio delle conoscenze      28
INTRODUCTION
         Towards shared governance
GIOCONDA is a project that helps young people becoming protagonists in democratic action, building a
dialogue on environment and health between schools and local authorities.
There are several reasons for the decision to focus the project on school children. They are the most vulnerable
to environmental pressures; scientific research and prevention tools have focused on them but without
involving them directly. School children will soon play a role as decision-makers in improving the state of the
environment and health. Their perception of the environmental risks adds to our understanding of the ideas,
attitudes, fears and hopes of the whole society. By this project, young citizens who attend first and second
grade secondary schools (ages 11-17) are involved in a learning and research process where they work on
scientific evidence, examining and comparing it before producing recommendations aimed at local
administrators. In this way the GIOCONDA’s specific objective is reached: to build a governance tool capable
of supporting decisions made by local governments, and implementing the concept of scientific citizenship.
To achieve this objective, GIOCONDA has created and tested a platform where decision makers and schools
can meet, monitor the perceptions of risks and explore their own neighbourhoods using maps and local
information. GIOCONDA aims to ensure that this dialogue is based on measurable data.

                 Dialogue
                 Schools – Local                                          Governance
                 Administrations
                                                                          Evidence
                                                                          informed policies
                                               Scientific
                                               Evidence
                                               Data from public
                                               agencies

         INTRODUZIONE
         Verso una governance condivisa
GIOCONDA coinvolge i giovani come protagonisti di un’azione di democrazia partecipativa, costruendo un
dialogo fra scuole e amministrazioni locali su ambiente e salute.
La scelta di dedicare a loro il progetto si fonda su diverse ragioni: sono i soggetti più vulnerabili alle pressioni
ambientali; molte ricerche scientifiche e strumenti di prevenzione li riguardano ma non li coinvolgono; avranno
presto un ruolo come decisori, per migliorare lo stato dell’ambiente e la salute; la loro percezione dei rischi
ambientali ci fa capire meglio le idee, gli atteggiamenti, le paure e le speranze della società tutta.
Con questo progetto, i giovani cittadini (età 11-17) che frequentano le scuole secondarie di primo e secondo
grado sono coinvolti in un percorso di apprendimento e ricerca in cui elaborano evidenze scientifiche, le
esaminano e confrontano per produrre infine raccomandazioni da portare agli amministratori locali.
Si raggiunge così l’obiettivo specifico di GIOCONDA: costruire uno strumento di governance capace di
supportare le decisioni delle amministrazioni locali e realizzare il concetto di cittadinanza scientifica.
Per concretizzarlo, GIOCONDA ha costruito e testato una piattaforma dove scuole e decisori si possono
incontrare, monitorare la percezione del rischio ed esplorare la propria area attraverso mappe e informazioni
sul territorio. Il dialogo, secondo GIOCONDA, deve basarsi su dati misurati.

                                                         2
Environment and health
    GIOCONDA took the definition of health from the World Health Organisation (WHO): health is a state of
    complete physical, mental and social wellbeing and not merely the absence of disease.
    Good health and wellbeing require a clean, welcoming and harmonious environment where due importance
    is given to physical, psychological, social and aesthetic factors. The environment must be seen as a resource
    for the welfare of the people.
    Environmental degradation, together with social and economic inequalities, appear to be the factors that most
    influence people’s health. Damage due to indoor and outdoor environmental pollution has been widely
    recognized as very important.
    WHO estimates that 23% of deaths globally and 26% of mortality in children under five are caused by
    modifiable environmental factors. In Italy this translates into about 70,000 premature deaths per year (source
    WHO 2016 on 2012 data). Modifiable environmental factors are also defined as preventable. It is possible to
    take measures to limit pollution, adopt new technologies, launch information campaigns, and work to improve
    social situations and services for citizens. The WHO has worked out the benefits of these measures and has
    recommended them to governments throughout the world.

     WHY A HEALTHY ENVIRONMENT IS                                      PERCHÉ UN AMBIENTE SANO È
                                                                        IMPORTANTE PER I GIOVANI

!                                                                                                                            !
      IMPORTANT FOR YOUNG PEOPLE

    Young children and adolescents breath more air, drink          I bambini e gli adolescenti respirano più aria, bevono
    more water and eat more food per unit of body weight           più acqua e mangiano più cibo per unità di peso
    than adults. They are thus subject to greater exposure         corporeo rispetto gli adulti. La conseguenza è che sono
    to pollutants, which means that young people are               soggetti a una maggiore esposizione agli inquinanti,
    likely to more easily absorb toxic substances and              ovvero possono assorbire più facilmente sostanze
    pathogens from the environment and food.                       tossiche e agenti patogeni dall’ambiente e dai cibi.
    Because of the increased vulnerability of young                A causa della maggiore vulnerabilità dei più giovani
    people to environmental hazards, reducing the effects          ai rischi ambientali, la riduzione degli effetti
    of pollution on the health of children has become a            dell’inquinamento sulla loro salute è diventata una
    political priority at national and international levels.       priorità politica a livello nazionale e internazionale.

    Ambiente e salute
    GIOCONDA ha assunto la definizione di salute dell’Organizzazione mondiale della sanità (OMS): salute è lo
    stato di completo benessere fisico, psichico e sociale e non semplice assenza di malattia.
    Buona salute e benessere richiedono un ambiente pulito, accogliente e armonioso in cui sia data la giusta
    importanza ai fattori fisici, psicologici, sociali ed estetici. L’ambiente deve essere considerato come una risorsa
    per il benessere delle persone.
    I fenomeni di degrado ambientale, assieme alle diseguaglianze sociali ed economiche, risultano essere i fattori
    che influenzano di più la salute delle persone. I danni dovuti all’inquinamento degli ambienti interni (indoor) ed
    esterni (outdoor) sono largamente conosciuti e molto rilevanti. L’OMS stima che il 23% della mortalità a livello
    globale e il 26% della mortalità nei bambini al di sotto dei cinque anni sia provocato da fattori ambientali
    modificabili. In Italia questo si traduce in circa 70 mila morti premature l’anno (fonte OMS 2016 su dati 2012).
    I fattori ambientali modificabili sono anche definiti prevenibili: per limitare l’inquinamento si possono
    intraprendere misure concrete, adottare nuove tecnologie, lanciare campagne informative, lavorare per migliorare
    la situazione sociale e i servizi per i cittadini, con benefici che l’OMS ha calcolato e propone a tutti i governi.

                                                               3
%
Starting from the data
Facilitating a dialogue on a complex issue such as the health effects of environmental pollution requires a
rigorous approach. Dialogue, according to GIOCONDA, must be evidence based.
This is why the project team focused on two types of measurable data: firstly, results from monitoring air and
noise inside and outside the schools in the sample-areas; secondly, results from a questionnaire on risk
perception linking health to the main environmental factors likely to affect the health of young citizens.
The project was triggered by evidence drawn from the latest research, which was analyzed during the
preliminary research stage, confirming the high impact of air and noise pollution on health.
Worldwide, air pollution contributes to 6.7% of overall mortality. The WHO estimates that in Italy, in 2010,
32,447 people died due to pollution from fine particulate matter PM2.5 (PM is a class of pollutants recognized
as carcinogenic, monitored by the project). Infections of the lower respiratory tract, such as pneumonia,
bronchitis and bronchiolitis, have a greater impact on children.
As for noise, WHO estimates that about 40% of the population in the EU is exposed to road traffic noise at levels
above 55 dB (weighted decibels, noise intensity measurement) and that more than 30% are exposed to levels
exceeding 55 dB during the night. Scientific research has shown the many negative effects of noise on health.

                                     Negative effect                       Negative effect
Area of health
                                     of noise pollution                    of air pollution

Physical                             • Cardiovascular diseases             • Cardiovascular diseases
                                     • Hearing disorders                   • Respiratory diseases
                                     • Newborn anomalies                   • Asthma
                                                                           • Cancers
Psychological/Emotional              • Depression                          • Anxiety
                                     • Anxiety

Behavioural                          • Sleep disorder                      • Reduced physical activity
                                     • Malaise
                                     • Aggression and antisocial
                                       behaviour

Cognitive                            • Learning disabilities
                                     • Reduced productivity

Tab. 1: Adapted from Science for environment policy (2016). Links between noise and air pollution and
socioeconomic status: http://ec.europa.eu/science-environment-policy.

                                                       4
Partire dai dati
                                                                                                %
Facilitare il dialogo su un argomento complesso come quello degli effetti dell’inquinamento ambientale sulla
salute necessita di un approccio rigoroso. Il dialogo, secondo GIOCONDA, si deve basare sulle evidenze scientifiche.
Per questo il team di progetto si è concentrato su due tipi di dati misurati: i dati derivanti da un monitoraggio di
aria e rumore, fuori e dentro le scuole delle aree-campione; i dati raccolti con un questionario sulla percezione del
rischio che lega la salute ai maggiori fattori ambientali che possono influenzare il benessere dei giovani cittadini.
Le evidenze dalle quali è partito il progetto si basano sulle ricerche più recenti, analizzate durante la fase
preliminare, che confermano l’alto impatto sulla salute dell’inquinamento dell’aria e da rumore.
A livello mondiale, l’inquinamento dell’aria contribuisce per il 6,7% alla mortalità complessiva. L’OMS calcola
che in Italia nel 2010, 32.447 persone siano morte a causa dell’inquinamento da polveri sottili PM2,5 (PM è una
classe di inquinanti riconosciuti come cancerogeni, monitorati dal progetto). Per i bambini in particolare, sono
di maggiore impatto le infezioni delle vie respiratorie inferiori, quali polmoniti, bronchiti, bronchioliti.
Per ciò che riguarda il rumore, l’OMS stima che circa il 40% della popolazione nell’Unione europea sia esposto
al rumore del traffico stradale a livelli superiori a 55 dB (decibel ponderato, la misura dell’intensità del rumore)
e che più del 30% sia esposto a livelli superiori a 55 dB durante la notte. Le ricerche scientifiche hanno
dimostrato molti effetti negativi del rumore sulla salute.

                                       Inquinamento                           Inquinamento
Tipo di malattia
                                       da rumore                              dell’aria

Fisica                                 • Malattie cardiovascolari             • Malattie cardiovascolari
                                       • Disturbi dell’udito                  • Malattie respiratorie
                                       • Anomalie nei neonati                 • Asma
                                                                              • Tumori
Psicologica/Emozionale                 • Depressione                          • Ansia
                                       • Ansia

Comportamentale                        • Disturbi del sonno           • Minore attività fisica
                                       • Malessere
                                       • Aggressività e comportamenti
                                         antisociali

Cognitiva                              • Disturbi dell’apprendimento
                                       • Minore produttività

Tab. 1: Adattato da Science for environment policy (2016). Links between noise and air pollution and
socioeconomic status: http://ec.europa.eu/science-environment-policy.

                                                         5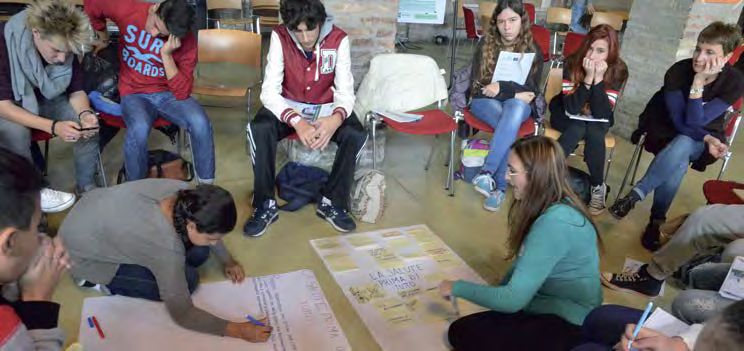
The values of GIOCONDA
GIOCONDA has adopted the values of the European commission’s Action Plan for the Environment and
aims to support its implementation.
GIOCONDA’s priority is the right to good health for the young and very young, as enshrined in the UN
Convention on the rights of children and adolescents (1989), upholding in particular:
     • their right to non-discrimination (art. 2) regardless of abilities, economic status, sex, religion
     • their best interests (art. 3): their interest should be given priority in any law, measure, public or
          private initiative, and problematic situation
     • their right to life, survival and development (art. 6): States must engage the maximum available
          resources to protect the life and healthy development of young people
     • the commitment to listen to the views of children (art. 12): they should be heard in all decisions
          affecting them and adults have a duty to take due account of their opinions
     • their right to health (art. 24): they should be able to live in good health.
GIOCONDA draws inspiration from the principles of the Parma Conference. This was the fifth Inter-ministerial
conference on environment and health of the WHO European region during which, in 2010, 53 countries signed
the commitment to ensure “measures to facilitate the participation of young people in our countries, both at
national and international levels, providing support, resources and training so that they can give their opinions
in a conscious and responsible way”.
Finally, GIOCONDA invokes article 9 of the Italian constitution, which is the foundation for the promotion of
science and environmental protection: “The Republic promotes the development of culture, scientific and
technical research, and protects the landscape, and the historical and artistic heritage of the Nation”.

I valori di GIOCONDA
GIOCONDA assume i valori del Piano d’azione per l’ambiente della Commissione europea e si propone di
supportarne la realizzazione.
GIOCONDA ritiene prioritario il diritto a stare bene dei più giovani, bambini e adolescenti, sancito dalla
Convenzione sui diritti dell’infanzia e dell’adolescenza dell’ONU (1989), acquisendo in particolare:
     • il diritto alla non discriminazione (art. 2) - a prescindere dalle loro abilità, stato economico, sesso,
          religione
     • il superiore interesse (art. 3) - il loro interesse deve avere la priorità in ogni legge, provvedimento,
          iniziativa pubblica o privata e in ogni situazione problematica
     • il diritto alla vita, alla sopravvivenza e allo sviluppo (art. 6): gli Stati devono impegnare il massimo
          delle risorse disponibili per tutelare la vita e il sano sviluppo dei giovani
     • l’ascolto delle opinioni del minore (art. 12) - ragazze e ragazzi devono essere ascoltati in tutte le
          decisioni che li riguardano e gli adulti hanno il dovere di tenere in adeguata considerazione le loro
          opinioni
     • il diritto alla salute (art. 24) - le ragazze e i ragazzi devono poter vivere in buona salute.
GIOCONDA si ispira ai principi della Conferenza di Parma, la quinta Conferenza interministeriale su ambiente
e salute della regione europea dell’OMS durante la quale, nel 2010, 53 Paesi hanno firmato l’impegno a garantire
che “venga facilitata la partecipazione dei giovani nei nostri paesi, sia a livello nazionale che internazionale,
fornendo assistenza, risorse e formazione perché possano dare i loro pareri in modo consapevole e responsabile”.
Infine, GIOCONDA si richiama all’articolo 9 della Costituzione italiana, alla base della promozione della cultura
scientifica e della tutela dell’ambiente: “la Repubblica promuove lo sviluppo della cultura e della ricerca
scientifica e tecnica. Tutela il paesaggio e il patrimonio storico e artistico della Nazione”.

                                                       6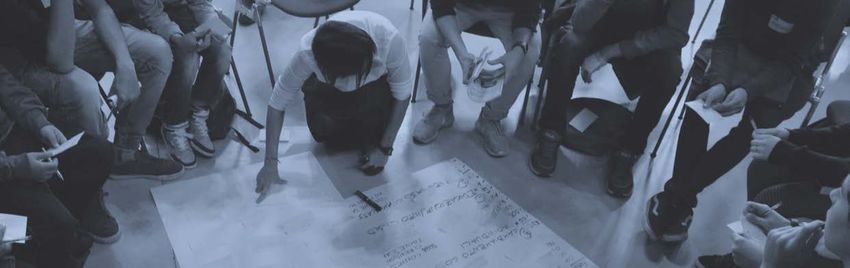
METHODOLOGY
                             GIOCONDA is an interdisciplinary project organised in six stages:
                           1 The study and policy analysis of the socio-economic and health status of four areas (Ravenna, San
                             Miniato, Naples, Taranto). The resulting data and the series of interviews with local administrators,
                             representatives of associations and the schools in the area have enabled us to conduct the first stage of
                             the action-research
                           2 Monitoring major air pollutants and noise, inside and outside the sample schools
                           3 Educational activities with students, in action-research which began with a questionnaire on their
                             perception of risk and concluded with the presentation of recommendations on health and environment
                             to the municipal administrators, through engagement events
                           4 The construction of a platform to compare young people’s perception of risk with data on air pollution
                             (PM10, NO2)
                           5 An assessment of stages 3 and 4, through a series of interviews and replication of activities in other areas
                           6 Networking: a series of seminars, conferences and meetings that led to the proposal of a Network to
                             study the communication (KTE - Knowledge Transfer and Exchange) among the non-expert public,
                             researchers and decision makers in public administrations.

                                                                    GIOCONDA’S KTE METHODOLOGY

                                                                                                                 EVALUATION ACTIVITIES
                          Preparatory actions                      Risk perception
                          • State of the art                       mesurement                        EDUCATIONAL TRAIL          PLATFORM 1
Scientific evidences

                          • Health and socio-economic
                            and characterization
                          • Policy Analysis                         Air and Noise                          Pupils
                                                                    monitoring                             Teachers                 TEST
                                                                                                           Researchers             Ferrara
                                                           Areas                                           Administrators         Montopoli
                                                                                                                                  Calcinaia
                         Ravenna        Lower Valdarno              Naples           Taranto

                       Middle High       Middle    High            Middle High       Middle High     Recommendations
                       School School     School   School           School School     School School
                                                                                                     presented                  PLATFORM 2
                                                       Schools
                                                                                                     in Engagement events

                                       METODOLOGIA
                             GIOCONDA è un progetto interdisciplinare articolato in sei tappe:
                           1 studio dello stato socio-economico e sanitario di quattro aree (Ravenna, San Miniato, Napoli, Taranto)
                             e policy analysis. I dati raccolti e una serie di interviste con amministratori locali, rappresentanti di
                             associazioni e scuole sul territorio hanno permesso di condurre una prima fase di ricerca-azione
                           2 monitoraggio dei maggiori inquinanti atmosferici e del rumore, fuori e dentro le scuole del campione
                           3 attività educativa con gli studenti, in un percorso di ricerca-azione cominciato con un questionario
                             sulla loro percezione del rischio e concluso con la presentazione delle raccomandazioni su salute e ambiente
                             agli amministratori delle loro città, in eventi dedicati
                           4 costruzione di una piattaforma dove confrontare la percezione del rischio di ragazze e ragazzi con i dati
                             sull’inquinamento atmosferico (PM10, NO2)
                           5 valutazione delle tappe 3 e 4, attraverso una serie di interviste e replica delle attività in altri territori
                           6 attività di rete: serie di seminari, conferenze e incontri che hanno portato alla proposta di una rete sul
                             trasferimento e lo scambio di conoscenze (KTE – Knowledge Transfer and Exchange) fra i pubblici di non
                             esperti, i ricercatori e i decisori delle amministrazioni pubbliche.

                                                                                               7
The challenges in the GIOCONDA project areas
In order to bring the scientific evidence to the attention of local decision makers and generate concrete decisions,
the GIOCONDA partnership gathers together local authorities (municipalities, health authorities), regional agencies
for environmental protection (ARPA - Emilia Romagna and Puglia) and scientific bodies (Institute of Clinical
Physiology, National Research Council). The project areas have widely different social and economic characteristics.
This has enabled the project to develop a governance tool that is adaptable to most situations.

The first stage of the project methodology was devoted to examining cutting-edge studies on air and noise
pollution and their effects on young citizens, and analyzing documents that provided an in-depth socio-
economic characterization of the areas involved in the project. At the same time, semi-structured interviews
were conducted with the most relevant stakeholders in the selected areas, which proved to be an important
action-research tool.

“
The most overt criticism concerns air quality and
people don’t just talk about it in Ravenna but across
the entire Po Valley. I’m referring to the pollution from
traffic and industry. Regarding its impact on health,
we have far fewer certainties. As a decision maker I
often find myself reading reports that say “we cannot
rule out that ...”, “ preemptively we could say that ...”.
Making decisions for the entire population is not easy.
(City Councillor, Ravenna)
                                                                 La più conclamata criticità è la qualità dell’aria e se
                                                                 ne parla non solo per Ravenna ma per tutta la
                                                                 pianura padana. Mi riferisco a traffico e industrie.
                                                                 Sull’impatto sulla salute abbiamo molte meno
                                                                 certezze. Come decisore mi trovo spesso a leggere
                                                                 report che dicono “non possiamo escludere che…”,
                                                                 “preventivamente potremmo dire che…”. Prendere
                                                                 decisioni per l’intera popolazione non è facile.
                                                                 (Assessore, Ravenna)

The first studies on excess mortality observed in                Anche se i primi studi sugli eccessi di mortalità
Taranto, ostensibly relating to pollution, date back to          verosimilmente legati all’inquinamento osservati a
1997. Even after the first environmental measures                Taranto risalgono al 1997, la piena consapevolezza del
became available, a full awareness of the role of big            ruolo della grande industria è maturata più lentamente,
industry developed more slowly. (Health agency,                  anche quando hanno cominciato a essere disponibili le
Taranto)                                                         prime misure ambientali. (Azienda sanitaria, Taranto)

Air and noise pollution is an underrated problem.                Un problema sottovalutato è quello dell’inquinamento
Traffic means chaos, holdups, risks, but not pollution.          dell’aria e del suono. Il traffico è caos, ostacolo, rischio,

                                                                                                                           “
(NGO, Napoli)                                                    ma non inquinamento. (ONG, Napoli)

Le sfide nei territori di GIOCONDA
Per raggiungere l’obiettivo di portare le evidenze scientifiche all’attenzione dei decisori locali e trasformarle in
decisioni concrete, il partenariato di GIOCONDA riunisce autorità locali (comuni, aziende sanitarie), ARPA
regionali (Emilia Romagna e Puglia) e istituzioni scientifiche (Istituto di fisiologia clinica del CNR). I luoghi del
progetto presentano una grande diversità per caratteristiche sociali ed economiche; questa diversità ha
consentito di costruire uno strumento di governance adattabile a più situazioni.

I primi passi del percorso metodologico sono stati dedicati allo studio dello stato dell’arte sugli effetti che
l’inquinamento atmosferico e acustico hanno sui giovani cittadini; in secondo luogo è stata condotta un’analisi
documentale per approfondire la caratterizzazione socio-economica delle aree coinvolte nel progetto. Allo stesso
tempo, è stata realizzata una serie di interviste semi-strutturate con gli stakeholder più rilevanti. Oltre a portare
alla luce conoscenze locali fondamentali, le interviste si sono dimostrate un importante strumento di ricerca-azione.

                                                             8
Steps taken in schools
The activities in GIOCONDA schools form the basis of the dialogue between young people and administrators.
The learning pathway in class was broken down into seven steps:
1 creating conceptual maps in class around the key word “risk”
2 filling out questionnaires on the perception of risk related to environment and health, and on young
people’s willingness to pay to reduce the risk (Willingness-To-Pay, WTP)
3 installation of tools for monitoring air and noise quality and the implementation of environmental
monitoring campaigns inside and outside the classrooms; meetings with monitoring specialists and
epidemiologists
4 preparation of the challenge booklets for the four areas, describing issues discussed and defining priority
actions
5 showing young people the results of environmental monitoring activities, and adding this information
to their challenge booklets
6 discussing and drafting recommendations, arising from joint meetings of classes from each of the cities
where the results, ideas and both collective and individual solutions were worked on together
7 final events: presentation of recommendations to local administrators who will respond directly to the
students and teachers.
The implementation of this pathway in the first year of the project led to the consolidation of a toolkit for
secondary schools, which enables other teachers to replicate GIOCONDA in other cities. The students involved
were aged between 11 and 17.
Il percorso nelle scuole
Le attività nelle scuole di GIOCONDA sono la base della costruzione del dialogo tra giovani e amministratori.
Il percorso di lavoro nelle classi è stato strutturato in sette tappe:
1 realizzazione di mappe concettuali, da costruire in classe attorno alla parola-chiave “rischio”
2 compilazione di questionari sulla percezione del rischio ambiente-salute e sulla disponibilità a pagare
dei giovani per ridurre il rischio (Willingness-To-Pay, WTP)
3 installazione degli strumenti per il monitoraggio di qualità dell’aria e rumore e realizzazione delle
campagne di monitoraggio ambientale, fuori e dentro le aule; incontro con i tecnici del monitoraggio e
gli epidemiologi
4 preparazione di quaderni delle sfide nei quattro territori, per la descrizione delle tematiche discusse e
la definizione delle priorità di intervento
5 presentazione ai ragazzi dei risultati delle attività di monitoraggio ambientale, da aggiungere ai
quaderni delle sfide per completare il quadro conoscitivo
6 discussione e produzione delle raccomandazioni, svolte grazie all’incontro delle classi di ciascuna città
per elaborare insieme risultati, idee e soluzioni collettive e individuali
7 eventi finali, durante i quali presentare le raccomandazioni agli amministratori e ascoltare la loro risposta.
La realizzazione di questo percorso nel primo anno di progetto ha portato al consolidamento di un toolkit per
le scuole superiori di primo e secondo grado, che permette agli insegnanti di replicare GIOCONDA nella loro
città. L’età dei ragazzi coinvolti è tra gli 11 e i 17 anni.
9RESULTS
The meaning of risk
The goal of the first stage in schools was to find out what the school children already knew and how they saw
their future, which is important from a content and methodological point of view. The project team collected
this information in order to compare it with the measured data, later on in the project.
In a brainstorming exercise, on Post-It notes participants wrote a word or phrase related to the concept of
“risk.” Cloud maps of definitions were created, later enriched with places, causes and possible solutions to
mitigate the risks that had emerged.
Results showed a significant tendency of adolescents to associate risk with emotional stress, related to being
judged by their school and family, and to the dangers of the road, expressed with the words “fear, danger,
excitement, adrenaline.” Their perception of risk did not however involve only negative outcomes, but also the
opportunity to achieve significant results (success, winning). Other areas where risks were identified were
natural disasters, gambling and health. The most frequent word linked to risk was “death.”
Rarely, and only by older school students, was an explicit link made between environmental and health
problems. The connection was particularly apparent in the Taranto area, where the current situation and the
one reported by the media were reflected macroscopically on the children’s risk perception. Noise never came
up spontaneously as a cause of risk to health.
10Death ILVA Environment
Troubles
Life Pollution
Obstacles
Challenge
Hazard
Associations
Panic Industry
Is
Work Sea
Risk Places
Streets
Park City
Causes
Streets
Solutions
Pedophiles
More controls
Gypsies
Car accidents
Controls
Fig. 1: Risk Map, an example from the first stage Industrial
in GIOCONDA's schools. policy New jobs Attention
Esempio di mappa del rischio risultante dalla
prima tappa di GIOCONDA per le SCUOLE.
Remediation No alcool
RISULTATI
I significati di rischio
Obiettivo della prima tappa nel percorso nelle scuole è stato comprendere ciò che ragazze e ragazzi conoscono
e cosa pensano del proprio futuro, importante sia dal punto di vista metodologico che di contenuto. Il team
di progetto ha raccolto le conoscenze degli studenti per accompagnarle, più avanti nel percorso, alla lettura
dei dati misurati.
In un esercizio di brainstorming, i partecipanti hanno scritto su un post-it una parola o frase collegata al
concetto di “rischio”. Si sono formate nuvole di significati, arricchiti in seguito dai luoghi, dalle cause e dalle
possibili soluzioni per la mitigazione dei rischi emersi.
I risultati mostrano una sostanziale tendenza degli adolescenti ad associare il rischio a uno stress emotivo
legato al giudizio della scuola e della famiglia, ai pericoli della strada, espressi con le parole “paura, pericolo,
emozione, adrenalina”. Il rischio non porta però soltanto esiti negativi, ma anche la possibilità di raggiungere
risultati importanti (successo, vincita). Le altre aree dove viene collocato il rischio sono quelle dei disastri
naturali, del gioco d’azzardo, della salute. La parola più frequente collegata a rischio è “morte”.
Raramente, e soltanto da parte degli studenti della scuola secondaria di secondo grado, viene fatto un
collegamento esplicito fra i problemi ambientali e quelli di salute. La connessione è particolarmente evidente
nell’area di Taranto, dove la situazione reale e quella raccontata dai media si riflettono in modo macroscopico
sulla loro percezione del rischio. Il rumore non emerge mai spontaneamente come causa di rischio per la salute.
11Monitoraggio: qualità dell’aria e del rumore fuori e dentro le scuole
>>
Durante l’anno scolastico 2014/15, in ciascuna delle otto scuole di GIOCONDA è stata condotta una campagna
di misurazione della qualità dell’aria e del rumore.
• Campionatori attivi per il particolato atmosferico
Strumentazione impiegata • Campionatori passivi per i gas
• Fonometri e casse di risonanza per il rumore
Posizionamento • All’interno delle strutture scolastiche (fino a 4 siti)
scuole e aree vicine • All’esterno delle strutture scolastiche (fino a 3 siti)
• Durante il periodo invernale (novembre 2014 - marzo 2015)*
Periodo di campionamento • Durante il periodo estivo (aprile 2015 - luglio 2015)
*per il rumore le campagne sono state condotte solo durante il periodo invernale
• Particolato atmosferico (PM10 e PM2,5)
Inquinanti monitorati • Inquinanti atmosferici gassosi (NO2, C6H6, H2S)
• Livelli equivalenti di rumore
Tab. 2: Metodologia del monitoraggio di aria e rumore.
OMS linee guida
Inquinante D.Lgs.2010/155 (Italia)
qualità dell’aria
40 µg/m3 media annuale 20 µg/m3 media annuale
PM10
50 µg/m3 media 24 ore 50 µg/m3 media 24 ore
25 µg/m3 media annuale 10 µg/m3 media annuale
PM2.5
- 25 µg/m3 media 24 ore
40 µg/m3 media annuale 40 µg/m3 media annuale
NO2
200 µg/m3 media 1 ora 200 µg/m3 media 1 ora
C 6H 6 5 µg/m3 media annuale -
Tab. 3: Limiti di riferimento della legge italiana e delle Linee guida dell’Organizzazione mondiale della sanità, OMS.
13Air quality inside and outside GIOCONDA schools
Considering the damage to health caused by air pollutants, which has been demonstrated by several scientific
studies, and that the exposed population is particularly sensitive, GIOCONDA took as a reference the air quality
guidance levels proposed by WHO to protect human health. Regarding benzene (C6H6), which has been
recognized as carcinogenic, Italian law established a threshold level of 5 µg/m3, whereas the WHO asserts that
a recommended threshold does not exist, i.e. this pollutant must not be present in the air we breath.
Particulate levels of PM10 and PM2.5 measured by GIOCONDA were within the limits according to Italian
regulations, both inside and outside schools, but they exceeded WHO thresholds safeguarding the health
of citizens.
Benzene and NO2 levels do not exceed Italian law, but they should be monitored constantly and aimed at being
reduced to zero.
The graphs show concentrations of pollutants outside the schools. For a full report, please consult GIOCONDA’s
website: http://gioconda.ifc.cnr.it/?page_id=1654
{ 14Qualità dell’aria fuori e dentro le scuole di GIOCONDA
Considerando i danni sulla salute provocati dagli inquinanti atmosferici, dimostrati da numerose ricerche
scientifiche, e il fatto che si tratta dell’esposizione di una fascia di popolazione particolarmente sensibile,
GIOCONDA ha preso come riferimento i valori guida indicati dall’OMS per proteggere la salute delle persone.
Per il benzene, un cancerogeno certo, la legge italiana stabilisce 5 µg/m3 di concentrazione media annua, ma
l’OMS afferma che non c’è una soglia raccomandabile: questo inquinante non deve essere presente nell’aria
che respiriamo.
I livelli delle polveri sottili PM10 e PM2,5 misurate da GIOCONDA sono risultati all’interno dei limiti secondo la
regolamentazione italiana, sia all’interno che all’esterno delle scuole, oltre la soglia proposta dall’OMS per
tutelare la salute dei cittadini.
I livelli di biossido di azoto (NO2) e di benzene (C6H6) non superano mai i limiti stabiliti per l’Italia, ma dovrebbero
essere monitorati costantemente per raggiungere lo zero.
Sono qui riportati i grafici che mostrano le concentrazioni di inquinanti fuori dalle scuole. Tutti i risultati sono
consultabili sul sito web del progetto all’indirizzo: http://gioconda.ifc.cnr.it/?page_id=1654
15-+
Fig. 2: Ravenna - outdoor pollutant concentrations
60 3
50 2.5
Concentration [µg/m^3]
Concentration [µg/m^3]
40 2
30 1.5
20 1
29 28 30 28 24 18 27 18 32 28 40 47 0,9 1,1 1,3 1,4
10 0.5
0 0
PM10 PM2.5 NO2 Benzene
Fig. 3: Lower Valdarno - outdoor pollutant concentrations
60 3
50 2.5
Concentration [µg/m^3]
Concentration [µg/m^3]
40 2
30 1.5
20 1
10 25 27 19 27 24 15 27 22 14 22 1,9 2,5 1,4 2,5 0.5
0 0
PM10 PM2.5 NO2 Benzene
n Middle school n Station Urban-Background n High school n Station Urban-Traffic
Scuola media Centralina ambiente urbano Scuola superiore Centralina traffico urbano
16-+
Fig. 4: Naples - outdoor pollutant concentrations
60 3
50 2.5
Concentration [µg/m^3]
Concentration [µg/m^3]
40 2
30 1.5
20 1
10 26 27 27 35 17 25 33 44 42 26 50 2,8 0.5
0,1 0,2
0,3
0 0
PM10 PM2.5 NO2 Benzene
Fig. 5: Taranto - outdoor pollutant concentrations
60 3
50 2.5
Concentration [µg/m^3]
Concentration [µg/m^3]
40 2
30 1.5
20 1
10 0.5
34 33 31 30 16 18 14 11 8 7 7 6 1,7 1,6 0,8 0,7
0 0
PM10 PM2.5 NO2 Benzene
Fig. 2, 3, 4, 5: Outdoor pollutant concentration monitored in GIOCONDA’s sites
Risultati dei monitoraggi nelle quattro aree di GIOCONDA
17Noise pollution inside and outside GIOCONDA schools
In order to analyze the results from the noise monitoring, GIOCONDA researchers developed a global indicator,
the GNS (Global Noise Score), which summarizes the acoustics of the classroom, taking into consideration: the
sound level that characterizes the internal and external environment; the external wall insulation; the internal
wall insulation; the reverberation time and speech intelligibility index. A scale of scores was prepared for the
GNS, divided by classes, obtained starting with the scores assigned to the individual indicators, based on the
limit values according to Italian law and on the quality values that derive from Italian and European studies.
This indicator, which has been developed and tested, has been presented at several scientific congresses.
Noise measurement results revealed a negative situation in most of the classrooms in the eight Gioconda
schools. About 75% of the classes were at the lower end of the scale (“poor” and “very poor” quality). The
causes are mainly related to structural problems in the school buildings, however in some cases poor
maintenance has had a very negative influence, in particular regarding the window and door frames.
Specific interventions were suggested and in some cases improvements were easily implemented.
x
Leq. The noise level equivalent to a
sound or noise variable in time is the
level expressed in decibels (dB - noise
measurement unit) of a hypothetical
constant noise which, if substituted
Leq. Il livello sonoro equivalente di un
suono o rumore variabile nel tempo è
il livello espresso in decibel (dB - unità
di misura del rumore) di un ipotetico
rumore costante che, se sostituito al
x
with the real noise for the same rumore reale per lo stesso intervallo
interval of time, would result in the di tempo, comporterebbe la stessa
same total amount of sound energy. quantità totale di energia sonora.
L’inquinamento da rumore dentro e fuori le scuole di GIOCONDA
Per analizzare i risultati dei monitoraggi del rumore, i ricercatori di GIOCONDA hanno elaborato un indicatore
globale, il GNS (Global Noise Score), che riassume la situazione acustica dell’aula e considera: il livello sonoro
che caratterizza l’ambiente interno ed esterno; l’isolamento di facciata; l’isolamento di parete; il tempo di
riverbero e un indice di intelligibilità del parlato. Per il GNS è stata predisposta una scala di punteggi, divisa
per classi, ottenuta a partire dai punteggi assegnati ai singoli indicatori, basati sui valori limite secondo le leggi
italiane e su valori di qualità che derivano da studi italiani ed europei. Questo indicatore, messo a punto e
testato, è stato presentato a diversi congressi scientifici.
Il risultato della misurazione del rumore rivela una situazione negativa nella maggior parte delle aule: nelle
otto scuole di GIOCONDA. Circa il 75% delle classi si colloca ai gradini più bassi della scala (qualità “scarsa” e
“scarsissima”). Le cause sono legate soprattutto a problemi strutturali degli edifici, ma in qualche caso la
pessima manutenzione degli stessi, in particolare degli infissi, influisce in maniera molto negativa.
In alcune scuole sono stati suggeriti interventi specifici di facile realizzazione.
18Fig. 6: Noise global evaluation in schools / Valutazione globale del rumore nelle scuole
26
Global Noise Score - GNS
21
16
11
6
Valdarno MS Valdarno HS Ravenna MS Ravenna HS Napoli MS Napoli HS Taranto MS Taranto HS
n Very poor - Pessimo n Poor - Scarso n Sufficient - Sufficiente n Good - Buono n Very good - Ottimo
External equivalent level Internal wall insulation Reverberation time
0 0
0
3 2 2
1 2
3
4 11
16
20
0 8
Internal equivalent level External wall insulation RASTI
0 0 0 0
1 4 3
10 10
0 0
23
4 17
=
Performances monitored in the 24 classrooms of GIOCONDA. / Prestazioni delle 24 aule indagate secondo i
parametri di rumore analizzati.
Lack of acoustic anti-vibration ceilings
Problems occured Lack of sound-proofing fixtures
Bad maintenance of the fixtures
19Towards a risk perception index: questionnaires
A comparison between the results from the air and noise quality monitoring in schools and the perception of
risk of school children is a powerful tool in support of the decision making of public administrations.
As part of the GIOCONDA project, a questionnaire was developed to monitor the perception of risks related to
the air and noise quality in the four pilot areas, based on a psychometric approach. The questionnaire was
used to measure the students’ perception of: the quality of the environment in each of the project cities; the
quality of the environment near the school in relation to air and noise pollution; the causes of air and noise
pollution; the health risks; and the sources of information.
The questionnaire was distributed fairly evenly in the four locations. A total of 503 students responded: 287
middle school students, 216 high school students, with a total of 206 girls and 297 boys.
The main results as regards air pollution show that:
• the perception of the quality of the environment in their own cities varied considerably from
city to city
• the causes of pollution were attributed for the most part to industry and road traffic, with significant
differences between the four areas
• the main differences concern the different areas and the age of the respondents: the younger children
(middle school students) showed a greater perception of the danger than older children (high school
students). About 30% of the middle school students believe that the air quality in their school area
was very bad or poor, compared with 17.1% of the high school students. Even more pronounced
differences are related to the concerns about air pollution in the area where the school is located:
31.7% of the middle school students responded “quite a lot” or “a very great deal” compared with
5.6% of the high school students.
Verso un indice di percezione del rischio: i questionari
Mettere a confronto i risultati dei monitoraggi sulla qualità dell’aria e del rumore negli ambienti scolastici
con la percezione del rischio che hanno ragazze e ragazzi è un potente strumento per supportare le decisioni
degli amministratori.
Nell’ambito del progetto GIOCONDA è stato elaborato un questionario per monitorare la percezione del rischio
legato alla qualità dell’aria e al rumore nelle quattro aree pilota, basandosi sull’approccio psicometrico. Il
questionario è servito a misurare: la percezione della qualità dell’ambiente nella città di appartenenza; la qualità
dell’ambiente vicino alla loro scuola in relazione all’inquinamento atmosferico e acustico; le cause
dell’inquinamento dell’aria e da rumore; i rischi per la salute; le fonti di informazione.
Hanno risposto complessivamente 503 studenti, distribuiti in modo piuttosto omogeneo nelle quattro località: 287
studenti della scuola secondaria di primo grado, 216 di secondo grado, per un totale di 206 ragazze e 297 ragazzi.
I maggiori risultati per ciò che riguarda l’inquinamento atmosferico mostrano che:
• la percezione della qualità dell’ambiente nella propria città varia sensibilmente da area ad area
• le cause dell’inquinamento sono attribuite per la maggior parte a industrie e traffico veicolare, con
sensibili differenze fra le quattro aree
• le maggiori differenze riguardano sia le diverse aree che l’età dei rispondenti: i più piccoli (secondaria
di primo grado) manifestano una maggiore percezione del pericolo rispetto ai compagni delle superiori,
circa il 30% degli studenti delle medie ritiene la qualità dell’aria nella zona della scuola
pessima/scadente, contro il 17,1% dei ragazzi più grandi. Differenze ancora più marcate riguardano
la preoccupazione per l’inquinamento dell’aria nella zona in cui si trova la scuola: il 31,7% dei
ragazzi delle medie ha risposto “molto/moltissimo” contro il 5,6 % di quelli delle superiori.
20Fig. 7: How is the quality of the environment in your town? / Com’è la qualità dell’ambiente
nella tua città?
Excellent n San Miniato
Ottimo n Ravenna
n Taranto
n Napoli
Good
Buono
Adequate
Sufficiente
Low
Scarso
Very bad
Pessimo
0 2 4 6 8 10 12 14 16
Fig. 8: Are you worried about the air pollution in your schools’ area? / Sei preoccupata/o per
l’inquinamento dell’aria presente nella zona in cui si trova la tua scuola?
Very much
Moltissimo n San Miniato
n Ravenna
n Taranto
Much n Napoli
Molto
Somehow
Abbastanza
Little
Un po’
Not at all
Per niente
0 2 4 6 8 10 12 14
21Comparison of risk perception results with the data from
environmental measures
Through the questionnaire analysis, a Risk Perception Index (RPI) was calculated for air and noise pollution.
The RPI provides a summary of the responses to the questionnaire regarding the perception of risk. The
questions included are: “Are you worried about the noise in the area where your school is?”; “Is there any
annoying noise in the neighbourhood of your school that is causing you problems?”; “How worried are you
about the damage to your health from noise?”
The RPI was calculated for the total sample, and by geographical area, gender, type of school (middle school
and high school) and different combinations of these variables. Later, using statistical tests, the differences
between areas, types of school and genders were evaluated. The average perception derived from student
responses, for each class and each city, is presented on a scale ranging from 0 to 100, grouped into 5 classes.
Indicator / Indicatore Values / Valori
Very low / Molto bassa 0-20
Risk Perception Index (RPI) Low / Bassa 21-40
Medium / Media 41-60
Indice di Percezione
del Rischio (IPR) High / Alta 61-80
Very high / Molo alta 81-100
Tab. 4: RPI values / Valori utilizzati per definire l'IPR.
Il confronto dei risultati sulla percezione del rischio con i dati
delle misure ambientali effettuate
L’elaborazione dei questionari ha permesso di calcolare un indice di percezione del rischio (IPR) per
l’inquinamento dell’aria e un IPR per il rumore. L’IPR fornisce una sintesi delle risposte alle domande del
questionario che riguardano la percezione del rischio. Tra le altre: “Sei preoccupata/o per i rumori presenti
nella zona in cui si trova la tua scuola?”; “I rumori fastidiosi presenti nella zona in cui si trova la tua scuola ti
provocano problemi?”; “Quanta paura hai dei danni per la salute causati dal rumore?”.
L’IPR è stato descritto per il totale del campione, per area geografica, per genere, per tipologia di scuola
(secondaria di primo e secondo grado) e per le diverse combinazioni di queste variabili. In seguito, mediante
test statistici, sono state valutate le differenze tra aree, tipologia di scuola e genere. La percezione media
ricavata dalle risposte degli studenti, per classe e per città, è presentata su una scala che va da 0 a 100,
raggruppata in 5 classi.
RPI for each city RPI middle schools RPI high schools
IPR per città IPR scuole medie IPR scuole superiori
Total 4 areas
63 - High / Alto 64 - High / Alto 63 - High / Alto
Totale 4 aree
Ravenna 58 - Medium / Medio 57 - Medium / Medio 59 - Medium / Medio
Taranto 78 - High / Alto 77 - High / Alto 80 - High / Alto
San Miniato 58 - Medium / Medio 61 - High / Alto 54 - Medium / Medio
Napoli 64 - High / Alto 62 - High / Alto 65 - High / Alto
Tab. 5: Risk perception results - air pollution. Risultati della percezione del rischio - inquinamento dell’aria.
22RPI for each city RPI middle schools RPI high schools
IPR per città IPR scuole medie IPR scuole superiori
Total 4 areas
41 - Medium / Medio 43 - Medium / Medio 39 - Low / Basso
Totale 4 aree
Ravenna 39 - Low / Basso 39 - Low / Basso 38 - Low / Basso
Taranto 44 - Medium / Medio 44 - Medium / Medio 45 - Medium / Medio
San Miniato 40 - Medium / Medio 44 - Medium / Medio 36 - Medium / Basso
Napoli 43 - Medium / Medio 46 - Medium / Medio 41 - Medium / Medio
Tab. 6: Risk perception results - noise pollution. Risultati della percezione del rischio - inquinamento da rumore.
Comparison with the noise measured by GIOCONDA
The risk perception values were compared to the noise monitored in each of the classrooms. The data obtained,
on the whole, show that there is a good correlation between the perceived noise and the noise measured in
the classes involved in the GIOCONDA project. The GNS, the overall score on the noise measured, correlates
well with the Average Risk Perception Index (ARPI) and with individual questions on the questionnaire about
noise. The GNS therefore remains a good indicator of the acoustics in a class and at the same time is well-
correlated to the perceived noise level. As for the measurements taken by GIOCONDA, the outside (external
Leq) and inside noise levels (internal Leq) correlated positively with answers to questions about the perception
of noise. There was no correlation between the external and internal Leq with distraction attributed to noise,
as is understandable, considering that distraction is mainly due to single events rather than background noise.
The external and internal wall insulation did not correlate with the perception of noise, because it depends
directly and only on the structural characteristics of the classroom and not on its noise level. It is easier for
students to attribute high sound levels to external sources than to poor insulation.
Comparison with air quality measured by GIOCONDA
The RPI described above did not correlate with the environmental data of the PM10 measured.
Therefore another index was used: the Environmental Risk Awareness Index (ERAI), which does not include
variables related to risk perception, but to the presence of danger. Using ERAI, a correlation with both the
indoor and outdoor PM10 was observed.
Confronto con il rumore misurato da GIOCONDA
I valori della percezione del rischio sono stati confrontati con il rumore monitorato in ciascuna delle aule. I
dati ottenuti nel complesso mostrano che vi è una buona correlazione tra rumore percepito e rumore misurato
nelle classi coinvolte nel progetto GIOCONDA. Il GNS, il punteggio globale sul rumore misurato, risulta ben
correlato con la media dell'indice di percezione del rischio (MPRI) e con le singole domande del questionario.
Il GNS quindi si conferma un buon indicatore della situazione acustica misurata in classe e al contempo ben
correlato alla situazione acustica percepita. In particolare, tra le misurazioni fatte da GIOCONDA, il livello
acustico esterno (Leq esterno) e quello interno (Leq interno) sono positivamente correlati con le risposte alle
domande sulla percezione del rumore. Non vi è alcuna correlazione tra Leq esterno e Leq interno con la
distrazione attribuita al rumore, come comprensibile considerando che la distrazione deriva soprattutto da
eventi singoli più che dal rumore di fondo.
L’isolamento di facciata e di parete sono risultati non correlati con la percezione del rumore, perché dipendono
direttamente solo dalle caratteristiche strutturali dell’aula e non dal suo livello di rumore. È più facile per gli
studenti attribuire alti livelli sonori a fonti esterne che allo scarso isolamento dell'edificio.
Confronto con la qualità dell’aria misurata da GIOCONDA
L’indice IPR sopra descritto non è in correlazione con i dati ambientali del PM10 misurato.
È stato sperimentato in questo caso un altro indice: definito indice di consapevolezza del pericolo ambientale
(ICPA) che non comprende le variabili legate alla percezione del rischio, ma la presenza del pericolo.
Considerando questo indice ICPA si osserva una correlazione sia con il PM10 nell’ambiente interno che esterno.
23Willingness-To-Pay to reduce health risks
One of the activities carried out during the GIOCONDA project was the cost-benefit analysis. This enables the
health benefits resulting from the reduction of pollution to be quantified in monetary terms and for such
monetary costs to be compared with the cost of an environmental intervention. For example, it is possible to
evaluate the cost-benefit of creating a pedestrian area in a busy city center.
To evaluate health benefits an estimate is needed of how much individuals (young people in the case of
GIOCONDA) are willing to pay to reduce the health risks that affect them, in addition to direct health care costs.
One example of risk used in the questionnaire was having an asthma attack due to air pollution. Girls and
boys declared their willingness to pay to reduce this risk by choosing one of these two options: reducing the
risk of having an asthma attack from 20% to 10%, or from 20% to 1%.
The analysis of the questionnaire results showed that:
• the majority of respondents (81%) were willing to sacrifice part of their monthly budget to reduce air
pollution
• the median response from pupils on the amount they were willing to pay to reduce the risk by 20%
to 1% was 26€ per month. The youngest (11 – 13 years) were willing to pay more than the older
students (14 - 17 years), regardless of their health status (whether or not they had asthma), while no
differences were found between girls and boys
• the WTP did not vary significantly between the four areas considered, with the exception of Taranto,
where all the students were willing to pay more to reduce health risks due to environmental factors.
La disponibilità a pagare per ridurre il rischio sanitario
(Willigness-To-Pay)
Una delle attività effettuate nel corso del progetto GIOCONDA è l’analisi costo-beneficio. Questo tipo di analisi
permette di quantificare in termini monetari il beneficio di salute derivante dalla riduzione dell’inquinamento
e di confrontarlo con il costo di un intervento ambientale. È possibile ad esempio valutare il costo-beneficio
della pedonalizzazione di un’area trafficata nel centro di una città.
Per valutare il beneficio sanitario è necessario avere, oltre ai costi sanitari diretti, una stima di quanto gli
individui, nel caso di GIOCONDA i giovani, siano disposti a pagare per ridurre il rischio sanitario che li riguarda.
L’esempio di rischio usato nel questionario è quello di avere un attacco di asma dovuto all’inquinamento
dell’aria. Ragazze e ragazzi hanno espresso la loro disponibilità a pagare per ridurlo scegliendo una tra queste
due possibilità: riduzione del rischio di avere un attacco d’asma dal 20% al 10% o dal 20% all’1%.
Dall’analisi dei risultati del questionario emerge che:
• la maggior parte dei rispondenti (81%) è disposta a sacrificare parte del suo budget mensile per ridurre
l’inquinamento dell’aria
• la mediana delle risposte dei ragazzi sulla cifra che sono disposti a pagare per ridurre il rischio dal
20% all’1% dà come risultato 26€ al mese; i più giovani (11-13 anni) sono disposti a pagare di più
rispetto ai più grandi (14 - 17 anni), indipendentemente dal loro stato di salute (se dichiarano di avere
l’asma oppure no); non si riscontrano differenze tra ragazze e ragazzi
• la disponibilità a pagare non varia in maniera significativa fra le quattro aree considerate, fatta
eccezione per Taranto, dove tutti gli studenti sono disposti a pagare di più per ridurre il rischio sanitario
dovuto a fattori ambientali.
24Building a GIOCONDA of the future: co-production of the
project pathway and platform
To make GIOCONDA a sustainable and replicable project, a web space was created where training opportunities,
methods, materials, data and maps were available in one place. This space is the platform of the GIOCONDA
project, accessible after registering via the project’s website.
While the platform was being planned and built, it was tested in five schools: three in Ferrara and two in the
region of the Lower Valdarno. Information and methodologies were thus collected directly from the participants
via the user experience evaluation, and were used to improve the project and make it sustainable.
The social research methods used to test the platform and the project pathway were used to evaluate six
indicators: GIOCONDA’s consistency with and relevance to school curricula and local policies on environment
and health; the efficiency of the pathway and platform; the effectiveness of the content and tools; the impact
on citizens; sustainability and replicability.
Costruire GIOCONDA del futuro: co-produzione del percorso
e della piattaforma
Per rendere GIOCONDA un progetto sostenibile e replicabile è stato costruito uno spazio web dove far confluire
l’offerta formativa, i metodi, i materiali, i dati e le mappe. Questo spazio è la piattaforma del progetto
GIOCONDA, accessibile dal sito web del progetto mediante registrazione.
Durante la fase di progettazione e realizzazione la piattaforma è stata testata in 5 scuole: 3 a Ferrara e 2 nella regione
del Valdarno Inferiore. In questo modo sono state raccolte le indicazioni direttamente dai destinatari, mediante le
tecniche della user experience evaluation, e sono state utilizzate per migliorare il progetto e renderlo sostenibile.
I metodi della ricerca sociale usati per effettuare il test della piattaforma e del percorso di progetto sono stati
usati per valutare 6 indicatori: coerenza e rilevanza di GIOCONDA con i programmi scolastici e le politiche
locali su ambiente e salute; efficienza del percorso e della piattaforma; efficacia di contenuti e strumenti;
impatti sulla cittadinanza; sostenibilità e potenzialità di replicazione.
Platform Test Results
During the platform testing stage, information was gathered regarding its usability by interviewing administrators
and teachers. This feedback was welcomed by technicians before finalizing its construction.
All the indicators explored during the discussions showed positive values, highlighting:
• for teachers, the opportunity to combine a multidisciplinary project with learning pathways of active
citizenship; to use a rich but clear methodology; to assess not only the knowledge of their students
but also their skills
• for administrators, the opportunity to find out about the risk perceptions of younger citizens in
different areas of the city, to integrate their recommendations in policy documents dealing with
environment and health issues, and to improve communication with citizens.
Risultati del test della piattaforma
Durante la fase di test della piattaforma sono state raccolte indicazioni riguardanti la sua usabilità intervistando
amministratori e insegnanti. Gli input ricevuti sono stati accolti dai tecnici per finalizzare la costruzione della
piattaforma.
Tutti gli indicatori esplorati nei colloqui hanno mostrato valori positivi, facendo emergere:
• per gli insegnanti, la possibilità di unire un progetto multidisciplinare a un percorso di cittadinanza
attiva; usare una metodologia ricca ma chiara; valutare le competenze e non solo le conoscenze dei
loro studenti
• per gli amministratori, la possibilità di conoscere la percezione del rischio dei cittadini più giovani in
diverse zone della città, integrare le loro raccomandazioni nei documenti programmatici che toccano
i temi di ambiente e salute, produrre migliore comunicazione verso la cittadinanza.
25Puoi anche leggere