Radionuclides Interactions with matter Biological effects Radiocarbon dating
←
→
Trascrizione del contenuto della pagina
Se il tuo browser non visualizza correttamente la pagina, ti preghiamo di leggere il contenuto della pagina quaggiù
1

Radiations
                                  Radionuclides
                                  Interactions with matter
                                  Biological effects
                                  Radiocarbon dating

               © LEGO

CORSO DI FISICA NUCLEARE - PAOLO FINELLI   DIP. FISICA ED ASTRONOMIA - UNIVERSITÀ DI BOLOGNA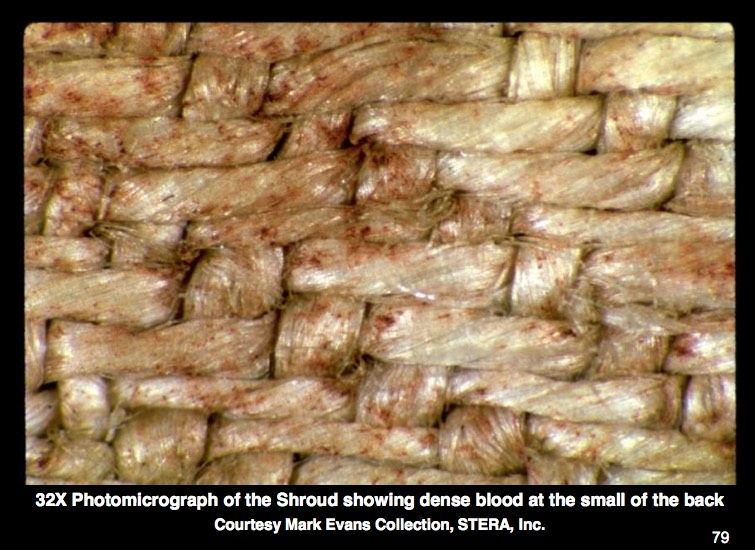
2

Natural radiations

                                                                   © Wikipedia

CORSO DI FISICA NUCLEARE - PAOLO FINELLI   DIP. FISICA ED ASTRONOMIA - UNIVERSITÀ DI BOLOGNA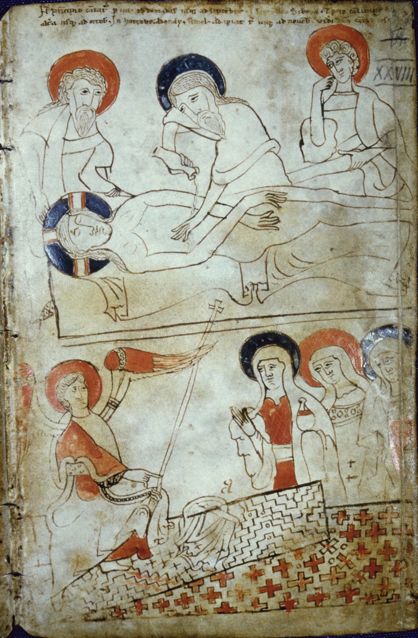
3

CORSO DI FISICA NUCLEARE - PAOLO FINELLI   DIP. FISICA ED ASTRONOMIA - UNIVERSITÀ DI BOLOGNA
4

Natural radiations:
where they come from

                                                     ys
                                                    ra
                                                  ic
                                               sm
                                             Co
                                            Cosmogenic
                                            radionuclides

                                                  Artificial
                                                  radionuclides
                            Natural               (produced by men)
                            radionuclides

CORSO DI FISICA NUCLEARE - PAOLO FINELLI            DIP. FISICA ED ASTRONOMIA - UNIVERSITÀ DI BOLOGNA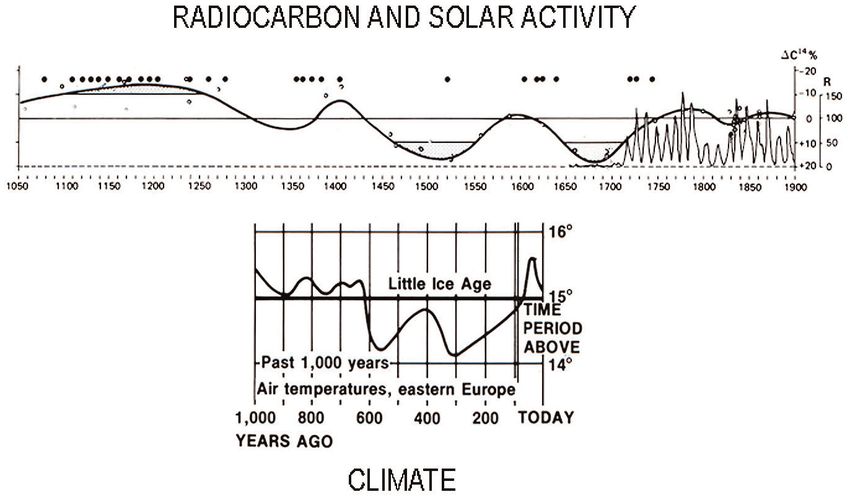
Tabella 2.1. Nuclei radioattivi primordiali. CE = Cattura Elettronica
5
Natural Nuclide Abbondanza
isotopica (%)
Prodotti
stabili dei
decadimenti
Modo del
decadimento
T1/2 (anni)
radiations: 40
19 K 0.0117
40
18 Ar
40
20 Ca
CE, β +
β−
1.28 · 109
primordial nuclides 50
23 V 0.25
50
22 T i CE, β +
1.4 · 1017
50
24 Cr β−
2 Radiazione ambientale naturale
87
37 Rb 27.835 87
38 Sr β− 4.75 · 1010
ella 2.2. Abbondanza dei nuclei sulla terra in peso (parti per milione, ppm) di
113
48 Cd
h e K in vari ambienti terrestri. L’abbondanza isotopica di 238 U e 232 T h è circa 12.22 113
49 In β− 9.3 · 1015
40
00%, quella dell’isotopo radioattivo K del 1.17%
49
115
In 95.71 115
50 Sn β− 4.41 · 1014
123 123
U Th K
52 T l 0.908 51 Sb CE 1.2 · 1013
Rocce 1.8 6 1.5 · 103 138
CE, β +
138 56 Ba
Mari 3.3 · 10 −3
4 · 10 −8
4.14 · 10 2 57 La 0.09 138 −
1.05 · 1011
58 Ce β
−5 −4
Fiumi 4 · 10 10 2.3 144 140
−3 −3 3
60 N d 23.80 58 Ce α 2.29 · 1015
Corpo umano 1.4 · 10 1.4 · 10 2 · 10
147 143
62 Sm 15.0 60 N d α 1.06 · 1011
ppm (parts per million) 152 148
64 Gd 0.20 62 Sm α 1.1 · 1014
1 L’uranio
174 170
72 Af 0.162 70 Y b α 2.0 · 1015
anio puro è un metallo di colore argenteo, duttile, malleabile, piroforico.
sobari noti sono 25 (con A = 218 − 242). Di essi l’238 U e l’235 U sono 71
176
i Lu 2.59 176
72 Hf β− 3.73 · 1010
isotopi a lunga vita media, quindi quasi stabili, più abbondanti (99.2745187
0.72 %); il terzo isotopo quasi stabile è l’234 U (0.0055 %). 75 Re 62.93 187
76 Os β− 4.35 · 1010
A causa della lunga vita la sua attività è piccola ( A(238) = 12.4 · 10232 3
208
1.40 · 1010
90 T h 100.0 82 P b α (famiglia
dimenti /s·g; A(235) = 80·103 decadimenti/s·g; A (miscela isotopica) =
103 decadimenti /s · g).
radioattiva)
’uranio è distribuito su tutta la superficie terrestre come indicato in tab.235 U 0.72 207
7.03 · 108
92 82 P b α (famiglia
I principali minerali contenenti uranio sono la pechblenda o uranite, la
radioattiva)
otite e l’autunite (tutti ossidi di uranio).
’uranio ha una densità molto elevata (19.05g/cm3 , circa il doppio del238 92 U 99.27 206
82 P b α (famiglia 4.47 · 109
mbo), che lo rende utile ©nella costruzione delle chiglie delle
Bendiscioli, Fenomeni radioattivi imbarcazioni, radioattiva)
stabilizzatori degli aerei e negli schermi radiologici. Alcuni minerali se-
ari hanno
CORSO colori brillanti NUCLEARE
DI FISICA e fosforescenti- ePAOLO
furono usati in passato come
FINELLI DIP. FISICA ED ASTRONOMIA - UNIVERSITÀ DI BOLOGNA
(famiglia del nettunio) e la sua assenza in natura si6
   Decay chain: families
  tti i suoi nuclei hanno vita media breve rispetto all’età
o ha Three
         un tempo          di   dimezzamento               dell’ordine       di  10 6
                                                                                       anni
     •
   10 theanni
      9
                main decay chains (or families) are observed in nature: the thorium,
                   dell’   238
                                U . and
                                     Quello         che resta        oggi ininthree
                                                                                natura di
             radium   (or uranium)         the actinium     series, ending
 mento stabile isotopes
       different   stable  209
                              Bi.of lead.
     • AThe= 4n,
 ei minerali         contenenti
              mass number              uranio
                             of every isotope        (e lechains
                                                 in these     stesse
                                                                   can beconsiderazioni
                                                                          represented as
                 A = 4n + 2, and A = 4n + 3, respectively.
è prodotta sia dall’attività dell’                      235
                                                              U e dell’ U sia da
                                                                             238
     •
 enti.theDato      il  grande     periodo         dei   capostipiti,       i discendenti
        The long-lived starting isotopes of these three isotopes have existed since
             formation of the earth, ignoring the artificial isotopes and their decays
 oattivo
       since fra    loro e con i rispettivi capostipiti. Ciò significa
               the 1940s.
 una     famiglia
        Due   to the quitehanno
                            short    la
                                  half-lifestessa
                                            of its     attività
                                                   starting isotope   uguale      a
     • million years), the fourth chain, the neptunium series with A = 4n + 1,(2.14
                                                                      neptunium-237 quella
  i, se X indica un nucleo generico e A il capostipite,                               is il
       already extinct in nature, except for the final step: decay of bismuth-209.
                                      X
                       nX            T1/2
                          =           A
                                              Secular equilibrium                             (2.1)
                       nA            T1/2
   CORSO DI FISICA NUCLEARE - PAOLO FINELLI         DIP. FISICA ED ASTRONOMIA - UNIVERSITÀ DI BOLOGNA
7
232Th             decay chain
 The 4n chain of Th-232 is
 commonly called the
 Thorium Series.

 Beginning with naturally
 occurring thorium-232, this
 series includes the following
 elements: actinium, bismuth,
 lead, polonium, radium and
 radon.

 The series terminates with
 lead-208.
                          © Wikipedia and metadata.berkeley.edu

CORSO DI FISICA NUCLEARE - PAOLO FINELLI                          DIP. FISICA ED ASTRONOMIA - UNIVERSITÀ DI BOLOGNA
8

Uranium decay chain

Gamma-ray energy spectrum of uranium ore. Gamma-rays are emitted by decaying
nuclides, and the gamma-ray energy can be used to characterize the decay.
Using the gamma-ray spectrum, several nuclides that are typical of the decay chain
of 238U have been identified: 226Ra, 214Pb, 214Bi.
CORSO DI FISICA NUCLEARE - PAOLO FINELLI     DIP. FISICA ED ASTRONOMIA - UNIVERSITÀ DI BOLOGNA
9
235U           decay chain
 The 4n+3 chain of
 uranium-235 is commonly
 called the Actinium series.
 Beginning with the naturally-
 occurring isotope U-235, this
 decay series includes the
 following elements: actinium,
 astatine, bismuth, francium,
 lead, polonium, protactinium,
 radium, radon, thallium, and
 thorium.
 This series terminates with
 the stable isotope lead-207.
                          © Wikipedia and metadata.berkeley.edu

CORSO DI FISICA NUCLEARE - PAOLO FINELLI                          DIP. FISICA ED ASTRONOMIA - UNIVERSITÀ DI BOLOGNA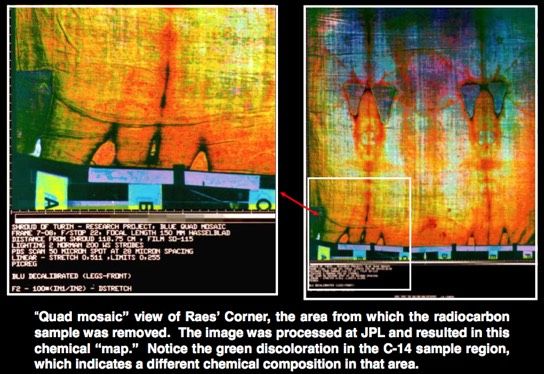
10
238U           decay chain
The 4n+2 chain of U-238 is
commonly called the Radium
Series (sometimes Uranium
Series).

Beginning with naturally
occurring uranium-238, this
series includes the following
elements: astatine, bismuth,
lead, polonium, protactinium,
radium, radon, thallium and
thorium.

The series terminates with
lead-206.                                  © Wikipedia and metadata.berkeley.edu

CORSO DI FISICA NUCLEARE - PAOLO FINELLI                    DIP. FISICA ED ASTRONOMIA - UNIVERSITÀ DI BOLOGNA
11
239Pu             decay chain
 Pu-239 decays into U-235,
 which is the start of the
 Actinium Series.
 Beginning with the isotope
 U-235, this decay series
 includes the following
 elements: Actinium, astatine,
 bismuth, francium, lead,
 polonium, protactinium,
 radium, radon, thallium, and
 thorium.
 This series terminates with
 the stable isotope lead-207.
                          © Wikipedia and metadata.berkeley.edu

CORSO DI FISICA NUCLEARE - PAOLO FINELLI                          DIP. FISICA ED ASTRONOMIA - UNIVERSITÀ DI BOLOGNA
12
241Am decay chain
Am-241 decays into Np-237
and then follows the
Neptunium Series decay
chain.
The following elements are
also present, at least
transiently, as decay products
of the neptunium: actinium,
astatine, bismuth, francium,
lead, polonium, protactinium,
radium, thallium, thorium,
and uranium.
© Wikipedia and metadata.berkeley.edu
CORSO DI FISICA NUCLEARE - PAOLO FINELLI DIP. FISICA ED ASTRONOMIA - UNIVERSITÀ DI BOLOGNA13
241Am decay chain
smoke detectors
The ionization chamber in a smoke detector is
essentially made by two metal plates at different
voltages. The ambient air molecules flow between
the plates, where they are ionized by the radiation
source. The negative and positive ions then are
attracted to the positive and negative plates,
resulting in a measurable constant current.
If the air contains smoke, electrostatic attraction causes the smoke particles to stick to ions in
the ionization chamber. The ions do not lose their electric charges when this happens, but
since the smoke particles are quite large compared to the ionized air molecules, the average
mass of the charged particles in the ionization chamber increases. These particles are still in
thermal equilibrium with the surrounding air, so they must have the same average thermal
energy. Thermal energy in a gas is proportional to mv2, so if the average mass m of the ions
increases, then their average speed v must decrease for the thermal energy to stay the
same. The decrease in average speed shows up as a decrease in the measured current, which
is what triggers the smoke detector's alarm.
© Wikipedia and Stanford Univ.
CORSO DI FISICA NUCLEARE - PAOLO FINELLI DIP. FISICA ED ASTRONOMIA - UNIVERSITÀ DI BOLOGNAa la reazione. Dal decadimento β del trizio ha origine la maggior parte 2.4 I raggi cosmici
3
He presente nell’atmosfera. 14
Natural nuclear radiations:
i della crosta terrestre e dell’atmosfera (tra2.9. Flussilaverticali dei raggi
L’atmosfera terrestre è investita da un flusso di particelle che ap
alla radiazione cosmica. Essa è prodotta soprattutto al di fuori
ella 2.4. Nuclei cosmogenici osservati. I “nuclei coinvolti” sono i principali solare e la sua composizione è costituita da tutte le particelle sta
Fig. con cosmici conelettroni,
la neutrini, E > 1 GeV a varie
positroni profondità
e protoni) nel-
e da nuclei con vita media de
cosmogenic nuclides and primary cosmic rays
zione cosmica può dare origine ai nuclei
parentesi)
l’atmosfera
elencati stimati
cui interazione
sullacolonna.[20]
nella prima base del flusso dei
di muoni negativi con E > 1 GeV . Modificato
106 nucleoni.
anni o più. ILa
da sorgenti
quadratini
radiazione mostrano
da astrofisiche
[16]
le misure
cosmica è costituita da una compone
e da una prodotta dall’interazione della c
primaria con il gas interstellare.
Radio Modo del T1/2 (anni) Nuclei coinvolti
Nuclide decadimento loro volta prodotti dall’interazione dei protoni primari con i nuclei atmosferici.
In seguito a un grande numero di collisioni i neutroni possono essere rallenta-
3
H β− 12.33 anni O,Mg,Si,Fe(O,N)
3
ti fino a raggiungere energie termiche alle quali hanno elevata probabilità di
He stabile assorbiti dall’azoto
essere (O) dando origine al 14 C:
10
Be β− 1.51 · 106 anni O,Mg,Si,Fe(O,N) Radiocarbon dating
14
C β −
5730 anni O,Mg,Si,Fe(N)
14
7 N + n → 14
6 C + p.
21
Ne Altri
stabile esempiMg,Al,Si,Fe
di reazioni, con probabilità molto inferiore, sono i seguenti:
36
Cl β− 3.01 · 105 anni Fe,Ca,K,Cl(Ar)
36
Ar CE, β + 35 giorni Fe,Ca,K,Cl(Ar)
39
Ar β− 269 anni Fe,Ca,K (Ar)
41
Ca CE; β + 1.03 · 105 anni Ca, Fe
129
I β− 1.57 · 107 anni Te,Ba,La,Ce(Xe)
126
Xe stabile Te,Ba,La,Ce,Inaturali cosmogenici
2.5 Radionuclidi 41
14
7 N +n → 11
5 B + 42 He Es ≈ 1M eV
Nella bassa atmosfera e nella crosta terrestre i Enuclei
s: threshold energyhanno
cosmogenici
ne prevalentemente dalla
14
+ n → dei
7 N cattura
12
6 C + 31 Hnegativi lenti
muoni ≈ 4M
Es e dalle eV
disin-
azioni nucleari prodotte dai muoni veloci. La concentrazione dei nuclei
8 O+n 4 Be + 4 Be > 40M
16 10 7
ogenici dipende dall’intensità della
→ radiazione cosmica cheEraggiunge
s l’at-
eV
era terrestre la quale, come si è già detto, dipende dall’intensità del cam-
magnetico terrestre e, secondariamente,
16 14 di quello
8 O + n → 6 C + 2 He
3 solare. E’Estato
s >accertato
40M eV
’intensità del campo magnetico terrestre ha subito rilevanti variazioni © Bendiscioli,
Fig. 2.5. Componenti Fenomeni
cariche della radioattivi
radiazione cosmica primaria
orsoCORSO
dei secoli, con conseguente variazione della produzione dei nuclei
Es è l’energia di soglia dei neutroni o energia cinetica minima perché av-
DI FISICA NUCLEARE - PAOLO FINELLI DIP. FISICA ED ASTRONOMIA - UNIVERSITÀ DI BOLOGNAradionuclidi artificiali sono sorgenti di α, e± , ν, ν̄ e γ. Un certo 15
Natural radiations:
artiene alla famiglia artificiale con capostipite il 237 N p.
artificial nuclides
. Nuclei artificiali presenti nell’ambiente (FS = Fissione Spontanea).
Radio Modo del T1/2
nuclide decadimento
3
H β 12.33 anni
14
C β 5730 anni
38
Sr β 28.78 anni
134
Cs β, γ 2.1 anni
137
Cs β, γ 30 anni
131
I β, γ 8 giorni Dangerous elements
103
Ru β 39.26 giorni in nuclear fallouts
140
Ba β 12.75 giorni (Chernobyl)
244
Pu α, FS 8.08107 anni
© Bendiscioli, Fenomeni radioattivi
significativi sono riportati in tab. 2.5. Alcuni di essi sono anche
CORSO DI FISICA NUCLEARE - PAOLO FINELLI DIP. FISICA ED ASTRONOMIA - UNIVERSITÀ DI BOLOGNA16
Biological effects
© Marvel Comics
CORSO DI FISICA NUCLEARE - PAOLO FINELLI DIP. FISICA ED ASTRONOMIA - UNIVERSITÀ DI BOLOGNAmaggiore. 17
Biological effects
© M. Curie,
1.1 “Storica” figura (tratta dalla tesi di Marie Curie, ACIC –Archives Curie
Ph. D. thesis
che evidenzia la diversità delle radiazioni e in base al loro diverso com
Trajectories under the effect
campo magnetico. La radiazione prosegue indisturbata, quelle e ve
direzioni diverse evidenziando cariche opposte. Le diverse traiettorie nel ca
of an electric field
mostrano inoltre come in questo caso le particelle di uno stesso fascio a
quindi energia) diversa.
Esperimenti successivi, in cui la radiazione venne sottoposta a
magnetici, rivelarono la presenza di una terza componente ad alta
come raggi . In un campo elettrico le particelle vengono fortem
il polo positivo, quelle sono deflesse in misura minore vers
mentre la traiettoria dei raggi non risente dell'effetto del campo
Paths into matter particelle sono dotate di carica negativa, le particelle trasporta
CORSO DI FISICA NUCLEARE - PAOLO FINELLI DIP. FISICA ED ASTRONOMIA - UNIVERSITÀ DI BOLOGNA18
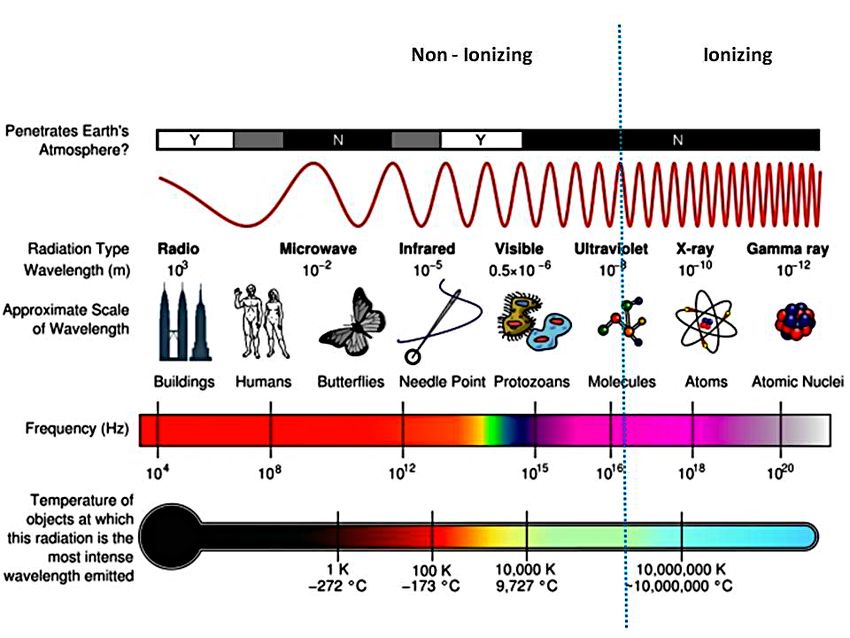
Radiations
Ionizing radiations Non-ionizing radiations
• Higher energy electromagnetic • Lower energy electromagnetic waves
waves (gamma) or heavy particles
(beta and alpha)
• High enough energy to pull • Not enough energy to pull an electron
electrons from orbit from orbits, but can excite the electron
• The radiation is able to disrupt
atoms and molecules on which
they pass through, giving rise to
ions and free radicals
CORSO DI FISICA NUCLEARE - PAOLO FINELLI DIP. FISICA ED ASTRONOMIA - UNIVERSITÀ DI BOLOGNA19 CORSO DI FISICA NUCLEARE - PAOLO FINELLI DIP. FISICA ED ASTRONOMIA - UNIVERSITÀ DI BOLOGNA
e di carattere generale rinviando a testi specifici per uno studio più                                       20

  Interactions with matter
 ondito.

                                                          • Both charged and uncharged particles
                                                            lose energy while passing through matter,
                                                            but stopping power describes only the
                                                            energy loss of charged particles.
                                                          • The stopping power depends on the type
   Stopping power

                                                            and energy of the radiation and on the
                                                            properties of the material it passes.
                                                          • Since the production of an ion pair, the
                                                            density of ionisation is proportional to the
                                                            stopping power.
                                                          • The 'stopping power' of the material is
                                                            numerically equal to the loss of energy E
                                                            per unit path length, x

                                                             S(E) =                  dE/dx

                    © Bendiscioli, Fenomeni radioattivi

   CORSO DI FISICA NUCLEARE - PAOLO FINELLI               DIP. FISICA ED ASTRONOMIA - UNIVERSITÀ DI BOLOGNA
con l’energia. Si noti la grande diversità fra il potere frenante e il cam
percorso dalle due particelle a parità di energia. 21
Interactions with matter
Range (R) in Aluminium
as a function of the
incident energy
© Bendiscioli, Fenomeni radioattivi
CORSO DI FISICA NUCLEARE - PAOLO FINELLI
Fig. 2.11. Percorso DIP.
(R)FISICA ED ASTRONOMIA
in alluminio - UNIVERSITÀ
di particelle α e β inDI funzione
BOLOGNAdella22
Interactions with matter
interactions / energy loss 2.7 Effetti biolo
al diminuire della velocità. A parità di carica elettri
Ene g loss equations
Energy
Bethe-Bloch is gigiven en by b Bethe-Bloch
Bethe(per Bloch
esempio, eq equation:
protoni)ation
sono molto più lente delle
esempio, elettroni) con la stessa energia cinetica
frenante più elevato. Similmente,
+ corrections a parità di veloc
elettrica più elevata hanno potere frenante più elev
elevato corrisponde un percorso più breve. Riassume
particelle
Tmax max energy transferpesanti (o con elevata carica elettrica) son
to free electron
leggere “più penetranti”. Inoltre, poiché proceden
Tmax max energy transfer to free electron
l’energia e la velocità diminuiscono, il potere frenan
first order: –dE/dx 1/speed2 un massimo in prossimità della fine del percorso (v
ax electron energy: Tmax 4 T me c 2 / m p c 2
Bragg peak
T=200 MeV Tmax 0.4 MeV range 1.4mm
….but
but most electrons far lower energy
Bragg curve
ctice we use range-energy tables
726-738 and measured depth dose curves.
W.H.
W.H. Bragg andBragg and
R. Kleeman, On R. Kleeman,
the ionization curvesOn the ionization
of radium, curves
Philosophical Magazine of radium,
S6 (1904), 726-738
Philosophical Magazine S6 (1904),
CORSO DI FISICA NUCLEARE - PAOLO FINELLI DIP. FISICA ED ASTRONOMIA - UNIVERSITÀ DI BOLOGNA23
Interactions with matter
interactions / energy loss
Ene g loss equations
Energy
Bethe-Bloch is gi
given
en by
b Bethe-Bloch
Bethe Bloch eq
equation:
ation
+ corrections
Tmax max energy transfer to free electron
Tmax max energy transfer to free electron
first order: –dE/dx 1/speed 2
Protons and other heavy charged particles deposit most of their
energy in a high-dose peak (known as the Bragg peak) at the end of
ax electron energy: Tmax
their track.
4 T me c / m p c 2
2
This peak is created through an exponential increase in stopping
power towards the T=200
end of theMeV
track. Hence,Tas
max
a 0.4 MeV range 1.4mm
heavy charged particle (such as a proton) slows down, the amount of
….but
but
energy it deposits per unit length covered most
increases electrons
exponentially, far lower energy
creating a high-dose peak.
The depth of this peak in a given material (such as a patient) depends
on its initial energy; varying this energy allows the high-dose region to
be placed at any depth.
ctice we use range-energy tables and measured depth dose curves.
CORSO DI FISICA NUCLEARE - PAOLO FINELLI DIP. FISICA ED ASTRONOMIA - UNIVERSITÀ DI BOLOGNA24
Interactions with matter
interactions / energy loss
Bethe-Bloch equations
Ene g loss is gi
Energy given
en by
b Bethe
Bethe-Bloch
Bloch eq
equation:
ation
5D TP
+ corrections
Tmax max energy transfer to free electron
Tmax max energy transfer to free electron
first order: –dE/dx 1/speed2
x electron energy: Tmax 4 T me c 2 / m p c 2
X"rays' C"ions'
T=200 MeV Tmax 0.4 MeV range 1.4mm
….but
but most electrons far lower energy
tice we use range-energy tables and measured depth dose curves.
Review of particle physics, C. Amsler et al., Physics Letters B667, 1 (2008)
Anna'ConstanInesu,'Ph.D.'thesis,'TU'Darmstadt'2014' © Constantinesu (Darmstadt)
CORSO DI FISICA NUCLEARE - PAOLO FINELLI DIP. FISICA ED ASTRONOMIA - UNIVERSITÀ DI BOLOGNA25
How does Proton Therapy work?
http://vimeo.com/ibaprotontherapy
CORSO DI FISICA NUCLEARE - PAOLO FINELLI DIP. FISICA ED ASTRONOMIA - UNIVERSITÀ DI BOLOGNA26
Radiations: gamma
48 2 Radiazione ambientale naturale
µ
µx
Fig. 2.13. Coefficiente di assorbimento lineare per fotoni fino a 10 M eV in
I=I e
allumnio. Sono mostrati0
i differenti contributi e la loro somma.[21]
© Bendiscioli, Fenomeni radioattivi
CORSO DI FISICA NUCLEARE - PAOLO FINELLI DIP. FISICA ED ASTRONOMIA - UNIVERSITÀ DI BOLOGNAEb ; la sua energia cinetica è 27
Radiations: gamma
48 2 Radiazione ambientale naturale
Ee = hν − Eb .
µ L’atomo residuo eccitato si diseccita emetten
Auger (vedi par. 7.7.5 del cap. 7) che, a loro v
atomi.
ii) Effetto Compton: un fotone di energia hν in
atomico; si trasforma in un fotone di energia
l’energia cinetica
µx
Fig. 2.13. Coefficiente di assorbimento lineare per fotoni fino a 10 M eV in
I=I e
allumnio. Sono mostrati0
i differenti contributi e la loro somma.[21]
© Bendiscioli, Fenomeni radioattivi
CORSO DI FISICA NUCLEARE - PAOLO FINELLI DIP. FISICA ED ASTRONOMIA - UNIVERSITÀ DI BOLOGNA28
Radiations: gamma
48 2 Radiazione ambientale naturale
µ
5.9. Cinematica di un processo di diffusione C
5.9. Cinematica di un processo di diffusione Compton.
totale, e la nuova frequenza è legata all’angolo di diffusi
h
h '
h
1 2
1 cos
µx
Fig. 2.13. Coefficiente di assorbimento lineare per fotoni fino a 10mMec
eV in
I=I e
allumnio. Sono mostrati0
i differenti contributi e la loro somma.[21]
© Bendiscioli, Fenomeni radioattivi
La variazione di frequenza
CORSO DI FISICA NUCLEARE - PAOLO FINELLI DIP. FISICA ED è perciò tanto
ASTRONOMIA maggiore
- UNIVERSITÀ quanto
DI BOLOGNAEe = hν − hν ′ − Eb . 29
Radiations: gamma L’entità dell’energia dipende dall’angolo di diffusione del fotone fin
48 2 Radiazione ambientale naturale + −
iii) Produzione di coppie e e : il fotone interagisce con il nucleo ato
con un elettrone e viene completamente assorbito con creazione
µ coppia positrone-elettrone; l’energia cinetica della coppia è
Ee+ + Ee− ∼
= hν − 2me c2 .
Successivamente il positrone annichila su un elettrone del mezzo con
sione di due fotoni, ognuno con energia uguale a me c2 = 0.511 M eV
a loro volta, interagiscono con gli atomi (vedi fig. 2.13).
L’effetto fotoelettrico prevale per fotoni con energia fino ad alcuni
produzione di coppie prevale al di sopra di 10 M eV e l’effetto Compto
regione energetica intermedia (vedi fig. (2.13)).
Come risultato dei processi descritti si ha che, nell’attraversare un
∆x di un mezzo materiale, i fotoni di un fascio, che supponiamo inizia
monoenergetico e con divergenza angolare nulla, in parte transitano se
teragire, in parte sono rimossi dal fascio (per effetto fotoelettrico e prod
di coppie), in
di parte si trasformano in fotoni meno energetici che devian
Fig. 2.13. Coefficiente µx
assorbimento lineare per fotoni fino a 10 M eV in
allumnio. Sono I=I e
traiettoriai originale
mostrati0 finchè none la
differenti contributi vengono, a loro volta, assorbiti. Pertant
loro somma.[21]
cedendo nel mezzo, i fotoni vengono progressivamente rimossi dal fas
© Bendiscioli, Fenomeni radioattivi
CORSO DI FISICA NUCLEARE - PAOLO FINELLI DIP. FISICA ED ASTRONOMIA - UNIVERSITÀ DI BOLOGNA30
Radiations: gamma
48 2 Radiazione ambientale naturale
µ
µx
Fig. 2.13. Coefficiente di assorbimento lineare per fotoni fino a 10 M eV in
I=I e
allumnio. Sono mostrati0
i differenti contributi e la loro somma.[21]
© Bendiscioli, Fenomeni radioattivi
CORSO DI FISICA NUCLEARE - PAOLO FINELLI DIP. FISICA ED ASTRONOMIA - UNIVERSITÀ DI BOLOGNA31
Radiations: gamma
48 2 Radiazione ambientale naturale
µ
µx
Fig. 2.13. Coefficiente di assorbimento lineare per fotoni fino a 10 M eV in
I=I e
allumnio. Sono mostrati0
i differenti contributi e la loro somma.[21]
© Bendiscioli, Fenomeni radioattivi
CORSO DI FISICA NUCLEARE - PAOLO FINELLI DIP. FISICA ED ASTRONOMIA - UNIVERSITÀ DI BOLOGNA32 Radiations: X CORSO DI FISICA NUCLEARE - PAOLO FINELLI DIP. FISICA ED ASTRONOMIA - UNIVERSITÀ DI BOLOGNA
33

Radiations: X

CORSO DI FISICA NUCLEARE - PAOLO FINELLI   DIP. FISICA ED ASTRONOMIA - UNIVERSITÀ DI BOLOGNA
34

Radiations: beta

                                                    Three-body spectrum:
                                                    energy and momentum are
                                                    shared between the final
                                                    nucleus, the electron
                                                    (positron) and the
                                                    antineutrino (neutrino)

CORSO DI FISICA NUCLEARE - PAOLO FINELLI   DIP. FISICA ED ASTRONOMIA - UNIVERSITÀ DI BOLOGNA
35
Radiations: alpha
p
ln(t1/2 ) = k/ E↵
Geiger-Nuttall law
© Bendiscioli, Fenomeni radioattivi
CORSO DI FISICA NUCLEARE - PAOLO FINELLI DIP. FISICA ED ASTRONOMIA - UNIVERSITÀ DI BOLOGNAad energia variabile, le diverse energie saranno ottenute facendo
36
cio iniziale attraverso speciali assorbitori atti a diminuire
Radiations: ions and alpha
l’energia. 5.6. Illustrazione del diverso percorso, della diversa perdita di energia e della
diversa distribuzione spaziale della ionizzazione per particelle e elettroni.
Tutto questo implica che l’intensità del fascio, in funzione della pene
annullerà in questo caso di colpo in un breve intervallo, ma in m
diffuso. L’effetto sarà anche maggiore nel caso in cui il fascio di elettr
da un decadimento , abbia già in partenza una certa distribuzion
pertanto una più variabile capacità di penetrazione. Come mostra la fig
diverse intensità di fasci di alfa e elettroni
bita (proporzionale al potere frenante lineare) in funzione della penetrazione in
si tipi di radiazioni: protoni, ioni 12C (a due energie) e fotoni di alta energia.
Relative dose
to di elettroni E
⇥ RBE
i delineato per le particelle cariche pesanti viene in parte modificato
n fascio di elettroni, M ottenuti ad esempio come prodotto di un
Il motivo principale consiste nel fatto che la massa dell’elettrone
© Bendiscioli, Fenomeni radioattivi
ale (e non enormemente più grande come nei casi precedenti) alla
CORSO DI FISICA NUCLEARE - PAOLO FINELLI
5.7. Intensità di fasci diDIP. FISICA EDeASTRONOMIA
particelle - UNIVERSITÀ
elettroni a diverse energie DI
in BOLOGNA
funzione della37
The nuclear medicine alphabet
500x
gamma
rays 5x cancer cells
SPECT
camera
alpha rays
tumor
chromosome
beta
rays 50000x
Auger
electrons
© Koester for NUPECC
CORSO DI FISICA NUCLEARE - PAOLO FINELLI DIP. FISICA ED ASTRONOMIA - UNIVERSITÀ DI BOLOGNASPECT isotopes 38
Radio- Half-life E I Decay type
nuclide (h) (keV) (%)
93 42
Ga-67 78 EC
185 21
Kr-81m 0.004 190 64 IT
Tc-99m 6 141 89 IT
171 91
In-111 67 EC
245 94
I-123 13 159 83 EC
Xe-133 126 81 38 -
70 59
Tl-201 73 EC
167 10
I-131 192 364 82 -
113 6 -
Lu-177 161
208 10
© Koester for NUPECC
CORSO DI FISICA NUCLEARE - PAOLO FINELLI DIP. FISICA ED ASTRONOMIA - UNIVERSITÀ DI BOLOGNA99Mo production (for generator) direct 99mTc production
39
Technetium-99m is well suited as a tracer because it
235U(n ,f) 100Mo(p,2n)
emits readily detectable 140 keV gamma rays (these th
238U(n
8.8pm photons are about the same wavelength as fast,f)
238U( ,f) natMo( ,x)
emitted by conventional X-ray diagnostic equipment)
and its half-life for gamma emission is 6.0058 hours 238U(p,f)
(meaning 93.7% of it decays to 99Tc in 24 hours). The 98Mo(d,n)
"short" physical half-life of the isotope and its 98Mo(n, )
biological half-life of 1 day (in terms of human activity natMo(n, ) 99Ru(n,p)
and metabolism) allows for scanning procedures 100Mo(d,p)
The chart
which of nuclides
collect data nuclear
rapidly but keep medicine perspective
total patient
100Mo(n,2n)
radiation exposure low.
100Mo(p,np)
SPECT
96Zr( ,n)
PET Cumulative use of diagnostic isotopes in Europe
Therapy 102Ru(n, )
201Tl 99mTc
186,188Re
177Lu
153Sm 201Tl
133Xe
123I131 131I
111In I
99m
68Ga
90 Tc
123I
67Ga
67Ga 89Sr Y
111In
18F PET
11C Other
A nuclear isomer is a metastable state of an atomic nucleus caused by the excitation
of one or more of its nucleons (protons or neutrons). "Metastable" refers to the fact
that these excited states have half-lives more than 100 to 1000 times the half-lives of
the excited nuclear states that decay with a "prompt" half life © Koester for NUPECC
CORSO DI FISICA NUCLEARE - PAOLO FINELLI DIP. FISICA ED ASTRONOMIA - UNIVERSITÀ DI BOLOGNA40
Beta therapy isotopes
Radio- Half- E Range E Range E I
nuclide life mean mean max max
(d) (MeV) (mm) (MeV) (mm) (keV) (%)
P-32 14.3 0.7 3 1.71 9.1 -
Sr-89 50.6 0.59 2.3 1.5 7.8 -
Y-90 2.67 0.93 4.4 2.28 12 -
284 6.1
I-131 8.03 0.18 0.39 0.81 3.7 364 81.5
637 7.2
Sm-153 1.94 0.22 0.55 0.81 3.7 103 29.3
Ho-166 1.12 0.67 2.8 1.85 10 81 6.6
113 6.2
Lu-177 6.65 0.13 0.23 0.50 1.9 208 10.4
Er-169 9.39 0.10 0.14 0.35 1.1 -
Re-186 3.72 0.35 1.1 1.07 5.2 137 9.5
Re-188 0.71 0.76 3.3 2.12 12 155 15.6
© Koester for NUPECC
CORSO DI FISICA NUCLEARE - PAOLO FINELLI DIP. FISICA ED ASTRONOMIA - UNIVERSITÀ DI BOLOGNARadio- Half- Daugh- Half- Cumulative E mean Range 41
Alpha nuclide life ters life /decay (MeV) ( m)
therapy Tb-149 4.1 h 0.17 3.97 25
Bi-212 1.01 h
isotopes Pb-212 10.6 h
Po-212 0.3 s
1 7.74 65
Bi-212 1.01 h Po-212 0.3 s 1 7.74 65
Bi-213 0.76 h Po-213 4 s 1 8.34 75
At-211 7.2 h Po-211 0.5 s 1 6.78 55
Rn-219 4s
Po-215 1.8 ms
Ra-223 11.4 d 4 6.59 >50
Pb-211 0.6 h
Bi-211 130 s
Rn-220 56 s
Po-216 0.15 s
Ra-224 3.66 d 4 6.62 >50
Pb-212 10.6 h
Bi-212 1.01 h
Fr-221 294 s
At-217 32 ms
Ac-225 10.0 d 4 6.88 >50
Bi-213 0.76 h
Po-213 4 s
Ra-223 11.4 d
Rn-219 4s
Th-227 18.7 d Po-215 1.8 ms 5 6.45 >50
Pb-211 0.6 h
© Koester for NUPECC
Bi-211 130 s
CORSO DI FISICA NUCLEARE - PAOLO FINELLI DIP. FISICA ED ASTRONOMIA - UNIVERSITÀ DI BOLOGNA42
Units and standards
1 curie = 3.7x10¹⁰ radioactive decays per second [exactly].
In the International System of Units (SI) the curie has been replaced by the becquerel (Bq)
1 becquerel = 1 radioactive decay per second = 2.703x10⁻¹¹ Ci.
1. The absorbed dose, sometimes also known as the physical dose, defined by the amount of
energy deposited in a unit mass in human tissue or other media. The original unit is the rad
[100 erg/g]; it is now being widely replaced by the SI unit, the gray (Gy) [1 J/kg], where 1 gray
= 100 rad.
2. The biological dose, sometimes also known as the dose equivalent, expressed in units of
rem or, in the SI system, sievert (Sv). This dose reflects the fact that the biological damage
caused by a particle depends not only on the total energy deposited but also on the rate of
energy loss per unit distance traversed by the particle (or "linear energy transfer"). For
example, alpha particles do much more damage per unit energy deposited than do
electrons. This effect can be represented, in rough overall terms, by a quality factor, Q. Over a
wide range of incident energies, Q is taken to be 1.0 for electrons (and for x-rays and gamma
rays, both of which produce electrons) and 20 for alpha particles. For neutrons, the adopted
quality factor varies from 5 to 20, depending on neutron energy.
The biological impact is specified by the dose equivalent H, the product of the absorbed dose D
and the quality factor Q: H = Q D.
CORSO DI FISICA NUCLEARE - PAOLO FINELLI DIP. FISICA ED ASTRONOMIA - UNIVERSITÀ DI BOLOGNA37
43
Units and standards
1 curie = 3.7x10¹⁰ radioactive decays per second [exactly].
In the International System of Units (SI) the curie has been replaced by the becquerel (Bq)
1 becquerel = 1 radioactive decay per second = 2.703x10⁻¹¹ Ci.
1. The absorbed dose, sometimes also known as the physical dose, defined by the amount of
energy deposited in a unit mass in human tissue or other media. The original unit is the rad
[100 erg/g]; it is now being widely replaced by the SI unit, the gray (Gy) [1 J/kg], where 1 gray
= 100 rad.
2. The biological dose, sometimes also known as the dose equivalent, expressed in units of
rem or, in the SI system, sievert (Sv). This dose reflects the fact that the biological damage
http://www.epa.gov/radiation/understand/calculate.html
caused by a particle depends not only on the total energy deposited but also on the rate of
energy loss per unit distance traversed by the particle (or "linear energy transfer"). For
example, alpha particles do much more damage per unit energy deposited than do
electrons. This effect can be represented, in rough overall terms, by a quality factor, Q. Over a
wide range of incident energies, Q is taken to be 1.0 for electrons (and for x-rays and gamma
rays, both of which produce electrons) and 20 for alpha particles. For neutrons, the adopted
quality factor varies from 5 to 20, depending on neutron energy.
The biological impact is specified by the dose equivalent H, the product of the absorbed dose D
and the quality factor Q: H = Q D.
CORSO DI FISICA NUCLEARE - PAOLO FINELLI DIP. FISICA ED ASTRONOMIA - UNIVERSITÀ DI BOLOGNA44 CORSO DI FISICA NUCLEARE - PAOLO FINELLI DIP. FISICA ED ASTRONOMIA - UNIVERSITÀ DI BOLOGNA
45

CORSO DI FISICA NUCLEARE - PAOLO FINELLI   DIP. FISICA ED ASTRONOMIA - UNIVERSITÀ DI BOLOGNA
46

Linear vs. threshold
 The linear no-threshold model (LNT) is a
 model used in radiation protection to
 quantify radiation exposition and set
 regulatory limits. It assumes that the long
 term, biological damage caused by
 ionizing radiation (essentially the cancer
 risk) is directly proportional to the dose.
 Radiation is always considered harmful with
 no safety threshold, and the sum of several
 very small exposures are considered to have
 the same effect as one larger exposure
 (response linearity).

                                                      ALARA (as low as reasonably achievable)

 The threshold model, which assumes that very small exposures are harmless, and the
 radiation hormesis model, which claims that radiation at very small doses can be beneficial.
 Because the current data are inconclusive, scientists disagree on which model should be used.

CORSO DI FISICA NUCLEARE - PAOLO FINELLI           DIP. FISICA ED ASTRONOMIA - UNIVERSITÀ DI BOLOGNA
flusso del radon dal terreno alle abitazioni. 47
Radon 2.8 Il radon 59
. 2.16: si passa da un minimo di 20 − 40 Bq/m3 (Calabria, Liguria) a un
assimo di 100 − 120 Bq/m3 (Lazio, Lombardia).
La concentrazione misurata in altri paesi industrializzati è 108 Bq/m3 in
ezia, 49 Bq/m3 nella ex repubblica federale Tedesca, 46 Bq/m3 negli Stati
niti, 21 Bq/m3 in Gran Bretagna. La media mondiale è di 40 Bq/m3 . In que-
o contesto il valore medio in Italia di 77 Bq/m3 è da considerarsi medio-alto.
differenze da luogo a luogo sono da correlare con le differenti caratteristiche
ologiche del suolo e dei materiali da costruzione utilizzati.
Fig. 2.16. Attività del radon nelle varie regioni italiane in Bq/m3 .
Sono tuttavia carenti le conoscenze sulla reale operatività di alcune de
soluzioni proposte e soprattutto sulla durata della loro efficacia. I princip
rimedi suggeriti sono:
a) l’interdizione all’ingresso del radon negli spazi abitati (mediante ventil
zione fra il suolo e la pavimentazione o l’inserimento di idonee barrie
CORSO DI FISICA NUCLEARE - PAOLO FINELLI DIP.
costituite da FISICA ED
materiali ASTRONOMIA
impermeabili - UNIVERSITÀ DI BOLOGNA
al radon);48 Radon CORSO DI FISICA NUCLEARE - PAOLO FINELLI DIP. FISICA ED ASTRONOMIA - UNIVERSITÀ DI BOLOGNA
49

Natural radioactivity

CORSO DI FISICA NUCLEARE - PAOLO FINELLI   DIP. FISICA ED ASTRONOMIA - UNIVERSITÀ DI BOLOGNA
o è di comprensione più immediata del sievert (joule per rosiKg)studi
pertraspare
“i che le radiazioni possono avere effetti benefici nel 50
ca
assorbimento di “piccole” dosi. Sfortunatamente, nella maggior parte de
detti ai lavori”. Per tale quantità è stato anche proposto il 2nome di
How a nuclear disaster could 64 tali
acronimo dell’espressione francese Dose Annuelle due aux tali
rosi
studi non
Radia
Radiations
erano
zione rivolti
ambie naturale
specificatamente
ntale agli effetti benefici e, nel cas
effetti fossero osservati, erano trascurati.
studi traspare che le radiazioni possono avere effetti benefici n
s, [19]). In base a questa convenzione, la dose originata dalle ovarie
assorbiment di “piccole” dosi. Sfortunatamente, nella maggior par
affect background radiation
i è espressa come multiplo della dose minima, come riportato in tab.
tali studi non erano rivolti specificatamente agli effetti benefici e, ne
tali effetti fossero osservati, erano trascurati.
explosions
131I beta decays in t1/2=8.02 d
Chernobyl
Nuclear
131I on the ground
Fig. 2.18. Deposito di 131 I per unità di superficie in Italia (Nord, Centro e
nelle settimane successive all’incidente di Chernobyl. Lo 131 Io decade β con T
8.02 giorni. [12]
Fig. 2.18. Deposito di
131
I per unità di superficie in Italia (Nord, Ce
131
nelle settimane successive all’incidente di Chernobyl. Lo Io decade β
8.02 giorni. [12]
131I in vegetables
17. Attività β totale Total
in ariabeta-activity in air (nBq/m 3
) e il 1987. L’atti-
(mBq/m3 ) negli anni tra il 1956
between
dia normale è inferiore a 10mBq/m 19563and 1987 aumenti rilevanti nei periodi
. Si hanno
60 e 1962-1965 (esplosioni nucleari in atmosfera) e nel 1987 (incidente al
Fig. 2.19. Concentrazione di 131 I nei vegetali a foglia in Italia (Nord, Cen
© Bendiscioli,
nucleare di Chernobyl). Fenomeni radioattivi
Sud) nelle settimane successive all’incidente di Chernobyl. [12]
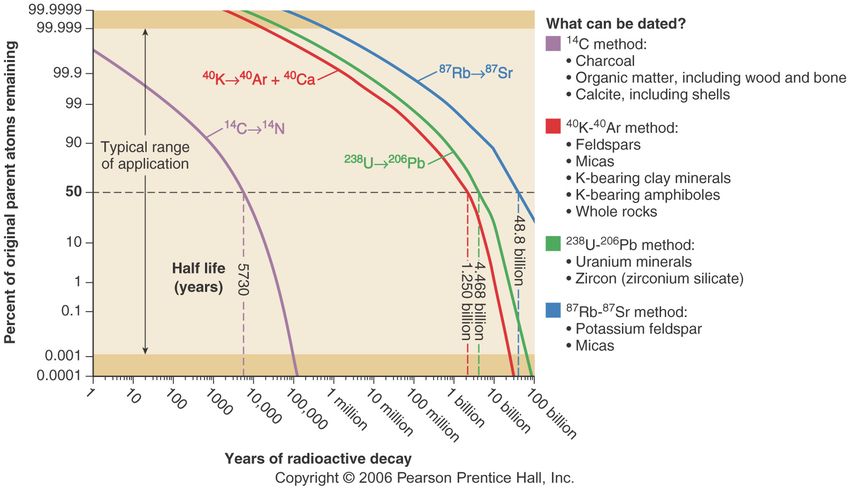
CORSO DI FISICA NUCLEARE - PAOLO FINELLI DIP. FISICA ED ASTRONOMIA - UNIVERSITÀ DI BOLOGNAWhat are commonly used isotopes for
51
Rocks dating
dating rocks?
On the x axis is
geologic time.
On the y axis is the % of parent isotope remaining in a sample.
the 4 colored lines represent
CORSO DI FISICA NUCLEARE - PAOLO FINELLI
4 different isotopes.
DIP. FISICA ED ASTRONOMIA - UNIVERSITÀ DI BOLOGNA52 14C dating CORSO DI FISICA NUCLEARE - PAOLO FINELLI DIP. FISICA ED ASTRONOMIA - UNIVERSITÀ DI BOLOGNA
Perhaps the most valuable metrological lesson from                                                                                                                              53
Libby’s early work was the extreme importance of
    14C                 dating
formulating a realistic theoretical estimate for the
sought-after “signal.” Without that as a guideline for
                                        Volume 109, Number 2, March-April 2004
designing a measurement
                  Journal of Research of theadequate
                            process  with                  detec- of Standards and Technology
                                             National Institute
tion or quantification capabilities, there is essentially
no possibility that natural radiocarbon could have
been found by chance with the then current radiation
instrumentation.
2.1 Standards and Validation
   Once the measurement of natural 14C became
feasible, the immediate task tackled by Libby and his
colleagues was to test the validity of the radiocarbon
dating model. The first step consisted of determining the
zero point of the natural radiocarbon decay curve— i.e.,
the radioactivity concentration (dpm 14C per gram C) in
living matter, and to test for significant geographic varia-
tion. This was a major component of the PhD thesis of
E. C. Anderson [7]; the result          (Ro) wasFrank
                                    Willard             (15.3 ±Libby 0.5) dpm/g
[255 Bq/kg] with no significant deviation from the
                                                    Chemistry       4
hypothesis of aFig.uniform        global      distribution.            The next
                    1. Portrait of W. F. Libby, about the time of publication of the first edition of his monograph, Radiocarbon Dating
                                                               (1960)
                        (1952), and statement of the Nobel Committee (1960) [3].
4                                                                            14
  The neutron
           Twointensity       in the atmosphere,
                   critical assumptions     are neededandforhence    the14C C produc-
                                                              absolute           thermal diffusion enrichment technique [6] was not: it
tion profile,dating:  constancy
               has major           of both the
                               variations       cosmic ray
                                             vertically      intensityof
                                                          (because       andcosmic
                                                                                 demanded
                                                                                    ray      very large samples and thousands of (1946)
absorption size
              withof the exchangeabledepth)
                      atmospheric         reservoir on average
                                                  and             for many
                                                        latitudinally            US of
                                                                           (because   dollars “to Fig.  4. Radiocarbon
                                                                                                  measure                     dating
                                                                                                            the age of a single         validation curve (1952): the “curve of
                                                                                                                                    mummy”
           thousands of years. A graphical summary of the above                  [4].
                                                                                   14 Development knowns”
                                                                                                       of an that     first demonstrated
                                                                                                               acceptable    technique was that absolute radiocarbon dating
geomagnetic     shielding)—See
           points is given in Fig. 2.  Figs.   2  and  3 in  Ref.   [2].  Because     C
                                                                                 formidable, as “worked.”
                                                                                                  outlined in Table     1. A substantial  in-represent tree rings and historical
                                                                                                                 The validation      points
has such a long     mean     life  (≈8000     a), however,     it was
               Libby first postulated the existence of natural C in   14 expected that
                                                                                 crease in signal was achieved by converting the sample
                                                                                                  artifacts of known age. The exponential function is not fit to the data,
any residual
           1946,gradients
                    at a levelinof the  global
                                   0.2 to         exchange
                                           2 Bq/mol   carbon (1reservoir
                                                                  dpm/g to would     be carbon, which coated the inner wall of a
                                                                                 to solid
           10   dpm/g)    [5].   His  first  experimental    task   was    to    specially        but“screen
                                                                                           designed    derived wallfrom   the independently
                                                                                                                     counter;” but  the back-    measured half-life and the 14C
undetectable, given the 3 % to 5 % uncertainties                 of Libby’s original
           demonstrate this presence of “natural” 14C in living                                   content
                                                                                 ground/signal ratio  (16:1)ofstill
                                                                                                                living   matterthe([2],
                                                                                                                    eliminated          Fig. 1).
                                                                                                                                    possibili-
measurements (Ref. [2], Chap. I).                                        14
         matter. The problem was that, even at 10 dpm/g, the C                     ty of meaningful measurements. At this point, Libby
         would be unmeasurable! The plan was to search for                         had an inspiration, from the analysis of the nature of the
    CORSOnatural 14
          DI FISICAC in NUCLEARE
                        bio-methane, but- PAOLO
                                          the background
                                                   FINELLIof his                           189radiation DIP.
                                                                                   background              [4]. He  concluded
                                                                                                                 FISICA          that it was
                                                                                                                           ED ASTRONOMIA      - UNIVERSITÀ DI BOLOGNA
54
14C dating
Volume 109, Number 2, March-April 2004
Journal of Research of the National Institute of Standards and Technology
Fig. 6. Radiocarbon Variations and Climate: the influence of solar activity (sunspot record) (top) on 14C concentrations (cosmic ray productio
rates) and climate (Maunder Minimum temperature record) (bottom) [15, 16].
amplitudes of about 1 % to 2 %. (See Figs. 1, 2 in the the figure suggests a strong link to global climate
Suess article, respectively, for plots of the first order represented here by the “little ice age.”
(geomagnetic) and second order (fine structure) devia-
tions from the ideal exponential decay function (“radio- 4. The Bomb
carbon age”).)
A fascinating link exists between dendrochronology Atmospheric nuclear testing had an unintended bu
Fig. 5. Radiocarbon Variations, discovered by comparison of high precision radiocarbon
and radiocarbon“dates”
age, related to climate. That is, tree profound impact on 14C geoscience. It approximatel
with high (annual) accuracy tree ring dates. The plot, which covers the periodrings byfrom abouttime series, like ice cores by their
their width doubled the 14C concentration in atmospheric CO2, an
18
O time series, give insight into ancient climate [16]. consequently in living matter, by the mid-1960s. Th
5000 BC to the present, represents an early version of the radiocarbon dating This,
calibration curve
in turn, may be linked to the aforementioned 14C came about because neutrons released from nuclea
([12], p.110). The photo shows the Bristlecone pine, the major source of dendrodates
variationsextending
from changing solar activity and/or varia- fission (or fusion) react with atmospheric nitrogen b
back many millennia (Photo is courtesy of D. J. Donahue). tions in geochemical reservoirs. Fig. 6 represents a exactly the same reaction, 14N(n,p)14C, as the secondar
famous example of the inter-relationships among solar neutrons from cosmic rays. The “bomb pulse” of exces
14
CORSO DI FISICA NUCLEARE - PAOLO FINELLI activity (sunspots), natural radiocarbon variations, and
DIP. FISICA ED ASTRONOMIA - UNIVERSITÀ DI BOLOGNA C was recorded in all parts of the living biosphere55
14C dating
Convention:
The atmospheric radiocarbon
anomaly with respect to a ! (14C / 12C ) "
14 spl
standard is defined as Δ14C Δ C = 14 12
# − 1$ *1000
#( C / C ) $
' std (
-solar activity changes
Note:
the Δ14C is 0 during
1890, b/c that s
the activity of the
oxalic acid standard
-addition of isotopically light
fossil fuel C to atmosphere
time
But how did somebody
construct this curve?
© Charles M. Rubin, California Institute of Technology
CORSO DI FISICA NUCLEARE - PAOLO FINELLI DIP. FISICA ED ASTRONOMIA - UNIVERSITÀ DI BOLOGNA56
14C dating - uncertainties
Source of Error in 14C dating
1. Variations in geomagnetic flux. Geomagnetic field strength partly
controls 14C production in the atmosphere because of attenuation
affects on the cosmic flux with increasing magnetic field strength.
2. Modulation of the cosmic-ray flux by increased solar activity (e.g.,
solar flares) leads to attenuation of the cosmic-ray flux.
3. Influence of the ocean reservoir. Any change in exchange rate
between ocean reservoir and atmospheric reservoir will affect the
level of 14C in the atmosphere.
4. Industrial revolution (ratio of 14C to stable carbon decreased
because of burning fossil fuels) and bomb effects (14C to stable
carbon increased because of increased neutron production from
detonation of nuclear bombs in the atmosphere) have made
modern organic samples unsuitable for as reference samples.
© Charles M. Rubin, California Institute of Technology
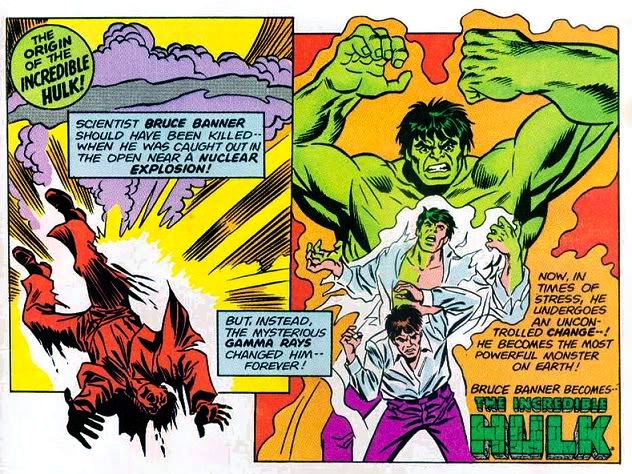
CORSO DI FISICA NUCLEARE - PAOLO FINELLI DIP. FISICA ED ASTRONOMIA - UNIVERSITÀ DI BOLOGNA57 The Shroud of Turin CORSO DI FISICA NUCLEARE - PAOLO FINELLI DIP. FISICA ED ASTRONOMIA - UNIVERSITÀ DI BOLOGNA
58

The Shroud of Turin: history
                                                        Described as a full image with blood
 Speculated Pre-1357 History                            stains from what appeared to be a
                                                        person’s abdominal wound

 30-57: Edessa, present day Turkey                             Stolen from Constantinople
 57: Disappeared                                               in1204 by French knights
                                                               during the Crusades
 525: Found
 944: Constantinople
 1204: Disappeared
                                                   (1192) Hungarian Pray Manuscript
 1357- 1418: Lirey, France                         codex shows illustration of Jesus
 1418- 1452: Saint Hippolyte-sur-Doubs             being placed on burial cloths --
 1452- 1454: Chambery                              placement of body supports marks
 1532: Damaged in fire at Chambery                 shown on Shroud/Cloth

 1454- 1578: Various Locations
 1506: Pope Julius II declared the Shroud is
 authentic
 1578- Present: Kept at Turin, Italy
CORSO DI FISICA NUCLEARE - PAOLO FINELLI   DIP. FISICA ED ASTRONOMIA - UNIVERSITÀ DI BOLOGNA
59
1192: Hungarian Pray Manuscript
(1192) Hungarian Pray Manuscript
codex shows illustration of Jesus
being placed on burial cloths --
placement of body supports marks
shown on Shroud/Cloth
CORSO DI FISICA NUCLEARE - PAOLO FINELLI DIP. FISICA ED ASTRONOMIA - UNIVERSITÀ DI BOLOGNA60
The Shroud of Turin: history
Speculated Pre-1357 History French knight Geoffrey de Charny displayed a
burial shroud in Lirey, France that he claimed
belonged to Christ (de Charny was a descendant of
a prominent knight of the Fourth Crusade, the
30-57: Edessa, present day Turkey exact time during which the Cloth of Edessa was
57: Disappeared stolen from Constantinople)
525: Found
944: Constantinople
1204: Disappeared
1357- 1418: Lirey, France
Shroud was given in 1453 to Duke Louis Savoy of
1418- 1452: Saint Hippolyte-sur-Doubs the House of Savoy in France.
1452- 1454: Chambery A special chapel was built for the Shroud; however,
a fire broke out in 1532 and damaged the cloth --
1532: Damaged in fire at Chambery this may have an effect on modern samplings and
1454- 1578: Various Locations chemical tests
1506: Pope Julius II declared the Shroud is
authentic
1578- Present: Kept at Turin, Italy
CORSO DI FISICA NUCLEARE - PAOLO FINELLI DIP. FISICA ED ASTRONOMIA - UNIVERSITÀ DI BOLOGNA61
STURP
© Barrie Schwortz, www.shroud.com
CORSO DI FISICA NUCLEARE - PAOLO FINELLI DIP. FISICA ED ASTRONOMIA - UNIVERSITÀ DI BOLOGNA62
STURP
© Barrie Schwortz, www.shroud.com
CORSO DI FISICA NUCLEARE - PAOLO FINELLI DIP. FISICA ED ASTRONOMIA - UNIVERSITÀ DI BOLOGNA63
STURP
© Barrie Schwortz, www.shroud.com
CORSO DI FISICA NUCLEARE - PAOLO FINELLI DIP. FISICA ED ASTRONOMIA - UNIVERSITÀ DI BOLOGNA64
STURP
© Barrie Schwortz, www.shroud.com
CORSO DI FISICA NUCLEARE - PAOLO FINELLI DIP. FISICA ED ASTRONOMIA - UNIVERSITÀ DI BOLOGNA65
STURP
© Barrie Schwortz, www.shroud.com
CORSO DI FISICA NUCLEARE - PAOLO FINELLI DIP. FISICA ED ASTRONOMIA - UNIVERSITÀ DI BOLOGNA66 The Shroud of Turin: 14C dating CORSO DI FISICA NUCLEARE - PAOLO FINELLI DIP. FISICA ED ASTRONOMIA - UNIVERSITÀ DI BOLOGNA
67

The Shroud of Turin:                                     14C        dating

   The results of the radiocarbon testing at Arizona, Oxford, and
   Zurich labs give the age range of the Shroud of Turin from AD
   1260-1390 with 95% confidence (between AD 1292 and 1358
   with 66% confidence).

   None of the measurements from the twelve sets of tests (four
   textile samples at each of the three laboratories) differ much
   from the appropriate mean value (none by more than two
   standard deviations).

   This provides conclusive evidence that the linen of the
   Shroud of Turin is Medieval.

CORSO DI FISICA NUCLEARE - PAOLO FINELLI            DIP. FISICA ED ASTRONOMIA - UNIVERSITÀ DI BOLOGNA
68

The Shroud of Turin:                                    14C        dating
In this method, a sample of complex organic molecules is oxidized into a
compound (C/CO2) which is then negatively charged by an ion source. An
accelerator system separates the positively charged 14C particles and is
detected and counted by a detector system.
The method was used because it only required samples 7cm2 in size.
Other methods need samples to be 500cm2. (ETH, University of Oxford,
University of Arizona)

CORSO DI FISICA NUCLEARE - PAOLO FINELLI            DIP. FISICA ED ASTRONOMIA - UNIVERSITÀ DI BOLOGNA
69

The Shroud of Turin:                           14C        dating

CORSO DI FISICA NUCLEARE - PAOLO FINELLI   DIP. FISICA ED ASTRONOMIA - UNIVERSITÀ DI BOLOGNA
70

     The Shroud of Turin:                                                                                                        14C                   dating

         14
6. AMS C dating results (“blind”) for the Turin Shroud (sample-1) and three control samples of known
 amples-2,3,4), from the three AMS laboratories: Z (Zürich), O (Oxford), and A (Arizona). Dates are
ssed as “Radiocarbon Years” before present (BP); uncertainties represent 95 % confidence intervals [38].
                                                                                                                                            Volume 109, Number 2, March-April 2004
                                                                                                           Journal of Research of the National Institute of Standards and Technology

                                                                                                           Fig. 16. AMS 14C dating results (“blind”) for the Turin Shroud (sample-1) and three control samples of known
              Fig. 17. Transformation of the Radiocarbon Age (BP) to the Calendar
                                                                                                           age (samples-2,3,4), from the three AMS laboratories: Z (Zürich), O (Oxford), and A (Arizona). Dates are
              Age (AD) of the Shroud. The 14C age (95 % CI) of (691 ± 31)                                  expressed as “Radiocarbon Years” before present (BP); uncertainties represent 95 % confidence intervals [38].
              BP corresponds to a two-valued calendar age as a result of the non-
              monotonic radiocarbon dating calibration curve. As indicated in the
              figure, the projected calendar age ranges are: (1262–1312) AD and
              (1353–1384) AD [38].

                         203
      CORSO DI FISICA NUCLEARE - PAOLO FINELLI                                                                          DIP. FISICA ED ASTRONOMIA - UNIVERSITÀ DI BOLOGNA
Puoi anche leggere