Iridium (Ir: PGM or precious & rare-expensive Platinum Group Metal commodity) state of long-term chart Graphical Contest & M10 rules ...
←
→
Trascrizione del contenuto della pagina
Se il tuo browser non visualizza correttamente la pagina, ti preghiamo di leggere il contenuto della pagina quaggiù
Iridium (Ir: PGM or precious &
    rare-expensive Platinum
Group Metal commodity) state
 of long-term chart {Graphical
     Contest & M10 rules}.

  【 Researchgate Project】By … 0000-0001-5086-7401 & lnkd.in/erZ48tm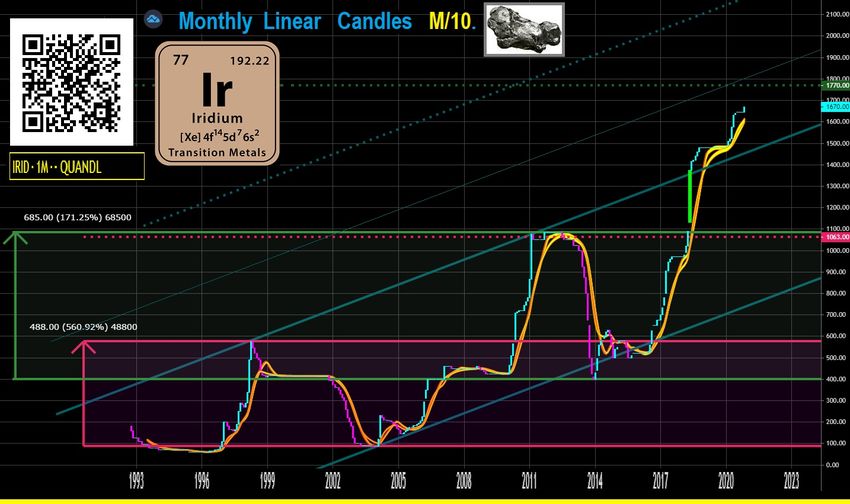
Iridium (Ir) configured the thirty-year lows in the mid-90s (1995/1996); since then
there have been 2 other important minimum events (2003-2004; 2009) such that
the price structure has always remained ascending.
From the levels of US$ 60 in 1995-1996, Ir has undergone an important asymptotic
rise in about 24 months, which took the prices to 9.6X in 1998, to about US$ 575
(a hypothetical first demand vs. supply break).
The next phase is a very hard corrective A / B / C, with back-to-base in the US$ 90
area in 2003 (- 84.3%: about 48 months) !!
Just as quickly as in the previous phase of decline (1998-2003), prices recovered
the previous key levels (2003-2007-2008), not suffering melt-down during the
critical period 2007-2009.
During this price evolution a Graphical Contest (Vicidomini, 2018) was set up (pink
area: top-1998 vs. bottom-2003) validated on the upside in May 2010, with an
impressive hypothetical second break in demand vs. offer.
The Graphical Contest bullish target of US$ 1063 with + 84.9% (top realized: 1085,
+ 88.7% or 1.89X among the highs), is reached almost instantly in February 2011.
The intercept with the target is marked by a prolonged phase of price stagnation in
the target area, until December 2012. The entire movement (bottom December
2003 vs. top September 2011: 87 US$ vs. 1085 US$) is, also in this case, an
approximately tenfold, 12.5X in about 93 months.
With the beginning of 2013 a new bearish corrective is born, which will bring prices
to 400 US$ in December 2013 (12 months exactly: -63.1%).
After a phase of low direction (lateral-ascending) in 2014-2015, Ir from 2016
onwards undergoes a new bullish acceleration and in May 2018 the second
Graphical Contest is validated on the upside (green area: top-2011-2012, 1085
US$ vs. bottom December 2013, US$ 400), with a violent acceleration to current
historical highs (US$ 1670 top in November 2020) and about US$ 100 away from
the target of the green Graphical Contest. Only a sharp decrease in prices below
the MID-level of the green Graphical Contest will cause the cancellation of the
existing bullish structure, which, at the moment, can be considered virtually
completed.
An exceptional graphic element derives from the exceeding of US$ 1085 top, with
the violent acceleration candle (green) of May 2018, that also exceeds the wide
historical upward channel in which Ir has been framed for over thirty years. In the
event of definitive validation of the figures, the first dynamic target will be placed (in
2021) on the half-width projection of the channel itself (level: 1830-1860 US$). The
second and most remote target is represented by the complete upper translation of
the ascending channel (year 2021, level: 2180-2220 US$).
This target is very close to that which can be calculated by simply translating the
previous tops; from US$ 575 to US$ 1085 (April 1998 vs. September 2011: 161
months, 1.89X); applying this factor to 1085 US$ we get 2051 US$!! This hyper-
bullish scenario will only be stopped by the return of prices within the original
ascending channel, and will suffer a stop if prices fall below 1085; the hyper bullish
scenario will be canceled in the event of a bearish extension towards the lower
edge of the original ascending channel itself.
The scenario with the greatest probability therefore appears not only to be bullish,
but also the most so, with final movement evaluations over US$ 2180.
Applying the multiplication factor observed in the two previous violent ascending
phases, we would obtain:
9.6X to US$ 400 = 3840 US$;
12.5X to 400 US$ = 5000 US$.
On the projection of time it can certainly be said that the 24 months of the factor
9.6X have already passed (December 2015). Therefore the three possible
estimates would be those deriving from the arithmetic mean of the two previous
movements on the minimums ((24 + 93)/2 = 58-59 months), or by applying only the
projection of 93 months, or the projection of time obtained between the two
previous key highs (161 months). The time targets would therefore be:
October-November 2018;
September 2021;
May 2027.
The current state of the graphic structure of Ir and Rh (Vicidomini, 2020a), shows
important signs of a break in the balance between supply and demand, which
could lead to absolutely very high valuations of PGM metals in this decade. An
element in support of this scenario would come from the various bullish structural
graphic signals present both for Pd (Vicidomini, 2020b) and above all for Pt
(Vicidomini, 2020c, 2020d). But see also the recent Ni price evolution (Vicidomini,
2020e), and the secular price-structure of Pt (Vicidomini, 2020f).
The decade 2020-2030 will be an era of massive financial stress for rare,
expensive and precious-industrial commodities??
There will be an impact also on OIL and U??
The current decade, will exhibit high inflation (drived from commodity and energy:
Vicidomini, 2019) but with collapsed bank rates??
L'Iridio (Ir) ha configurato i lows trentennali a metà anni '90 (1995/1996); da allora
si sono susseguiti 2 altri importanti eventi di minimo (2003-2004; 2009) tale che la
struttura portante dei prezzi è rimasta sempre ascendente.
Dai livelli di 60 US$ del 1995-1996, Ir ha subito una rilevante ascesa asintotica in
24 mesi circa, che ha portato le quotazioni a 9.6X nel 1998, a quota 575 US$ circa
(un ipotetico primo scollo domanda vs. offerta).
La successiva fase è un correttivo durissimo A/B/C con back-to-base in area 90
US$ nel 2003 (- 84.3%: 48 mesi circa)!!
Altrettanto rapidamente della precedente fase di discesa (1998-2003), i prezzi
hanno recuperato i precedenti livelli chiave (2003-2007-2008), non subendo melt-
down durante il periodo critico 2007-2009.
Proprio durante questa evoluzione prezzi è stato edificato un Graphical Contest
(Vicidomini, 2018; area in rosa: top-1998 vs. bottom-2003) validatasi al rialzo in
maggio 2010, con un imponente ipotetico secondo scollo domanda vs. offerta.
L'obiettivo rialzista del Graphical Contest a 1063 US$ con un +84.9% (top
realizzato: 1085, +88.7% o 1.89X tra i massimi), viene raggiunto quasi
istantaneamente nel febbraio 2011. L'intercetta col target è contrassegnata da una
fase prolungata di stasi dei prezzi proprio in area target, fino al dicembre 2012.
L'intero movimento (bottom dicembre 2003 vs. top settembre 2011: 87 US$ vs.
1085 US$) risulta anche in tal caso una circa decuplicazione, 12.5X in 93 mesi
circa.
Con l'inizio del 2013 nasce un nuovo correttivo ribassista che porterà i prezzi a
400 US$ nel dicembre 2013 (12 mesi esatti: -63.1%).
Dopo una fase di bassa direzionalità (lateral-ascendente) nel 2014-2015, Ir dal
2016 in poi subisce una nuova accelerazione rialzista e a maggio 2018 viene
validato al rialzo il secondo Graphical Contest (area in verde: top-2011-2012, 1085
US$ vs. bottom dicembre 2013, 400 US$), con violenta accelerazione fino ai
massimi storici correnti (1670 US$ top di novembre 2020) e a circa 100 US$ di
distanza dal target del Graphical Contest verde. Solo un forte decremento dei
prezzi sotto il MID-level del Graphical Contest verde causerà l'annullamento della
struttura rialzista in essere, che però allo stato attuale è considerabile virtualmente
ultimata.
Un elemento grafico eccezionale è derivante dal superamento di quota 1085 US$,
con la violenta candela (verde) di accelerazione di maggio 2018 che supera anche
l'ampio canale ascendente storico nel quale è inquadrato Ir da oltre trent'anni. In
caso di definitiva validazione delle figura, il primo target dinamico sarà collocabile
nel 2021 sulla proiezione di metà ampiezza del canale stesso (quota: 1830-1860
US$). Il secondo e più remoto target è rappresentato dalla traslazione superiore
completa del canale ascendente (quota 2021: 2180-2220 US$).
Quest'ultimo target è decisamente prossimo a quello calcolabile dalle semplice
traslazione dei massimi precedenti; da 575 US$ a 1085 US$ (aprile 1998 vs.
settembre 2011: 161 mesi) 1.89X; applicando questo fattore a 1085 US$ si ottiene
2051 US$!! Questo scenario iper-rialzista verrà stoppato solo dal rientro dei prezzi
all'interno del canale ascendente originario; subirà un arresto nel caso i prezzi
scendano sotto 1085; verrà annullato in caso di allungo ribassista verso il bordo
inferiore del canale ascendente originario stesso.
Lo scenario a maggior probabilità appare pertanto quello non solo rialzista, ma
anche quello maggiormente tale, con valutazioni finali di movimento oltre 2180
US$.
Applicando il fattore di moltiplicazione osservato nelle due precedenti fasi violente
ascendenti si otterrebbe:
9.6X 400 US$ = 3840 US$;
12.5X 400 US$ = 5000 US$.
Sulla proiezione di tempo certamente si può affermare che i 24 mesi del fattore
9.6X sono già passati (dicembre 2015). Pertanto le tre stime possibili
risulterebbero quelle derivanti dalla media aritmetica dei due movimenti precedenti
sui minimi {(24+93)/2 = 58-59 mesi), oppure applicando la sola proiezione dei 93
mesi, oppure la proiezione di tempo ottenuta tra i due precedenti massimi chiave
(161 mesi). I target di tempo sarebbero pertanto:
ottobre-novembre 2018;
settembre 2021;
maggio 2027.
Lo stato attuale della struttura grafica di Ir e Rh (Vicidomini, 2020a), mostra segni
importanti di rottura nell'equilibrio tra domanda e offerta, il che potrebbe portare in
questo decennio a valutazioni assolutamente altissime dei metalli PGM. Un
elemento a sostegno di questo scenario verrebbe dei diversi segnali grafici
strutturali rialzisti presenti sia per Pd (Vicidomini, 2020b) sia soprattutto per Pt
(Vicidomini, 2020c, 2020d). Ma vedasi la recente evoluzione prezzi di Ni
(Vicidomini, 2020e) e la struttura secolare dei prezzi di Pt (Vicidomini, 2020f).
Il decennio 2020-2030 sarà un'era di enorme stress finanziario per le materie
prime industriali rare, costose e preziose ??
Ci sarà un impatto anche su OIL e U ??
Il decennio in corso mostrerà un'inflazione elevata (derivata da materie prime ed
energia: Vicidomini, 2019) con tassi bancari azzerati??
REFERENCES
Vicidomini Salvatore, 2018 - Graphical Contest: proposta di un modello per unificare numerose
figure grafiche dell'analisi tecnica di curve finanziarie. Graphical Contest: proposal of a model to unify
numerous graphic figures of the technical analysis of financial curves. -
DOI:10.13140/RG.2.2.30356.73603 - https://www.researchgate.net/publication/327238561
Vicidomini Salvatore, 2020a - Rhodium (rare, precious, metal PGM-commodity) state of long-
term chart {Graphical Contest & M10 rules}. - DOI:10.13140/RG.2.2.33083.03367 -
https://www.researchgate.net/publication/339678075
Vicidomini Salvatore, 2020b - Palladium (Pd: PGM or precious & rare-expensive Platinum
Group Metal commodity): in-progress & large Graphical Contest (M10). -
https://www.researchgate.net/project/Financial-Quantitative-Easing-BitCoin-and-the-CryptoCurrencies-
Economy-some-effects/update/5fc50e79d6d02900019a970e
Vicidomini Salvatore, 2020c. - Platinum (Pt: PGM or precious & rare-expensive Platinum Group
Metal commodity) final melt down or long term reversal (Graphical Contest&M10rules)?? -
https://www.researchgate.net/project/Financial-Quantitative-Easing-BitCoin-and-the-CryptoCurrencies-
Economy-some-effects/update/5fc76feed6d02900019b05e8
Vicidomini Salvatore, 2020d. - Platinum (Pt: PGM or precious & rare-expensive Platinum Group
Metal commodity) final melt down or long term reversal (Graphical Contest&M10rules)?? Part 2. -
https://www.researchgate.net/project/Financial-Quantitative-Easing-BitCoin-and-the-CryptoCurrencies-
Economy-some-effects/update/5fc90040d6d02900019b58cf
Vicidomini Salvatore, 2020e. - Nickel (Ni) an industrial metal commodity associated to PGM
mines (Graphical Contest & M10 rules): long term side evolution toward a direction??
https://www.researchgate.net/project/Financial-Quantitative-Easing-BitCoin-and-the-CryptoCurrencies-
Economy-some-effects/update/5fca711b3b21a200015fcf2e
Vicidomini Salvatore, 2020f. - Platinum (Pt: PGM or precious & rare-expensive Platinum Group
Metal commodity) final melt down or long term reversal (Graphical Contest&M10rules)?? Part 3. -
https://www.researchgate.net/project/Financial-Quantitative-Easing-BitCoin-and-the-CryptoCurrencies-
Economy-some-effects/update/5fcb87d63b21a200015ffa3a
Vicidomini Salvatore, 2019. - WTI Crude OIL Future: State of (long-term) Charts, with Graphical
Contest & M/10 rules.September 2019. - DOI:10.13140/RG.2.2.23016.70403 -
https://www.researchgate.net/publication/335827400PREVIOUS Ir POSTS
2020, October. Osmium {Os} prices state of mid-term chart {PGM or precious & rare-expensive
Platinum Group Metal commodities}. -
https://www.forexfactory.com/thread/post/13232273#post13232273
2020, May. Iridium (Ir: PGM or precious & rare Platinum Group Metal). -
https://www.researchgate.net/project/Financial-Quantitative-Easing-BitCoin-and-the-CryptoCurrencies-
Economy-some-effects/update/5ec5896b8c9064000159bccc
2019, August. Rhodium & Iridium again in the PGM-Sky?? Precious Platinum (Rare) Metal
Group State of the Charts, according to Graphical Contest rules {M/10}. -
https://www.forexfactory.com/thread/post/12471739#post12471739
2011, February. - Aggiorno breve commento-analisi sull'Iridio. -
https://www.finanzaonline.com/forum/futures-cfd-leverage-certificate-cw-e-commodities/1102092-
financial-markets-observatory-lab-ex-aurum-post28279501.html#post28279501
2009, December. Chart. - https://www.finanzaonline.com/forum/attachments/messaggi-
archiviati-fol/1172095d1260663935-sul-filo-del-rasoio-3-commodity-forex-gov-bonds-breadth-
sentiment-options-sal.vi2.jpg
.Puoi anche leggere