SIS 2017 Statistics and Data Science: new challenges, new generations Proceedings of the Conference of the Italian Statistical Society ...
←
→
Trascrizione del contenuto della pagina
Se il tuo browser non visualizza correttamente la pagina, ti preghiamo di leggere il contenuto della pagina quaggiù
SIS 2017
  Statistics and Data Science:
new challenges, new generations
             28–30 June 2017
             Florence (Italy)

Proceedings of the Conference
of the Italian Statistical Society

                edited by
          Alessandra Petrucci
            Rosanna Verde

         FIRENZE UNIVERSITY PRESS
                   2017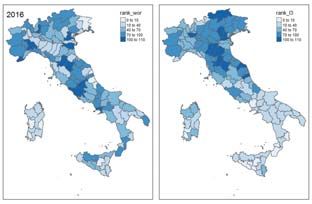
SIS 2017. Statistics and Data Science: new challenges, new
   generations : 28-30 June 2017 Florence (Italy) : proceedings
   of the Conference of the Italian Statistical Society / edited
   by Alessandra Petrucci, Rosanna Verde. – Firenze : Firenze
   University Press, 2017.
   (Proceedings e report ; 114)

   http://digital.casalini.it/9788864535210

   ISBN 978-88-6453-521-0 (online)

Peer Review Process
All publications are submitted to an external refereeing process under the responsibility of the FUP
Editorial Board and the Scientific Committees of the individual series. The works published in the
FUP catalogue are evaluated and approved by the Editorial Board of the publishing house. For a
more detailed description of the refereeing process we refer to the official documents published on
the website and in the online catalogue of the FUP (www.fupress.com).
Firenze University Press Editorial Board
A. Dolfi (Editor-in-Chief), M. Boddi, A. Bucelli, R. Casalbuoni, M. Garzaniti, M.C. Grisolia, P.
Guarnieri, R. Lanfredini, A. Lenzi, P. Lo Nostro, G. Mari, A. Mariani, P.M. Mariano, S. Marinai, R.
Minuti, P. Nanni, G. Nigro, A. Perulli, M.C. Torricelli.

This work is licensed under a Creative Commons Attribution 4.0 International License
(CC BY 4.0: https://creativecommons.org/licenses/by/4.0/legalcode)

CC 2017 Firenze University Press
Università degli Studi di Firenze
Firenze University Press
via Cittadella, 7, 50144 Firenze, Italy
www.fupress.com
SOCIETÀ ITALIANA DI STATISTICA
                   Sede: Salita de’ Crescenzi 26 - 00186 Roma
                  Tel +39-06-6869845 - Fax +39-06-68806742
                email: sis@caspur.it web:http://www.sis-statistica.it
La Società Italiana di Statistica (SIS), fondata nel 1939, è una società scientifica
eretta ad Ente morale ed inclusa tra gli Enti di particolare rilevanza scientifica. La
SIS promuove lo sviluppo delle scienze statistiche e la loro applicazione in campo
economico, sociale, sanitario, demografico, produttivo ed in molti altri settori di
ricerca.

Organi della società:
Presidente:
- Prof.ssa Monica Pratesi, Università di Pisa

Segretario Generale:
- Prof.ssa Filomena Racioppi, Sapienza Università di Roma

Tesoriere:
- Prof.ssa Maria Felice Arezzo, Sapienza Università di Roma

Consiglieri:
- Prof. Giuseppe Arbia, Università Cattolica del Sacro Cuore
- Prof.ssa Maria Maddalena Barbieri, Università Roma Tre
- Prof.ssa Francesca Bassi, Università di Padova
- Prof. Eugenio Brentari, Università di Brescia
- Dott. Stefano Falorsi, ISTAT
- Prof. Alessio Pollice, Università di Bari
- Prof.ssa Rosanna Verde, Seconda Università di Napoli
- Prof. Daniele Vignoli, Università di Firenze

Collegio dei Revisori dei Conti:
- Prof. Francesco Campobasso, Prof. Michele Gallo, Prof. Francesco Sanna, Prof.
Umberto Salinas (supplente)
SIS2017 Committees Scientific Program Committee: Rosanna Verde (chair), Università della Campania “Luigi Vanvitelli” Maria Felice Arezzo, Sapienza Università di Roma Antonino Mazzeo, Università di Napoli Federico II Emanuele Baldacci, Eurostat Pierpaolo Brutti, Sapienza Università di Roma Marcello Chiodi, Università di Palermo Corrado Crocetta, Università di Foggia Giovanni De Luca, Università di Napoli Parthenope Viviana Egidi, Sapienza Università di Roma Giulio Ghellini, Università degli Studi di Siena Ippoliti Luigi, Università di Chieti-Pescara “G. D’Annunzio” Matteo Mazziotta, ISTAT Lucia Paci, Università Cattolica del Sacro Cuore Alessandra Petrucci, Università degli Studi di Firenze Filomena Racioppi, Sapienza Università di Roma Laura M. Sangalli, Politecnico di Milano Bruno Scarpa, Università degli Studi di Padova Cinzia Viroli, Università di Bologna Local Organizing Committee: Alessandra Petrucci (chair), Università degli Studi di Firenze Gianni Betti, Università degli Studi di Siena Fabrizio Cipollini, Università degli Studi di Firenze Emanuela Dreassi, Università degli Studi di Firenze Caterina Giusti, Università di Pisa Leonardo Grilli, Università degli Studi di Firenze Alessandra Mattei, Università degli Studi di Firenze Elena Pirani, Università degli Studi di Firenze Emilia Rocco, Università degli Studi di Firenze Maria Cecilia Verri, Università degli Studi di Firenze Supported by: Università degli Studi di Firenze Università di Pisa Università degli Studi di Siena ISTAT Regione Toscana Comune di Firenze BITBANG srl
How to Exploit Big Data from Social
        Networks: a Subjective Well-being
        Indicator via Twitter

        Stefano Maria Iacus, Giuseppe Porro, Silvia Salini and Elena Siletti

        Abstract In our research we apply a new technique of opinion analysis over
        Twitter data to propose a new indicator of perceived and subjective well-
        being: The SWBI examines many dimension of individual and social life. In
        the purpose to investigate whether SWBI and its single components may ad-
        equately represent the reaction of a community to changes in everyday life
        conditions, we propose a comparative analysis, among the Italian provinces,
        of perceived well-being, measured with SWBI, with objective well-being, mea-
        sured with the Il Sole 24 Ore QoL Index. The idea is to create a composite
        well-being indicator which mixes stable official statistics and fluctuating so-
        cial media data.
        Abstract Nella nostra ricerca applichiamo una nuova tecnica di analisi dei
        dati provenienti da Twitter per proporre un nuovo indicatore di benessere
        percepito e soggettivo: L’SWBI considera molte dimensioni della vita individ-
        uale e sociale. Per indagare se l’SWBI e i suoi singoli componenti possano
        rappresentare in modo adeguato la reazione di una comunità ai cambiamenti
        delle condizioni di vita di tutti i giorni, proponiamo un’analisi comparativa,
        tra le province italiane, del benessere percepito, misurato con l’SWBI, e del
        benessere oggettivo, misurato con l’indice della qualità della vita de il Sole
        24 Ore. L’idea è di creare un indicatore composito di benessere che integri le
        statistiche ufficiali e i dati provenienti dai social media.

        Key words: well-being, social indicators, big data, social networks, senti-
        ment analysis

        Stefano Maria Iacus, Silvia Salini, Elena Siletti
        Department of Economics, Management and Quantitative Methods, University of
        Milan
        e-mail: stefano.iacus,silvia.salini,elena.siletti@unimi.it
        Giuseppe Porro
        Department of Law, Economics and Culture, University of Insubria
        e-mail: giuseppe.porro@uninsubria.it

                                                                                                          537

Alessandra Petrucci, Rosanna Verde (edited by), SIS 2017. Statistics and Data Science: new challenges, new generations.
28-30 June 2017 Florence (Italy). Proceedings of the Conference of the Italian Statistical Society
ISBN (online) 978-88-6453-521-0 (online), CC BY 4.0, 2017 Firenze University Press
538 Stefano Maria Iacus, Giuseppe Porro, Silvia Salini and Elena Siletti 1 Introduction: Theoretical Frameworks In the last decades scholars have become increasingly interested in new mea- sures of quality of life. A milestone in 2009, when the so-called Stiglitz Com- mission proposed to build a system of objective and subjective indicators, with a strong influence in further studies: different indicators, with different structures, considering a great variety of dimensions and for many purposes are now considered. For subjective indicators, self-reports have been exten- sively used, forgetting that they are often misleading (9) and despite the efforts made it remains much uncertainty using them (6). The two main limitations: the influence that a single question can have, and the limited frequency of the surveys, that may fail in capturing the trend changes and in distinguishing between the short-run “emotional” and the structural compo- nent (“life evaluation” or “life satisfaction”). Social networks offers a new rich source of information, which is avail- able without any survey, they simply allow to listen to. They host an open, enormous amount of data that allow to study social dynamics from an un- seen perspective. Analysing them allows to listen to what people say: with well-being this means to be able to measure feelings in real-time, mapping its fluctuation (5). In the last years researchers have used these data for a wide range of applications including monitoring influenza and other health outbreaks, predicting the stock market, and understanding sentiment about products or people. There exists a wide set of works aiming at tracking hap- piness through Twitter, for the Italian provinces, (5) propose the iHappy index, that is measured with an innovative statistical techniques on millions of tweets. Social media data enable to collect longitudinal data and to measure phenomena more frequently. Skeptics have questioned whether enthusiasts’ claims are overly optimistic (4), and whether any form of non-probability sampling as this new analysis is too risky (1). Others noted that media data may introduce new kind of bias (2), which raises the question of whether they are sufficiently reliable. We need to understand, to solve the new challenges: we can not ignore this new and rich source of information. While big data are unlikely to replace high quality surveys, they could be useful when there are not. The two methods can serve complementary functions. Sentiment analysis is the core aspect, despite many limitations (4), if cor- rectly performed, it seems to be a useful framework to exploit when the constraints of standard survey methodology may be too strong (8). On one hand there are no questions to pose, all that the analyst has to do is to listen to and classify the opinions expressed accordingly; on the other hand, the available information is updated in real time and hence the frequency can be as high as desired, allowing for separating the volatile/emotional component from the permanent/structural one. With the SWBI (Social Well-being index) we make a new proposal, relying on Twitter data and on one of the most recent techniques for sentiment
How to Exploit Big Data from Social Networks                                        539

analysis. This approach disentangles the main methodological issues raised
in the literature on well-being measurement, and produces a set of indicators
that span the wide range of well-being perceptions.

2 The SWBI

The SWBI is a multidimensional indicator derived from a new human super-
vised technique (iSA-Integrated Sentiment Analysis (3)) designed to capture
several aspects. In iSA algorithm the human part is essential because infor-
mation can be retrieved from texts without relying on dictionaries of special
semantic rules. Human just read a text and associate a topic (D = “satisfied
at work”) to it. Then, the computer learn the association between the whole
set of words used in a text to express that opinion and extends the same rule.
   Formally, let us denote by D = {D0 , D2 , . . . , DM } the set of possible cat-
egories (i.e. opinions). The target of interest is {P (D), D ∈ D}, i.e. the dis-
tribution of opinions in a corpus of N texts. D0 refers to Off-topic or not
relevant texts (i.e. noises). Let Si , i = 1, . . . , K, be a vector of L possible
stems which identifies one of the texts in a corpus. More than one text in the
corpus can be represented by the same Si and is such that each element is
equal to 1 if that stem is contained in a text, or 0 in absence. Formalized data
set is {(sj , dj ), j = 1, . . . , N } where sj ∈ S̄ (the space of possible vectors Sj )
and dj can either be “NA” or one of the hand coded categories D ∈ D.
   The “traditional” approach includes machine learning methods and sta-
tistical models; predict the outcome of dˆj = D for the texts with S = sj
belonging to the test set; when all data have been imputed, estimated cate-
gories dˆj are aggregated to obtain an estimate of P̂ (D). We can write

                               P (D) = P (D|S)P (S)                                 (1)
                                M ×1       M ×K    K×1

where P (D|S) is a M × K matrix of conditional probabilities, and P (S)
is a vector with the distribution of Si over the corpus. Once P (D|S) is es-
timated from the training set with, say, P̂ (D|S), then for each document
in the test set with stem vector sj , the opinion dˆj is estimated with the
simple Bayes estimator as the maximizer of the conditional probability, i.e.
dˆj = arg maxD∈D P̂ (D|S = sj ). This approach does not work if P (D0 ) is
very large compared to the rest of the Di ’s. iSA follow the idea by (7) of
changing the point of view but goes one step further in terms of computa-
tional efficiency and variance reduction. Instead of (1), one can consider this
new equation
                            P (S) = P (S|D)P (D)                          (2)
                                K×1       K×M     M ×1
540 Stefano Maria Iacus, Giuseppe Porro, Silvia Salini and Elena Siletti
where now P (S|D) is a matrix whose elements P (S = Sk |D = Di ) represent
the frequency of a particular stem Sk given the set of texts which actually
express the opinion D = Di . The solution of the problem is
−1 T
(inverse problem) P (D) = [P (S|D)T P (S|D)] P (S|D) P (S) (3)
M ×1 M ×M M ×K K×1
Equation (3) is such that the direct estimation of the distribution of opin-
ion P (D) is obtained but individual classification is no longer possible. In
fact, this is not a limitation as the accuracy of (3) with respect to (1) is
vastly better. Moreover, researchers are comprehensibly more interested in
the aggregate distribution of opinions than in the estimation of individual
opinion (3).
To define SWBI, we inspired by NEF (New Economic Foundation) and
their Happy Planet Index. It has eight dimensions concerning three dif-
ferent well-being areas. Each component is defined through the hypotheti-
cal question one might find: no questions, the sentiment is extracted from
the text. Here the components: Personal well-being: emotional well-
being-(emo), satisfying life-(sat), vitality-(vit), resilience and self-esteem-
(res), positive functioning-(fun);Social well-being: trust and belonging-
tru), relationships-(rel);Well-being at work: quality of job-(wor).
Each tweet has been classified according to the scale -1, 0, 1, where -1 is
for negative, 0 is neutral and 1 is positive feeling. To enhance the action of
human supervision, additional rules have been introduced:
• Each tweet can be classified along one or more dimensions;
• Only self-expressed or individual expression of well-being or own views of the
tweeter are considered;
• Re-tweet are considered, because the tweeters share the same view;
• Off-Topic texts are marked appropriately;
• If the encoders are not fully convinced about the semantic context they do not
classify the text, just skip it and classify another one.
Our data source are tweets written in Italian language from Italy, accessed
through Twitter’s public API. Around 1 to 5% each day tweet contain geo-
reference information which allows to build indicators at province level. From
February 2012 we have stored and analysed more than 180 millions of tweets.
3 The SWBI and the Il Sole 24 Ore QoL Index in the
Italian Provinces
Since 1990, the Italian business newspaper Il Sole 24 Ore publishes an in-
dex of the quality of life (QoL) for all the Italian provinces. Since 2016,
the composite indicator has six components based on a simple arithmetic
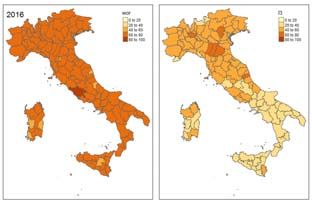
mean of 42 normalized indicators. To analyse its components according toHow to Exploit Big Data from Social Networks 541 the SWBI, we rescaled from 0 to 100. Here the components:I1-Income, Sav- ings, Consumption;I2-Environment, Services,Welfare;I3-Business, Work, In- novation; I4-Justice, Security, Crime; I5-Demographics, Family, Integration; I6-Culture, Leisure, Participation. As one can see, the Il Sole 24 Ore QoL Fig. 1 All the Figure refer to 2016, with red shades the original index, with blue shades the ranking of the Italian provinces index cover only material quality of life and, for this reason, has become a benchmark indicator for objective well-being. Despite efforts to improve the quality, the index, in addition to having a low frequency with only an annual data, often shows delayed information. This is a serious flaw when decision- makers want to base their choices on such information. As we noticed, SWBI has the twofold advantage to be a high frequency instrument, which can be updated almost in real time. On the other hand, SWBI is an index of sub- jective well-being, and the differences between the two dimensions (objective and subjective) clearly emerge from the comparison of the two indicator. As an example, we compare the SWBI component on well-being at work (wor) to the I3 (Business, Work and Innovation) component of Il Sole 24 Ore QoL index, where the quality of work and labour market is evaluated by objective quantities (total employment rate, exports in % of GDP, number of innovative start-ups per 1000 enterprises, number of registered enterprises per 100 inhabitants, loans on deposits ratio, patent applications per 1000 inhabitants, rate of youth unemployment 15-24 years). Clearly the informa- Fig. 2 SWBI and Il Sole 24 Ore Index Components in Milan, in red lines respectively, the I3 and wor component tion conveyed by the two indicators is not the same. First of all (see Fig. 1,
542            Stefano Maria Iacus, Giuseppe Porro, Silvia Salini and Elena Siletti

left panels) shows a strong polarization: Northern and Central Italy have I3
values significantly higher compared to the Southern provinces; (wor), on the
other side, is more stable across provinces and does not show appreciable con-
centration phenomena. The evidence is confirmed by the ranking of provinces
according to (wor) and I3 values, respectively (see Fig. 1, right panels).
   Moreover, even if we polish out the volatility of (wor) due to its high
frequency and compare the annual average values of (wor) and I3, different
trends must be pointed out. Let us examine, for example, the indicators for
the city of Milan since 2013 (see Fig.2): while I3 shows a slightly increasing
trend, (wor) exhibits a remarkable increase starting from 2015, and the same
behaviour is shown by almost all the SWBI components since 2016. Maybe
that the feeling of a recovery of the economic conditions and an improved
confidence in personal and collective future have an impact on perceived well-
being even beyond the possibility to observe these improvements in current,
traditional and objective economic indicators.

References

[1] Baker, R., Brick, J.M., Bates, N.A., Battaglia, M., Couper, M.P., Dever,
    J.A., Gile, K.J., Tourangeau, R.: Summary report of the aapor task force
    on non-probability sampling. Journal of Survey Statistics and Methodol-
    ogy 1(2), 90 (2013)
[2] Biemer, P.P.: Total survey error: Design, implementation, and evaluation.
    The Public Opinion Quarterly 74(5), 817–848 (2010)
[3] Ceron, A., Curini, L., Iacus, S.M.: isa: a fast, scalable and accurate algo-
    rithm for sentiment analysis of social media content. submitted pp. 1–30
    (2015)
[4] Couper, M.P.: Is the sky falling? new technology, changing media, and
    the future of surveys. Survey Research Methods 7(3), 145–156 (2013)
[5] Curini, L., Iacus, S., Canova, L.: Measuring idiosyncratic happiness
    through the analysis of twitter: An application to the italian case. Social
    Indicators Research 121(2), 525–542 (2015)
[6] Feddersen, J., Metcalfe, R., Wooden, M.: Subjective wellbeing: why
    weather matters. Journal of the Royal Statistical Society: Series A (Statis-
    tics in Society) 179(1), 203–228 (2016)
[7] Hopkins, D., King, G.: A method of automated nonparametric content
    analysis for social science. American Journal of Political Science 54(1),
    229–247 (2010)
[8] King, G.: Preface: Big data is not about the data In: R.M. Alvarez
    (ed.) Computational Social Science: Discovery and Prediction, chap. 1,
    pp. 1–10. Cambridge University Press, Cambridge (In Press)
[9] Schwarz, N.: Self-reports: how the questions shape the answers. American
    psychologist 54(2), 93–105 (1999)
Puoi anche leggere